Volume 6, No. 6, June - July 2015
International Journal of Advanced Research in Computer Science
RESEARCH PAPER
Available Online at www.ijarcs.info
An Efficient Fuzzy Entropy Based Feature Selection Algorithm for High Dimensional
Data
Mrs. D. SheelaJeyarani
Research Scholar Department Of Computer Science Mother Teresa Women’s University
Kodaikanal,TamilNadu,India.
Dr. Mrs. A. Pethalakshmi
Head &Associate Professor Department Of Computer Science M.V.M Government Arts College(W)
Dindigul,TamilNadu,India.
Abstract: Feature selection is an important processing step in machine learning and the design of pattern recognition system. Feature selection involves identifying a subset of the most useful features that produces compatible results as the original entire set of features. In this work, fuzzy entropy of each feature is calculated and filtered using linear search as well as redundancy is removed to judge on features suitability. The obtained results indicate that the generated features are of maximum relevance and with minimum degree of redundancy. Finally the proposed algorithm is applied to four different data sets, with four different threshold values and also compared against FCBF algorithm. Also the performance metrics (sensitivity, specificity and accuracy) and dimension metrics (features than the FCBF algorithm.selected) are compared for all the four data sets. All the results show that the proposed algorithm can give significant results for the feature selection process.
Keywords: Fuzzy Entropy, Feature Selection, Symmetrical Uncertainty, Fuzzy Mutual Information, High Dimensional Data
I. INTRODUCTION
The remarkable progress witnessed in the hardware technology has led computers to store huge amount of data. The available source of information must be explored appropriately. This can be a great challenge to learn algorithms. Feature selection is used as a preprocessing step to machine learning. Feature selection enables reducing dimensionality, increasing learning accuracy and improving the results[1].In this work feature selection will be depicted for high dimensional data.
In this process, the data sets with several thousands of features will be collected (high dimensional data). Such high dimensional data may lead to a high degree of irrelevant and redundant information. This in turn affects the performance of learning algorithm. In order to overcome this, feature selection becomes unavoidable in these tasks.
The two main approaches in feature selection algorithms are Filter approach and Wrapper approach [2]. Filter approach does not depend on learning algorithm. It relies on general characteristics of the training data to select features. Filter approach is faster, does not require re-execution, less expensive and highly suitable for very large number of features. This can remove both irrelevancy and redundancy efficiently. The wrapper approach needs one predetermined mining algorithm. Wrapper approach is expensive to run[3], less general and intractable for large data bases. Hence the filter approach will be used to develop a feature selection algorithm. In this work an efficient feature selection algorithm is proposed that gives significant results for high dimensional data.In section 2 we discuss survey of related work. In section 3, we discussed methodologies used for feature selection process and also proposed the algorithm for efficient feature selection. Section 4 deals with experimental analysis. Finally the paper concluded in section 5.
II. RELATED WORK
In the filter approach, Feature weighting algorithm and Subset search algorithm are the two dominant categories of the various feature selection algorithms. Feature weighting algorithm assigns weights to features separately and rank them based on their relevance to the target concept. A feature is relevant and will be selected if its weight is greater than a threshold value. ‘Relief’ is a popular algorithm that deals with relevance evaluation [4]. The basic idea of ‘Relief’ is to estimate the relevance of features according to how well their values distinguish between the instances of the same and different classes that are near each other.
‘Relief’ sets number (m) of instances from the training set and estimate relevance of features based on the difference between the selected instance and the two nearest instances of the same and opposite classes. ‘Relief’ does not remove redundant features. Many algorithms in this model can only identify the relevance of features to the target concept, but cannot identify and remove redundancy. But feature selection literature shows that redundant features also affect the speed and accuracy of learning algorithm and hence should be eliminated along with the process of relevant feature selection [5].
There are two subset search features selection algorithm namely Consistency measure [6] and Correlation measure [7]. They enhance in removing both irrelevant and redundant features. Consistency measure selects a minimum number of features that separate classes as consistently as the full set of features can. Correlation measure is applied to evaluate the goodness of feature subset based on the hypothesis that a good feature subset is one that contains features highly correlated with the class, yet uncorrelated with each other.
Genetic Algorithm).It deals with the issue of identifying important features in building an intrusion Detection System.Rough set and neural network based reduction was proposed by K. Thangavel and A. Pethalakshmi[9]. It demonstrates attribute reduction on medical datasets. Kun-Ming Yu, Kun-Ming-Feng Wu, and Wai-TakWong [10], have described protocol based classifications. The protocol based classification was described by using genetic algorithm with logistic regression in their work.
Chuzhou[11] discusses the discernibility matrix function and reduction of features. T.Subbulakshmi[12]proposes ‘Misuse and Anomaly detection’ using Support Vector Machine, NBayes, and Artificial Neural Network approaches informs the detection rate and false alarm rates.Y.Y.Yao and Y. Zhao [13]have applied in various fields their methodology to identify the reduction set of the set of all attributes of the decision system. The reduction set has been used as pre-processing technique for classification of the decision system. It brings out the potential patterns or association rules or knowledge through data mining techniques.
Jen-Da Shie,Shyi-Ming Chen et al.,[14] has dealt with the feature selection based fuzzy entropy for handling classification problems. The fuzzy entropy method is compared with OFFSS method, OFEI method, the FQI method and the MIFS method to get more accuracy.The fuzzy redundant entropy was explained by Hamid Parvinet al.,[15] and compared with the other feature selection methods. Fuzzy entropy based feature selection methods are discussed in [16, 17, 18].
III. METHODOLOGY
Symmetrical uncertainty based feature selection method and fuzzy entropy based feature selection methods are discussed in the following sections.
A. Symmetrical Uncertainty Based Feature
Selection:
The existing subset search algorithms do not have strong scalability to deal with high dimensional data.In order to address these problems, a suitable algorithm is developed based on the information theoretical concept of entropy.Such an algorithm can select features efficiently remove features with high speed and improve learning accuracy. Linear correlation and Information theory arethe two approaches to measure the correlation between two random variables.The linear correlation coefficient r, for a pair of variables (X, Y) is given by
2
)
(
2
)
(
)
)(
(
i
y
i
y
i
i
x
i
x
i
i
y
i
y
i
x
i
x
i
r
−
∑
−
∑
−
−
∑
=
(1)
Here
x
i is the mean of X.y
i is the mean of Y. The value of r is in the interval [-1,1]. If X and Y are completely dependent, r takes the value of -1,1. If X and Y are totally independent r takes the value zero. Least square regression error and maximal information compression index [19] are variations of linear correlation. Removal of features with non-zero correlation to the class, reduction of redundancy among selected features is the advantage of using linearcorrelation. The main disadvantage of using linear correlation are, features should contain numerical values and should be linear in nature.
Relevant features have strong correlation with target concept and so are necessary for a best subset. But redundant features are not, because, their values are completely correlated with each other. Thus notions of feature redundancy and feature relevance are in terms of feature correlation and feature-target concept correlation.
Mutual information measures how much the distribution of the feature values and target classes differ from statistical independence. This is a nonlinear estimation of correlation between feature values or feature values and target classes. The symmetrical uncertainty (SU)[20] is derived from the mutual information by normalizing it to the entropies of feature values and target classes and has been used to evaluate goodness of features. The symmetrical uncertainty is defined as follows:
SU(X,Y) = 2Gain(X/Y)/ (H(X)+H(Y))
Where H(X) is the entropy of a discreet random variable x and is defined by
H(X) =
−
∑
ii
i
P
x
x
P
(
)
log
2(
(
))
Where
P
(
x
i)
the probability of X. Gain (X/Y) is theamount by which the entropy of Y decreases. It reflects the additional information about Y provided by X and is called information gain[21] which is given by
Gain (X/Y) = H(X) - H(X/Y) = H(Y) – H(Y/X)
Where H(X/Y) is the conditional entropy which quantifies the remaining entropy.
Suppose, P(X) is the prior probabilities for all values of X and P (X/Y) is the posterior probabilities of X given the values of Y, H(X/Y) is defined by
∑
∑
−
=
i i
i i i
i
i
P
x
y
P
x
y
y
P
Y
X
H
(
/
)
(
)
(
/
)
log
2(
(
/
))
Thus symmetrical uncertainty is computed to find the goodness of features.Fast correlation based feature selection algorithm (FCBF) was developed [22] to select goodness of features based on symmetrical uncertainty. In this algorithm, features are selected according to the threshold value decided by the user as the method of feature weighting algorithms. To remove redundant features, we need to decide whether the level of correlations between two features in the set of selected features is high enough to cause redundancy so that one of them can be removed .
B. Fuzzy entropy based feature selection:
Entropy is a measure of uncertainty in the outcome of random experiment, or a measure of the information obtained when the outcome is observed. Of the various definitions, Shannon contributed the broadest and the most fundamental definition of the entropy measure in information theory.
In information theory, the Shannon entropy is a measure of the uncertainty associated with a random variable [23]. The concept of Fuzzy entropy is an extension to Shannon entropy in which fuzzy sets are used to aid the estimation of the entropies. Measuring of fuzzy entropy is
(5) (2)
(3)
completely different from Shannon entropy, because fuzzy entropy contains fuzziness (possibility) uncertainties while Shannon entropy contains randomness uncertainties (probabilistic). The concept of fuzzy entropy was introduced is 1972[24]. Many modifications to the original fuzzy entropy were introduced [25,26] after that. The new fuzzy entropy is computed with less time, with better results that it is with statistical approach.
Based on the utilization of the fuzzy C-means clustering algorithm (FCM)[27], fuzzy entropy is estimated by automatically computing the membership. The Fuzzy C-means rise to cluster measurement vectors by searching for local minima of the within group sum of squared error functions (WGSSE) proposed by Trivedi and Bezdeck[28] and is given by
Lm (U, v) =
∑
∑
= =
−
c i j A i k m ik n kx
P
v
x
U
1 2 1)
(
|
|
)
(
WhereC : is the number of clusters, n : is the number of vectors
xk : is a k’th measurement vector, x€ Rn
vi : is the i’th centroid vector,
m : is the fuzzy coefficient, | . |A : is an inner product norm,
|Q|2A = QT AQ, and A is a d*d positive definite matrix where d is the dimension of the pattern vectors. When m=1, the objective function Lm in Equ. 6 is the classical WGSSE
function and the algorithm reduces to the crisp k-means clustering algorithm. For m > 1 under the assumption that xk≠ vi (U,v) may be a local minimum of Lm only if
𝑣𝑣
𝑖𝑖=
∑ (𝑢𝑢𝑖𝑖𝑖𝑖)𝑚𝑚𝑥𝑥𝑖𝑖 𝑛𝑛
𝑖𝑖=1
∑𝑛𝑛𝑖𝑖=1(𝑢𝑢𝑖𝑖𝑖𝑖)𝑚𝑚
(8)
The membership of each pattern in all clusters is computed byFCM algorithm. The cluster are represented by centroid vi and then normalize the membership of each
specific pattern xk in all clusters. If this process,along each
feature is applied instead of each pattern we have the membership of each feature in all clusters mapped to sum up to one. Now instead of computing probability of each feature in each class we have the actual membership of this feature in the classes that also sum up to one. From now on we will have a new term match degree DC is given by
)
(
)
(
d
x
c
U
C
xd
d
x
c
U
c
xd
c
D
∑
∈
∑
∈
=
The above equation means that the match degree Dc
equals the summation of the membership of feature xd in
class c divided by the membership of feature xd in all C
classes. The fuzzy entropy of the elements of classc is then equal to
FEC = - DC log DC (10)
In order to compute the entropy H(X), we have to compute the fuzzy entropy along the universal set.
∑
==
C c cFE
FE
1As the entropies are computed, the information content of any variable can be easily known. Since a variable with large entropy does not pose a good amount of information about the classes, variables with small amount of entropy have to be selected (i.e. with large information content). After computing the FE values normalization is applied in the range[0, 1].
A threshold r is set to remove certain feature for which the entropy between those features and the class labels does not cross the threshold. The goal will be to keep the features in the lower values of entropies and higher contribution to output classes.
We proposed the algorithm based on fuzzy entropy based feature selection and discussed in the following section 3.3. C. Analysis Of Proposed Algorithm:
The following is the proposed Fuzzy Entropy based Feature Selection with Fuzzy Mutual Information algorithm(FEFS_FMI)which gives significant result thanFCBF algorithm.
Input : S(f1, f2, . . . .fN, c) - A training data set.
: fi, i = 1 to n, list of features. : δ A predefined threshold
: Hx- Fuzzy entropy between two variables : Hxx- Fuzzy entropy of each two features together : Icx- Fuzzy mutual information between each feature or variable stored as column
and the corresponding label.
: Icxx- Fuzzy mutual information between two variables and the class label.
: Ixx- Fuzzy mutual information between two variables.
Output:Sbest An optimal subset.
1. begin
2. for i = 1 to N do begin 3. calculateFEi,c for fi;
4. if (FEi,c>= δ)
5. append fi to S’list.
6. end;
7. orderS’listin descending FEi,c value;
8. fp = get the first element (S’list);
9. do begin
10. fq = get next element (S’list, fp);
11. if(fq<> NULL)
12. do begin 13. fq’ = fq;
14. if |Hxfp – Hxfq| <δ
15. if| Hxfp – Ixfpxfq| <= δ&& |Hxfq – Ixfpxfq |
<= δ
16. ifICXfp>ICXfq ;
17. removefqfromS’list;
18. fq= get Next element (S’list, fq’ )
19. elsefq = get Next element (S’list, fq);
20. end until(fq == NULL);
21. fp = get Next element (S’list, fp);
22. end until (fp == NULL);
23. Sbest = S’list;
24. end;
a) FEFS_FMI Algorithm:
Given a data set with N features and a class C, the algorithm finds a set of predominant features Sbestfor the
class concept. It consists of two parts. In the first part, it calculates fuzzy entropy value of each feature, selects relevant features into S’list list based on the predefined
thresholdδ. Then the fuzzy entropy values in S’list are
arranged in descending order.
In the second part, it further processes the ordered list S’listto remove the redundant features and only keeps
predominant ones among all the selected relevant features. The iteration starts from the first element in S’list (the feature
with largest FEi,c value is always predominant and can be a
starting point to remove other features). For all the remaining features (from the one right next to fp to the last
one in S’list), if fp happens to be redundant peer to a feature
fq, then fq will be removed from S’list.After one round of
filtering features based on fp, the algorithm will take the
currently remaining feature right next to fp as the new
reference to repeat the filtering process.
Let δ be the threshold chosen. If the difference between the fuzzy entropy values of fp and fq is less thanδ,it means
that the fp and fq may be redundant in nature. Hence, it further checks whether both fp and fq are redundant with the help of Fuzzy entropy of each individual variable and its joint entropy. In the step 15, both Hxfqand Hxfp compared
with its joint entropy of Ixfpxfq and assure that all the values
are in the same range. In step 16, if both are redundant, the variable that has lessFuzzy mutual information between the variable and the class (ICXfq) is removed. Thus we get Sbest
=S’list
IV. EXPERIMENTAL ANALYSIS
A. Experimental Datasets:
In this section the performance of our FEFS_FMI algorithm is compared with the existing FCBFalgorithm using four different data sets (WILT, ORL, LC, and CTG).WILT data set contains some training and test data from a remote sensing study by Johnson et.al.2013 that involved detecting diseased trees in quick bird imagery. There are few training samples for the ‘diseased trees’
class(74) and many for ‘other land cover class (4265). ORL data set includes the database of faces contains set of face images taken between April 1992 and April 1994 at the lab. The database was used in the context of a face recognition project carried out in collaboration with the speech vision and robotics group of the Cambridge university engineering department. LC data set contains multivariate data set about lung cancer with number of instances 32 and number of integer attributes 56. CTG (Cardiotocography) is a monitoring of fetal heart rate and uterine contractions database consists in total of 552 intrapartum recordings with 21 attributes, which were acquired between April 2010 and August 2012 at the obstetrics ward of the University Hospital in Brno, Czech Republic.
B. Result And Analysis:
Sensitivity also called the true positive rate, measures the proportion of positives which are correctly identified as such
Specificity (also called the true negative rate) measures the proportion of negatives which are correctly identified as such
Accuracy is the proportion of true results (both true positives and true negatives) among the total number of cases examined.
negatives
true
negatives
false
potives
fales
postivies
true
of
number
negatives
ture
of
no
and
positives
true
of
number
Accuracy
+
+
+
=
[image:4.595.75.508.708.784.2]The results of all the four data sets with respect to Specificity, Sensitivity, Accuracy and Features selected are given below in table 1..
Table 1 – Performance Analysis of FEFS_FMI
WILT
Threshold 0.25 0.5 0.65 0.75
Sensitivity 0.88235 0.68984 0.68984 0.68984 Specificity 0.75321 0.34936 0.34936 0.34936 Accuracy 0.8016 0.47695 0.47695 0.47695
Selected Features 4 2 2 2
ORL
Sensitivity 1 1 1 0.8
Accuracy 1 1 1 0.97959 Selected Features 162 104 104 72
LC
Sensitivity 0.14286 0.85714 0.85714 0.85714 Specificity 0.88889 0.88889 0.88889 0.88889 Accuracy 0.5625 0.875 0.875 0.875
Selected Features 12 4 2 2
CTG
Sensitivity 0.86613 0.84032 0.84032 0.84032 Specificity 0.94091 0.92273 0.91364 0.91364 Accuracy 0.8774 0.85274 0.85137 0.85137
Selected Features 6 3 1 1
The Figure 1 shows the featureselection analysis for the data setswith the threshold 0.65. Figure 2 illustratethe sensitivity of each data sets,and it shows that the sensitivity is high when the threshold value is 0.65.
Figure 1 –Feature Selection Analysis Figure2 – Sensitivity Analysis
The Figure 3 and Figure 4 shows specificityand accuracy of each data setand it gives good specificity with the threshold value 0.65.
Figure3 – Specificity Analysis Figure4 – Accuracy Analysis
[image:5.595.92.506.53.156.2]The Table2 gives comparative results of our proposed FEFS_FMI and FCBF algorithm.
Table 2 – FEFS_FMI Vs FCBF
WILT
FEFS_FMI FCBF Sensitivity 0.88235 0.8048 Specificity 0.75321 0.69355 Accuracy 0.8016 0.745045
Features 40 60
Sensitivity 1 0.9126
0 10 20 30 40 50 60 70
wilt orl lc CTG
Feature selection
ratio
Datasets
Ratio of Feature Selection with FMI 0.65
0 0.2 0.4 0.6 0.8 1 1.2
0.25 0.35 0.45 0.55 0.65 0.75
Specifici ty
Threshold
ORL
Specificity 1 0.9184 Accuracy 1 0.915491 Features 64.19753 75.92593 LC
Sensitivity 0.85714 0.7815 Specificity 0.88889 0.80738 Accuracy 0.875 0.794229 Features 3.571429 41.6667 CTG
Sensitivity 0.84032 0.7652 Specificity 0.91364 0.82247 Accuracy 0.85137 0.792802 Features 4.761905 33.3333
[image:6.595.138.458.50.256.2]Figure 5 shows the sensitivity of our FEFS_FMI algorithm which is improved by 7.8928% when compared to FCBF algorithm. Figure 6 illustrates the specificity of our FEFS_FMI algorithm is improved by 7.8485% when compared to FCBF algorithm.
[image:6.595.137.460.53.255.2]
Figure 5 Sensitivity Analysis (FCBF Vs FEFS_FMI) Figure 6 Specificity Analysis (FCBF Vs FEFS_FMI)
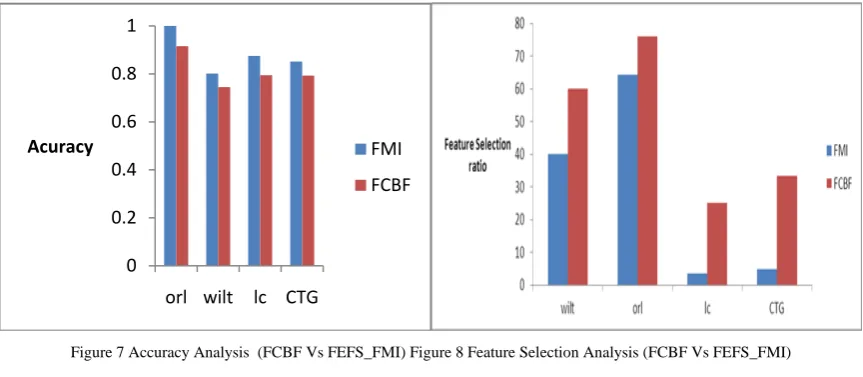
Figure 7 depicts the accuracy of our FEFS_FMI algorithm which is improved by 7.0101% when compared to FCBF algorithm. Figure 8 illustrates the feature selection ratio of our FEFS_FMI algorithm, which is reduced by 24.5% when compared to FCBF algorithm.
Figure 7 Accuracy Analysis (FCBF Vs FEFS_FMI) Figure 8 Feature Selection Analysis (FCBF Vs FEFS_FMI)
V. CONCLUSION
In this paper we have presented a fuzzy entropy based feature subset selection algorithm for high dimensional
data.Fuzzy entropy based feature selection algorithm isdevelopedto achieve maximum relevance and minimum degree of redundancy. Our FEFS_FMI algorithm performances are analyzed using four different data sets
0 0.1 0.2 0.3 0.4 0.5 0.6 0.7 0.8 0.9 1
orl wilt lc CTG
Sensitivity
ratio FMI
FCBF
0 0.2 0.4 0.6 0.8 1
orl wilt lc CTG
[image:6.595.73.524.300.493.2] [image:6.595.82.514.546.734.2]WILT, ORL, LC and CTG with four different threshold values. We analyzed the performance metrics such as sensitivity, specificity, accuarcy and dimension metrics feature selection for all the data sets. Our FEFS_FMI algorithm gives good results with the threshold value 0.65. Finaaly we compared the performances of FEFS_FMI andFCBF algorithm and proved that our proposed algorithm outperforms than FCBF algorithm. ThusFEFS_FMI algorithm not only select relevant features but also improves the performance by discarding redundant, noise corrupted or unimportant features.
VI. REFERENCES
[1]. Blum, A., & Langley, P. (1997). Selection of relevant features and examples in machine learning. Artificial Intelligence, 97, 245–271.
[2]. Das, S. (2001). Filters, wrappers and a boosting-based hybrid for feature selection. Proceedings of the Eighteenth International Conference on Machine Learning(pp. 74–81). [3]. Langley, P. (1994). Selection of relevant features in
machine learning. Proceedings of the AAAI Fall Symposium on Relevance. AAAI Press.
[4]. Kira, K., & Rendell, L. (1992). The feature selection problem: Traditional methods and a new algorithm. Proceedings of the Tenth National Conference on Artificial Intelligence (pp. 129–134). Menlo Park: AAAI Press/The MIT Press.
[5]. Kohavi, R., & John, G. (1997).Wrappers for feature subset selection. Artificial Intelligence, 97, 273–324.
[6]. Dash, M., Liu, H., &Motoda, H. (2000). Consistency based feature selection. Proceedings of the Fourth Pacific Asia Conference on Knowledge Discoveryand Data Mining (pp. 98–109).Springer-Verlag.
[7]. Hall, M. (1999). Correlation based feature selection for machine learning. Doctoral dissertation, University of Waikato, Dept. of Computer Science.
[8]. Wa'el M. Mahmud, HamdyN.Agiza, and ElsayedRadwan (October 2009) ,Intrusion Detection Using Rough Sets based Parallel Genetic Algorithm Hybrid Model, Proceedings of the World Congress on Engineering and Computer Science 2009 Vol II WCECS 2009, San Francisco, USA.
[9]. Thangavel, K., &Pethalakshmi, A. Elseviewer (2009)., Dimensionality reduction based on rough set theory 9, 1-12. doi: 10.1016/j.asoc.2008.05.006.
[10]. Kun-Ming Yu, Ming-FengWu,andWai-Tak Wong (April,2008), Protocol-Based Classification for Intrusion Detection, Applied Computer & Applied Computational Science (ACACOS '08), Hangzhou, China
[11]. Chuzhou University, China, Guangshun Yao, Chuanjian Yang,1Lisheng Ma, QianRen (June 2011) An New Algorithm of Modifying Hu’s Discernibility Matrix and its Attribute Reduction, International Journal of Advancements in Computing Technology Volume 3, Number 5.
[12]. T. Subbulakshmi , A. Ramamoorthi, and Dr. S. Mercy Shalinie(August 2009), Ensemble design for intrusion detection systems, International Journal of Computer
science & Information Technology (IJCSIT), Vol 1, No 1. [13]. Y.Y.Yao and Y. Zhao (2009), Discernibility matrix
simplification for constructing attribute reducts, Information Sciences, Vol. 179, No. 5, 867-882.
[14]. fJen-Da Shie · Shyi-Ming Chen (Feb 2007),Feature subset selection based on fuzzy entropy measures for handling classification problems, ApplIntell (2008) 28: 69– 82,DOI 10.1007/s10489-007-0042-6.
[15]. Hamid Parvin, BehrouzMinaeiBidgoli,hosseinghaffarin , An Innovative Feature Selection Using Fuzzy Entropy, Advances in Neural Networks – ISNN 2011.
[16]. ChinnaGopi.S, Reddy V.S.N,”An efficient method to solve optimization problem in featureselection “International journal of advanced research in computer science and software engineering,Vol 2 issue 4 April 2012.
[17]. AlagusundariB,Antonyselvadoss,”Feature selection based on fuzzy entropy” International journal of Emerging trends & Technology in computer science.Vol 2 issue 2 april 2013.
[18]. RomiSatriaWahono, NannaSuryana Herman, “Genetic Feature Selection for Software Defect Prediction”, Advanced Science Letters, Vol. 20, 239–244, 2014. [19]. Mitra, P., Murthy, C. A., & Pal, S. K. (2002). Unsupervised
feature selection using feature similarity. IEEE Transactions on Pattern Analysis and Machine Intelligence, 24, 301–312.
[20]. Press, W. H., Flannery, B. P., Teukolsky, S. A., &Vetterling, W. T. (1988). Numerical recipes in Cambridge University Press, Cambridge.
[21]. Quinlan, J. (1993). C4.5: Programs for machine learning. Morgan Kaufmann.
[22]. Lei Yu Huan Liu,” Feature Selection for High-Dimensional Data:A Fast Correlation-Based Filter Solution”, Proceedings of the Twentieth International Conference on Machine Learning (ICML-2003), Washington DC, 2003.
[23]. C.E.Shannon,” A mathematical theory of communication,” Bell syst. Tech.J, Vol 27, pp 379 - 423,1948.
[24]. S.V. Vaseghi, Advanced digital signal processing and noise reduction. England: John Wiley & Sons, INC., 2006. [25]. H. M. Lee, C. M. Chen, J. M. Chen, and a. Y. L. Jou, "An
efficient fuzzy classifier with feature selection based on fuzzy entropy," IEEE Transactions on Systems, Man, and Cybernetics-PART B: Cybernetics, vol. 31, pp. 426-432, 2001.
[26]. R. P. Nikhil and J. C. Bezdek, "Measuring fuzzyuncertainty," IEEE Transactions on Fuzzy Systems, vol. 2, 1994.
[27]. Rami N.Khushaba, Adel Al-Jumaily and Ahmed Al-Ani, ”Novel Feature Extraction Method On Fuzzy Entropy and Wavelet Packet Transform for Myoelectric Control”, 2007 InternationalSymposium on communications and information Technologies.