10.15662/ijareeie.2014.0311003
Copyright to IJAREEIE www.ijareeie.com 12811
Surge Detection System Using Gaussian Curve
Membership Function
Mohamed A. Waly1, Ibrahim F. Tarrad1, Mohamed M. Fouad2
Department of Electrical Engineering, Faculty of Engineering, Al-Azhar University, Egypt.1
Department of Electronics & Comm. Engineering, Faculty of Engineering, Zagazig University, Egypt.2
ABSTRACT:Problem: Surge is an instability that affects the entire compression system. Surge is characterized by a
limit cycle oscillation that results in large amplitude fluctuations of the pressure and flow rate. In contrast to rotating stall, during surge the average mass flow is unsteady but circumferentially uniform. Approach: The attempt to find a simple model structure which can capture in some appropriate sense the key of the dynamical properties of the physical plant, we study the application possibilities of the anti-surge detection system by using Gaussian curve membership function to protect the centrifugal compressor from surge by using Neural fuzzy. Results: By testing the new Neural-Fuzzy system which has been created for demonstrate the validity of proposed control scheme, the new neural-fuzzy system get a good results compared by the used detection system. Conclusion: We can use Neural-Fuzzy system to detect the surge in centrifugal compressor Alternative to current detection system.
KEYWORDS: Compressor, ASC, Gaussian, neural, fuzzy, ANFIS
I.INTRODUCTION
COMPRESSORS are used as part of a gas turbine for jet and marine propulsion or power generation, in superchargers and turbochargers for internal combustion engines, and in a wide variety of industrial processes .In this thesis we focus on centrifugal compressors that are used in (petro) chemical process plants and in fluid transportation pipelines. Centrifugal compressors have the same operating principle as axial compressors so whenever appropriate we will refer to the more general class of turbo compressors that covers all continuous flow compressors. [1]
A Compressor transfers kinetic energy from an aero-mechanically-driven rotor to a steady flow of gas. The pressure of the gas is raised by converting the acceleration imparted by the rotating parts of the compressor via diffusion. In normal operation of a compressor, the flow is nominally steady and axisymmetric. The pressure rise is dependent on the speed of rotation, but the efficient range is limited. This instability can take on one of two forms, either surge or rotating stall depending upon the compressor speed. The performance of a compressor is plotted as pressure ratio versus mass flow for different rotational speeds. The plot is divided into two regions by the stall (or surge) line. This line defines the operation limits of the compressor. To the left of the stall line the flow is no longer steady. [2]
During normal and slowly changing operations, surge can be avoided by recycling gas through the surge control valve to maintain a minimum flow. However, when a trip or major upset occurs, flow rate drops and the primary means by which surge energy can be reduced to lower the head (suction to discharge pressure difference) at which the compressor reaches the surge (minimum stable) flow condition. The head across a compressor during a trip or upset is dependent on the response of the entire system including changing performance of the compressor, transient flows within the piping, control system responses, and capacity and opening rate of surge and other automatic valves, such as vent or blow down valves, and check valves [3].
10.15662/ijareeie.2014.0311003
Copyright to IJAREEIE www.ijareeie.com 12812
II.ANTI-SURGE DETECTION
A. Anti-Surge Basics
The transfer of gas along a pipeline is a common process in the oil, chemical and petro-chemical industries. For cost effectiveness, gas is usually transported at high pressure via a compressor before entering the pipeline. The compressor efficiency is maximized when the flow rate through it is kept low and the pressure high, with the minimum possible flow rate being restricted by the risk of compressor entering surge condition [2].
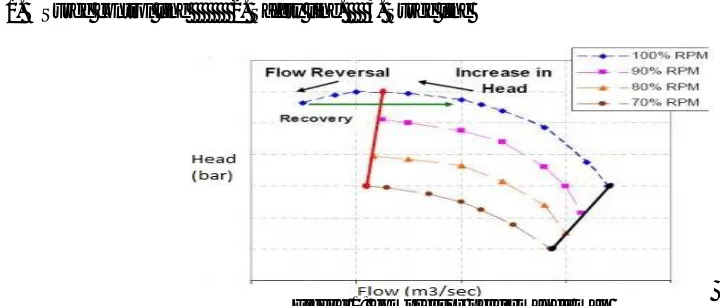
The surge phenomena is an unstable and undesirable operating condition of the compressor, occurring when the flow through it is reduced to the point where the compressor discharge pressure is less than the line pressure. This causes a momentary flow reversal, reducing line pressure and causing erratic flow output. With the reduced line pressure, flow through the compressor is re-established, causing line pressure to increase and the cycle to begin again. If the factors leading to the surge condition are not correctly and quickly rectified, the output will continue to oscillate resulting in damage to the compressor. The Anti-surge system offers:
Protection against compressor damage such as bent shafts, cracked or ruptured castings, damaged impeller and bearings
Reduction in compressor downtime and productivity costs.
Savings on maintenance costs.
The compressor must not run under these conditions (surge condition). Possible damage caused by surging includes: 1. Rapid flow and pressure oscillations cause process instabilities.
2. Noise.
3. Vibration of machine.
4. Reduces lifetime of the machine or in extreme case surge can cause an accident for a compressor. 5. Rising temperatures inside the compressor.
6. Tripping of the compressor. 7. Mechanical damage:
• Bearing failure.
• Stationary and rotating part contact if thrust bearing is overloaded. • Increased seal clearances and leakage
• Rubbing of impellers • Destruction of blading
• Damage to intake filter, process fittings, etc.
A description of the surge control line for the compressor, is typically provided in the form of a performance map. The surge limit model should be based on experimental testing, either in the factory test or from site verification. The surge detected from compressor performance map as Figure 1 which contain the 2 or 3 lines, these lines identify the line of [4]:
1. Surge control line 2. Safety line. 3. Surge line
10.15662/ijareeie.2014.0311003
Copyright to IJAREEIE www.ijareeie.com 12813 To determine the status of the operating compressor if it’s in surge region or safe region, the operation point on the performance map must be in right side of the surge line. The control line is normally located 10 % to the right of the surge line [5].The value of operation point of the compressor id depends on Volume flow (V̇) and Enthalpy difference (∆h) which are the axes of the compressor map. The calculation of Volume flow as the following equation:
̇ = ∆ .
. (1)
Where ∆p is the effective pressure (differential pressure over the compressor mouth on the suction side), T1 is the intake temperature and p1 the intake pressure. K is a calibration factor derived from the geometry of the compressor. The enthalpy difference ∆h is calculated as:
Δℎ= ∗ ∗ ∗ −1 (2)
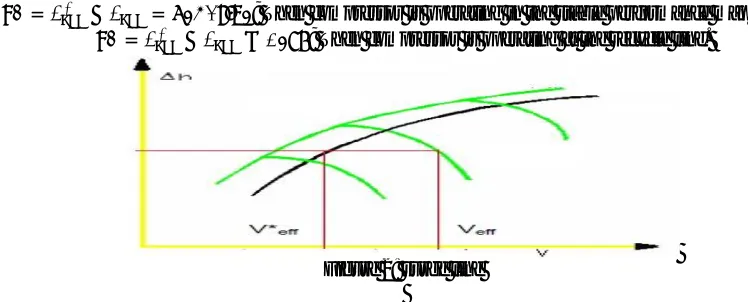
Where R is the gas constant and k the isentropic exponent. The gas constant and isentropic exponent are dependent on the gas composition. With unchanged gas composition these parameters are constant.Control-deviation (Xd): The set point value itself is calculated via a graph = (∆ℎ). This graph (anti-surge control line) is fixed during commissioning of the compressor set. The control-deviation xd is formed from the difference of the set point value V*eff minus the actual value as the following equation and graph [6].
= ∗ − = ; Then compressor is operating in the stable performance map range.
= ∗ − ≥
; Then compressor is operating at the recycle line.
Figure 2: surge line
B. Anti-Surge detection structure
Compressor Anti-Surge protection is required on all continuous-flow (centrifugal and axial) compressors. These units are used in natural gas pipeline, LNG refrigerant, and chemical / petrochemical processes. Sizes range from small electric motor driven units to those driven by large gas turbines.Anti-Surge protection is provided by a control valve that opens allowing gas from the compressor outlet to re-circulate to the inlet. Compressor surge happens when the downstream flow demand changes and doesn’t match the current compressor operating point. The flow control system will change the driver (turbine or motor) speed if possible to adjust to the new flow rate, but the speed of the large rotating mass (driver + compressor) often can't be changed quickly enough to match the change in operating point. When the compressor speed and corresponding design flow rate don't match the actual system demand, flow reversal can occur in the compressor. Without outside intervention the flow reversal cycle will continue placing seals and other internal parts under great stress. Complete compressor failure is possible.[1]
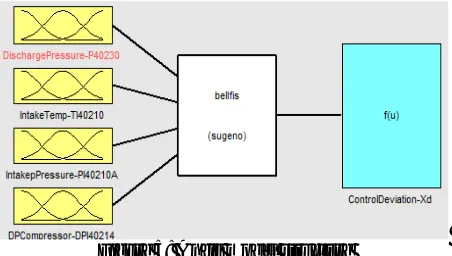
Figure 3:anti-surge detection structure
10.15662/ijareeie.2014.0311003
Copyright to IJAREEIE www.ijareeie.com 12814 • Discharge pressure • Intake temp. • Intake pressure • DP compressor
This paper will use an existing system to collect the data to the fuzzy system, the collected data is divided into 2 groups, 1st one is the training data which contains 123 points (approximately 50% of them in right side of surge control line and 50% of them in left side of surge control line) and the 2nd group is testing data which contains 10 points (5 points in right side of surge control line and 5 points in left side of surge control line).
III.III. ANTI-SURGE DETECTION USING FUZZY
The Fuzzy Logic tool was introduced in 1965, by LotfiZadeh, and it’s a mathematical tool for dealing with uncertainty. The fuzzy theory provides a mechanism for representing linguistic constructs such as “low” “medium” “high” In general, the fuzzy logic provides an inference structure that enables appropriate human reasoning capabilities [7].
A. Fuzzy logic – basic principles
Fuzzy logic is the logic that refers to the study of methods and principles of human experience. Fuzzy sets form the building blocks for fuzzy IF–THEN rules which have the general form “IF X is A THEN Y is B,” where A and B are fuzzy sets. The term “fuzzy systems” refers mostly to systems that are governed by fuzzy IF–THEN rules [7].A membership function (MF) is a curve that defines how each point in the input space is mapped to a membership value (or degree of membership) between min and max. The type of membership and the number of memberships will affect the results so it will be better to increase the number of memberships to be 5 memberships for each input as the following:
LowLow – Low-Medium-High-HighHigh.These numbers of membership will make 625 rules for the system and they are generated by using the neural fuzzy networks also the type of the membership is important so by using trial and error method ,the better result get with guassmf membership type.
B. Fuzzy Modeling
A finite fuzzy logic implication statement can always be described by a set of general fuzzy IF-THEN rules containing only the fuzzy logic AND operation, in the following multi-input single-output form [8]:
(1) “IF (x1 is X11) AND ... AND (xn is X1n) THEN (y is Y1).” (2) “IF (x1 is X21) AND ... AND (xn is X2n) THEN (y is Y2).”
…….
(N) “IF (x1 is XN1) AND ... AND (x n is XNn) THEN (y is Y N).”
Using Takagi and Sugeno fuzzy rule-based model that can approximate a large number of nonlinear systems, in this research the rules (625 rule) will be as the following example:
IF (Discharge Pressure is LowLow) AND (Intake Temp is LowLow) AND (IntakePressure is Low Low) AND (DP Compressor is LowLow) THEN (Control Deviation-Xd is out1mf1). (3)
IF (Discharge Pressure is Low Low) AND (Intake Temp is Low Low) AND (IntakePressure is Low Low) AND (DP Compressor is Low) THEN (Control Deviation-Xd is out1mf2). (4)
IF (DischargePressure is LowLow) AND (IntakeTemp is LowLow) AND (IntakePressure is LowLow) AND (DPCompressor is Medium) THEN (ControlDeviation-Xd is out1mf3). (5)
& so on…
C. Adaptive neuro fuzzy inference system
10.15662/ijareeie.2014.0311003
Copyright to IJAREEIE www.ijareeie.com 12815 The ANFIS is used to implement the proposed model .It uses the collected training data to train the fuzzy detection system which have 4 inputs with one output. Using a given input/output data set, [10] the toolbox function ANFIS constructs a fuzzy inference system (FIS) whose membership function parameters are tuned (adjusted) using either a back propagation algorithm alone or in combination with a least squares type of method . [11]
There are two methods that anfis learning employs for updating membership function parameters:
Back propagation for all parameters (a steepest descent method)
A hybrid method consisting of back propagation for the parameters associated with the input membership functions, and least squares estimation for the parameters associated with the output membership functions. [12]
The following figure shows the network structure of the ANFIS that map the inputs by the membership functions, their associated parameters go through the output membership functions.
Figure 4:The ANFIS Structure
In the hybrid method of learning it uses a combination of Steepest Descent and Least Squares Estimation (LSE).There are many modes used in combination like: Batch Learning, Pattern By Pattern, & Different ways to combinations. [13]
Training of Fuzzy system is done with the inputs data (Discharge pressure -Intake temp.-Intake-pressure-DP compressor) and one output (Control-deviation) using hybrid method for learning as Figure 5.
Figure 5: Anfis model structure
The following Table for membership details of inputs:
Name Range Parameters
Discharge pressure
45.555553-57.800926 LowLow 1.3094781900773-45.5723034677731
Low 1.2101252044920-48.6117350754273
Medium 1.09691032397156-51.654317254992
10.15662/ijareeie.2014.0311003
Copyright to IJAREEIE www.ijareeie.com 12816 HighHigh 1.4213921743682-57.6506040963318
Intake-temp. 18.482349-24.771412 LowLow 0.4453032343347-9 18.3353396587
Low 0.2367182341515-19.6259496605478
Medium 0.670311838731436 21.547037270517
High 0.7279210872836-23.1903298232309
HighHigh 0.5632578504550-24.8287004781742
Intake-pressure 35.659721-46.16898 LowLow 1.1479996565733-35.743601844014
Low 0.5272600325919-38.3056775072671
Medium 0.6364697203484-40.8260600105418
High 1.2531601321571-43.3878532350795
HighHigh 1.1072135727830-46.1726179504655
DP-compressor 107.928238-247.25116
LowLow 14.794082522352-107.930424370983
Low 14.779447006099-142.761299499454
Medium 14.870530707795- 177.654184230054
High 14.780398255528-212.428724407544
LowLow 14.749722604540-247.282974787508
Table 1: Membership details
IV. RESULTS
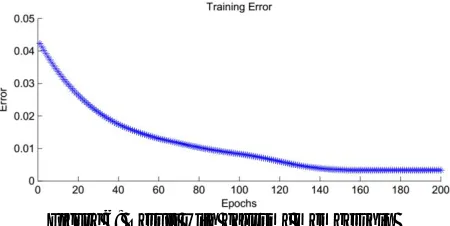
The results of the two groups of data are presented in this section. After several trials with many types of neuro-fuzzy model we found that the gaussmf with 200 epochs and 5 memberships get a good results. As the next graph of error shows that the error is 0.0033571.
Figure 6: Result with gaussmf membership
10.15662/ijareeie.2014.0311003
Copyright to IJAREEIE www.ijareeie.com 12817 Figure 7: FIS output by using training data
The next figure shows the output of the fuzzy system using the testing data and the error is 0.43932.
Figure 8: FIS output by using testing data
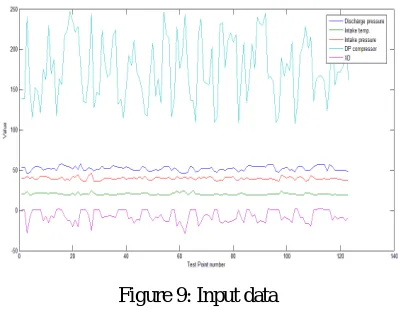
The next figure shows the data which is used in simulating the fuzzy detection system:
Figure 9: Input data
The next figure shows the output data from simulating fuzzy system (red line) and existing system (black line).
10.15662/ijareeie.2014.0311003
Copyright to IJAREEIE www.ijareeie.com 12818 According to all above results. The max error in the FIS is < 0.5 .the control line is normally located 10 % to the right of the surge line [5].Multiply the surge flow by 1.1 to get the control line flow. According to the result which the error does not exceed ± 0.5% and to the compressor manufacturer which confirm the gap between surge line and control line is10% and the gap between control line and safety line is 10%, therefore ± 0.5% is a minor error and accepted, that is because in worst case the FIS will take the action to open the Anti-surge valve after the control line 0.5 and that mean the valve will be controlled before surge line by 9.5%.
V. CONCLUSION
The great benefit of this fuzzy logic approach is that the detection system does not require the knowledge of the compressor map in order to find a desired equilibrium point. As well the same model can operate under active and passive surge control without the knowledge of which method is being implemented. The decision making is based solely on the compression system output, allowing the fuzzy model to be easily adapted to any turbo compressor system.
VI. CONCLUSION
Thus it allows each node with message to decide whether to copy the message to a path node by optimizing its transmission effort in order to provide a sufficient level of message delay. Using a channel selection scheme provides spectrum utilization while it minimizes the interference level to primary system. Using trustworthy algorithm, itimproves the trustworthiness of the Spectrum sensing in CR-Networks. It enables network nodes to adaptively regulate their communication strategies according to dynamically changing network environment.
VII. FUTURE WORK
The practical implementation requires more studies as some of the normalization methods used in the ANFIS. My opinion is that more editing in membership parameters will make better results and less error.
ACKNOWLEDGMENT
The authors wish to thank Doctors, Gasco Company, Fajr Company & my wife.
REFERENCES
[1] J. van Helvoirt, Centrifugal Compressor Surge, Modeling and Identification for Control. Netherland: Technische Universiteit Eindhoven, 2007. [2] A. Hafaifa & F. Laaouad & k. Laroussi, A New Engineering Method for Fuzzy Reliability Analysis of Surge Detection and Isolation in
Centrifugal Compressor. Algeria: Faculty of Hydrocarbons, University of BOUMERDES, 2009.
[3] F.LAAOUAD, Nonlinear model for a turbo compressor using fuzzy logic approach. Algeria: BOUMERDES University, 2007.
[4] Gas Machinery Research Council, application guideline for centrifugal compressor surge control systems. USA: Southwest Research Institute, 2008.
[5] Blotenberg, Anti-Surge Control. Germany: MDT, 2006.
[6] Hergenhahn, Operating Instructions for Compressor skid. Germany: MAN Turbo AG, 2005.
[7] S. Sumathi and S. N. Deepa S. N. Sivanandam, Introduction to Fuzzy Logic using MATLAB. India: Springer, 2007.
[8] Guanrong Chen and Trung Tat Pham, Introduction to Fuzzy Sets, Fuzzy Logic, and Fuzzy Control Systems. USA: CRC, 2000.
[9] MathWorks, Fuzzy Logic Toolbox. USA: Matlab, 2012.
[10] Jyh-Shing Roger Jang, Neuro-fuzzy and soft computing. USA: Prentice Hall, 1997.
[11] Jie Zhang Salim Hamed Thunaiyan Al-Mawali, "A Fuzzy approach to Active Surge Control of Centrifugal Compressors," University of Newcastle upon Tyne, Newcastle upon Tyne, NE1 7RU, UK, p. 4, 2008.
[12] Michael Joseph Krok John Bolton, Stall and surge detection system and method.