Design and Implementation of Maximum Power Tracking System
According to the Sun Direction (Model Sun Flower)
Talib Sabah Hussein ; Dr. M.Chandrasekhar Reddy ; Dr. J. Upendar
1Automation and Robotics Engineering University College of Engineering Osmania University
Hyderabad 50007
2Professor University College of Engineering Osmania University Hyderabad 50007
3Assistant professor University College of Engineering Osmania University
Hyderabad- 500007
Abstract
Solar energy systems have stood out as a viable source of renewable energy over the past two or three decades, and are now openly used for a variety of industrial and
domestic and medical applications.
Improvement in the performance of a solar tracking system during summer was found to be as much as 30% for higher elevation angle and 60% for lower elevation angle. Based on the developed tracking algorithms, further it was shown that the amount of solar energy captured by a tilted collector could be increased by more than 35% by adjusting the tilt angle on a daily or monthly basis. This project is designed with AT89S52 MCU. Depending upon the light falls on LDR 3mm and 20k ohm the data will be read by the Micro-controller and the direction of the motor will be changed, with this direction the Solar panel which are fixed to the stand will also rotates to obtain the maximum sun rays. This project uses regulated 12V and 500mA power supply. 7805 three terminal voltage regulator is used for voltage regulation; Bridge type full wave rectifier is used to rectify the Ac output of secondary of 230/12V step down transformer.
Keyword:- Sunflower, Microcontroller, photovoltaic energy system, Keil Software, PV panel
Rheostat
Introduction
failure has been discussed [2] to compare the PV array voltage (or current) with a constant
reference voltage (or current), which
corresponds to the PV voltage (or current) at the maximum power point, under specific atmospheric conditions[3] maximum power operating point (MPOP) of photovoltaic (PV) power generation systems changes with changing atmospheric conditions (e.g. solar radiation and temperature), an important consideration in the design of efficient PV
system[4] Detailed theoretical and
experimental analyses are presented for the comparison of two simple, fast and reliable maximum power-point tracking (MPPT) techniques for photovoltaic (PV) system[5] The electric power supplied by a photovoltaic
power generation system depends on the solar radiation and temperature. Designing efficient PV systems heavily emphasizes to track the
maximum power operating point [6]Since PV
modules still have relatively low conversion efficiency, the overall system cost can be
reduced using high efficiency power
conditioners which, in addition, are designed to extract the maximum possible power from the PV module [maximum power point tracking (MPPT)] A very common MPPT technique [7] The proposed PV system is composed of conventional novel single axis tracking system. And PV system, The PV panel voltage is taken as input parameter to maximize the output power [8]
Figure 1: single axis tracking angle solar panel method
Problem Statement
A tracking angle solar panel system, designed in such a way to keep the panel tracking the sun from -90º to +45º in order to
utilize maximum solar power. It is
automatically track the solar power using Micro-controller as shown in figure 1. Hence the auto – solar tracking system is required to harness the solar energy and improve efficiency.
Test conducted
1. Indoor test: mobile phone flash light used to highlight on light sensor dependent LDR, to tracking the light.
2. Outdoor test: using solar/sun power falls on solar panel tracking and fixed, measured voltage and current for each hour from 7:00AM to 17:00PM, then analyzed all values in
Microcontroller 8051
Microcontroller is a programmable device. A microcontroller has a CPU in addition to a fixed amount of RAM, ROM, I/O ports and a timer embedded all on a single
chip. The fixed amount of on-chip ROM,
RAM and number of I/O ports in
microcontrollers makes them ideal for many applications in which cost and space are critical. As shown in the figure 2
Keil Software:
Keil compiler is software used where the machine language code is written and compiled. After compilation, the machine source code is converted into hex code which
is to be dumped into the microcontroller for further processing. Keil compiler also supports C language code. As shown in the figure 3
Figure 3: shown steps of the Keil u Vision4 program 1- Click on the Keil u Vision4 Icon on
Desktop
2-Then Click on New Project
3- For a program written in Assembly, then save it with extension “asm” and for “C” based program save it with extension “ C”
Experimental of single axis tracking angle solar panel method
is (- 90º to 45º) Facing due east. As shown in the figure1. Using during the second week of March 2017, and after a few minor
corrections, it was performed from April 2017 to May 2017. As shown in table 1and figure 4
Table 1: List of time of multi angle experimental conducted (on 22 April 2017) and the corresponding PV panel angle at (-90.
Time (hrs) 22/4/2017 Angles Time (hrs) Angles
6:00am -90 12:00pm -13.356
7:00am -86.856 13:00pm 4.374
8:00am -78.236 14:00pm 20.272
9:00am -65.358 15:00pm 33.12
10:00am -49.44 16:00pm 41.7
11:00am -31.7 17:00pm 45
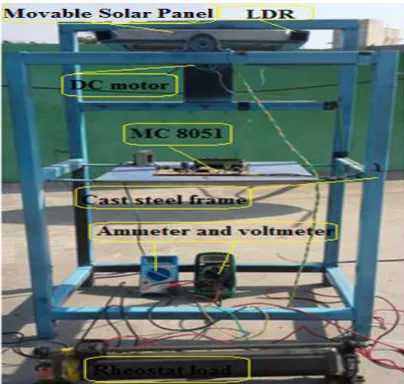
Figure 4: Experimental set-up of multi angles from ( - 90) method of single axis tracking solar panel method.
Block diagram of experimental
When increases the loads the output power, voltage and current will be change continuously with the atmosphere condition to obtained maximum power point and current.
The solar panel is below the 0º axis, that’s why it is -90º. The position is measured clockwise direction hence keep negative sign.
When panel starts tracking from -90º to 0º, gave negative value of angles. As shown in the figure 6
Figure 6: single axis tracking solar panel at ( -86.85 tracking angle with respect to the ground
Results and discussion
P-V and I-V curve of single axis tracking
angle solar panel method at morning
.
Experimental PV panel characteristics at 7:00AMPV panel and Rheostat load are
connected as shows in figure 6 the current
and voltage readings by Voltmeter and
Ammeter, are taken the same connection is
used to get the readings from morning to
evening, at ( - 86.85 tracking angle with
Figure 7 : I-V, P-V Panel Characteristics at 7:00AM
The Rheostat load changes from maximum to minimum value, and voltage and current at 7:00AM observed as shown in figure 7 the Maximum power at 7:00AM is (0.9042 watt) and corresponding voltage and current values are voltage is ( 8.22 V) and current is (0.11A), this readings observed at ( -86.85 tracking angles with respect to the ground. Experimental PV panel characteristics at 10:00AM
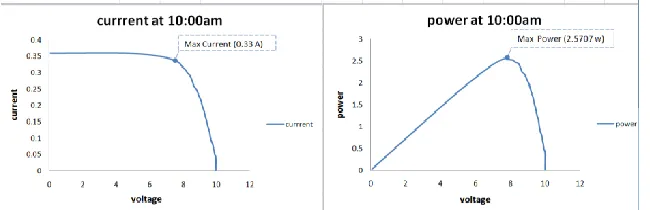
The Rheostat load changes from maximum to minimum value, and voltage and current at 10:00AM observed as shown in figure 8 the Maximum power at 10:00AM is (2.5707 watt) and corresponding voltage and current values are voltage is ( 7.79V) and current is (0.33A) this readings are observed, at ( - 49.44 tracking angle with respect to the ground.
Figure 8: I-V, P-V Panel Characteristics at 10:00AM
Figure 9: single axis tracking solar panel at (450 tracking angle with respect to the ground
PV panel and Rheostat load are connected
as shows in figure 9 the current and voltage
readings by Voltmeter and Ammeter, are
taken the same connection is used to get the
readings from morning to evening, at ( 45
tracking angle with respect to the ground. The Rheostat load changes from maximum to minimum value, and voltage and current at 17:00 PM observed as shown in figure 10 the Maximum power at 17:00 PM is (0.75205 watt) and corresponding voltage and current
values are voltage is ( 8.45 V) and current is (0.089A) this readings observed at ( 45 tracking angle with respect to the ground
Output power during single axis tracking angle solar panel method
As explained above Maximum Power variation at different timing from each graph from (7:00AM to 17:00PM) is observed and tabulated in table 2 at multi angles from ( -90 to 45 tracking angles. As shown in table 2
Table 2: The experimental Max power variation at different timing from morning to evening
Time(Hrs), 22/4/2017 Maximum power (w)
7:00 Hrs 0.9042
8:00 Hrs 1.722
9:00 Hrs 2.4864
10:00 Hrs 2.5707 Max Power point
11:00 Hrs 2.4096
12:00 Hrs 2.4928
13:00 Hrs 2.07
14:00 Hrs 1.9228
15:00 Hrs 2.0208
16:00 Hrs 1.411
Maximum power varaiton curve during single axis tracking angle solar
panel method.
The maximum power generated (2.5707W)
at 10:00AM, readings are observe
improvement in the morning is higher than in the afternoon, which is due to the drop in efficiency of the panel as they get heated up during afternoon. as shown in figure 11
Figure 11: Maximum power variation at different timing from morning to evening using single
axis tracking.
Energy generated during single axis tracking angle solar panel
The maximum Energy genetrated is
(18.1872Wh) at 15:00PM the readings are
shown the Energy obsorpting increases in the
morning till evening at (15:00PM) and starting decrease after that. as shown in
figure 12
Figure 12: Energy generated level.
Figure 13: Comparison of I-V curve during single axis tracking angle solar panel from 7:00
AM to 17:00 PM
Figure 13: shows all graph values, the Current of all the above cases from 7:00AM to 17:00PM, using single axis tracking angle solar panel method, from this graph is
observed that the current is maximum at 10:00 AM, 12:00 PM, 9:00 AM, and 11:00 AM respectively
Comparison of P- V curve during single axis tracking solar panel method.
Figure 14: Comparison of P- V curve during single axis tracking angle solar panel from 7:00 AM
to 17:00 PM.
Figure 14 shown all graph values, the Power of all the above cases from 7:00AM to 17:00PM, using single axis tracking angle solar panel method, from this graph is observed that The power is maximum at 10:00 AM, 12:00 PM, 9:00 AM, and 11:00 AM respectively
CONCLUSION:
•
The proposed method is the single axis tracking solar panel. Can track the sunlight automatically. The light
sensitivity resistors (LDR) are used to determine the night day vision. Thus,
the efficiency of solar energy
The experimental result also shows that the higher maximum power point (W) and Energy (Wh) using the single axis tracking angle solar panel at 10:00AM and 15:00PM. As shown in figures (11,12) respectively.
The experimental result also shows that the maximum current (I) and maximum power (W) from 7:00AM to17:00PM. Using single axis tracking angle solar panel method at 10:00, 12:00, 9:00AM and 11:00PM . As shown in figures (13,14) respectively.
ACKNOLEDGEMENTS:
I would like to express my deepest gratitude to my advisor, Dr.M.C.S Reddy, Professor in Mechanical Engineering
Department, University College of
Engineering, Osmania University for his excellent guidance, caring, patience, and providing me with an excellent atmosphere for doing research.
I would like to thank our Head of the Department Dr. P. Usha Sri, professor in
Mechanical Engineering Department,
University College of Engineering,
Osmania University, for his ultimate cooperation during whole my Course.
REFERENCE
:
[1] Koutroulis, E., Kalaitzakis, K., & Voulgaris, N. C. (2001). Development of
a microcontroller-based, photovoltaic
maximum power point tracking control system. IEEE transactions on power electronics, 16(1), 46-54.
[2] Hussein, K. H., Muta, I., Hoshino, T., &
Osakada, M. (1995). Maximum
photovoltaic power tracking: an algorithm
for rapidly changing atmospheric
conditions. IEE Proceedings-Generation, Transmission and Distribution, 142(1), 59-64.
[3] Hua, C., & Shen, C. (1998, May). Study of maximum power tracking techniques and control of DC/DC converters for photovoltaic power system. In Power Electronics Specialists Conference, 1998. PESC 98 Record. 29th Annual IEEE (Vol. 1, pp. 86-93). IEEE.
[4] Hua, C., Lin, J., & Shen, C. (1998). Implementation of a DSP-controlled photovoltaic system with peak power tracking. IEEE Transactions on Industrial Electronics, 45(1), 99-107.
[5] Masoum, M. A., Dehbonei, H., & Fuchs, E. F. (2002). Theoretical and experimental analyses of photovoltaic systems with
voltageand current-based maximum
power-point tracking. IEEE Transactions on Energy Conversion, 17(4), 514-522. [6] Jiang, J. A., Huang, T. L., Hsiao, Y. T., &
Chen, C. H. (2005). Maximum power tracking for photovoltaic power systems.
淡江理工學刊, 8(2), 147-153.
[7] Salas, V., Olias, E., Barrado, A., & Lazaro, A. (2006). Review of the
maximum power point tracking
algorithms for stand-alone photovoltaic systems. Solar energy materials and solar cells, 90(11), 1555-1578.