Scholarship@Western
Scholarship@Western
Electronic Thesis and Dissertation Repository
11-26-2010 12:00 AM
Mental Blocks: The behavioural effects and neural encoding of
Mental Blocks: The behavioural effects and neural encoding of
obstacles when reaching and grasping
obstacles when reaching and grasping
Craig S. Chapman
University of Western Ontario
Supervisor
Dr. Melvyn A Goodale
The University of Western Ontario Graduate Program in Psychology
A thesis submitted in partial fulfillment of the requirements for the degree in Doctor of Philosophy
© Craig S. Chapman 2010
Follow this and additional works at: https://ir.lib.uwo.ca/etd
Part of the Cognition and Perception Commons, Cognitive Neuroscience Commons, Motor Control Commons, and the Psychology of Movement Commons
Recommended Citation Recommended Citation
Chapman, Craig S., "Mental Blocks: The behavioural effects and neural encoding of obstacles when reaching and grasping" (2010). Electronic Thesis and Dissertation Repository. 39.
https://ir.lib.uwo.ca/etd/39
This Dissertation/Thesis is brought to you for free and open access by Scholarship@Western. It has been accepted for inclusion in Electronic Thesis and Dissertation Repository by an authorized administrator of
(Spine title: Behavioural Effects and Neural Encoding of Obstacles)
(Thesis format: Integrated-Article)
by
Craig S. Chapman
Graduate Program in Psychology
A thesis submitted in partial fulfilment of the requirements for the degree of
Doctor of Philosophy
The School of Graduate and Postdoctoral Studies The University of Western Ontario
London, Ontario, Canada
ii
THE UNIVERSITY OF WESTERN ONTARIO School of Graduate and Postdoctoral Studies
CERTIFICATE OF EXAMINATION
Supervisor
______________________________ Dr. Melvyn Goodale
Supervisory Committee
______________________________ Dr. Jody Culham
Examiners
______________________________ Dr. Daniel Ansari
______________________________ Dr. Paul Gribble
______________________________ Dr. Chris Viger
______________________________ Dr. Paul Cisek
The thesis by
Craig S. Chapman
entitled:
Mental Blocks: The behavioural effects and neural encoding of obstacles when reaching and grasping
is accepted in partial fulfilment of the requirements for the degree of
Doctor of Philosophy
iii
Abstract
The ability to adeptly interact with a cluttered and dynamic world requires that the brain
simultaneously encode multiple objects. Theoretical frameworks of selective visuomotor
attention provide evidence for parallel encoding (Baldauf & Deubel, 2010; Cisek &
Kalaska, 2010; Duncan, 2006) where concurrent object processing results in neural
competition. Since the end goal of object representation is usually action, these
frameworks argue that the competitive activity is best characterized as the development
of visuomotor biases. While some behavioural and neural evidence has been
accumulated in favour of this explanation, one of the most striking, yet deceptively
common, demonstrations of this capacity is often overlooked; the movement of the arm
away from an obstacle while reaching for a target object is definitive proof that both
objects are encoded and affect behaviour. In the current thesis, I discuss three
experiments exploring obstacle avoidance.
While some previous studies have shown how visuomotor biases develop prior to
movement onset, the dynamics of the bias during movement remains largely unexplored.
In the first experiment I use the availability and predictability of vision during movement
as a means of exploring whether obstacle representations might change during a reach
(Chapter 2, Chapman & Goodale, 2010b). While the visuomotor system seems
optimized to use vision, I found no difference between reaching with and without vision,
providing no evidence that obstacle representations were altered. To more directly test
this question, in the second experiment participants made reaches to a target that
sometimes changed position during the reach (Chapter 3, Chapman & Goodale, 2010a).
The automatic online corrections to the new target location were sometimes interfered
with by an obstacle. Using this more direct approach we found definitive evidence that
obstacle representations were accessed or updated during movement.
In the third experiment, I directly tested the neural encoding of obstacles using functional
magnetic resonance imaging (Chapter 4, Chapman, Gallivan, Culham, & Goodale, 2010).
iv
versus when the grasp was not interfered with, one area in the left posterior intraparietal
sulcus was activated. This activity was concurrent with a suppression of early visual areas
that were responsive to the position of the obstacle. This study confirmed that the PPC
was involved with the encoding of obstacles, and demonstrated that one effect of
interference was the suppression of the visual cortical signal associated with the obstacle.
These findings extend our understanding of competitive visuomotor biases. Critically, in
a world filled with potential action targets, the selection of one target necessarily means
all other objects in the workspace are potential obstacles. My results indicate that the
visuomotor biasing signal to inhibit obstacle activity is putatively provided by the PPC,
which in turn causes the visual cortical representation of the obstacle to be suppressed.
The behavioural result of biasing the visual input is the propogation of this suppression to
the motor output - ultimately resulting in a reach which intelligently deviates away from
potential obstacles.
Keywords: obstacle avoidance, reaching, grasping, selective visuomotor attention,
inhibition, competitive bias, visual feedback, online correction, fMRI, posterior parietal
v
Co-Authorship
All of the research contained within this doctoral thesis dissertation was conducted in
collaboration with my advisor, Dr. Melvyn A. Goodale. Dr. Goodale supervised and
contributed to all aspects of the projects contained within this thesis dissertation (e.g.
experimental design, data analysis, interpretation, writing of manuscripts). I also
collaborated with Dr. Jody Culham and Jason Gallivan on the project described in
Chapter 4. Both assisted with experimental design, data collection, data analysis,
interpretation, and gave useful feedback on all drafts of the project. Dustin Kishen
assisted with data collection for the experiment described in Chapter 2 and Ravi Doobay
assisted with data collection for the experiment described in Chapter 3. At the time of
examination, Chapter 2 and Chapter 3 are published with Chapter 4 submitted. The
written material in this thesis is my own work, but, as my advisor, Dr. Goodale provided
vi
Acknowledgements
I would first like to acknowledge my departmental and senate examination committee
members: Dr. Chris Viger, Dr. Paul Cisek, Dr. Daniel Ansari, Dr. Paul Gribble and Dr.
Jody Culham. A special thank you to Dr. Cisek whose work was extremely influential to
this thesis and whose attendance from Montreal was much appreciated. I especially want
to acknowledge the incredibly important role Paul Gribble and Jody Culham had in
shaping my academic career – they have been examiners, advisors, instructors, mentors,
colleagues and friends and they have had a profound impact on how I conduct research.
I would like to thank all the members of the GAP / CAPnet labs – the undergraduate
students, the RAs and support staff, the grad students, the post-docs, and the PIs. Being
surrounded by intelligent and friendly people is what makes doing grad school such a
great experience.
I would like to extend a particular thanks to Dr. Haitao Yang, Adam McLean, Lynne
Mitchell, Paula Perdue and Lucy van Eimeren the technical and administrative wizards in
our group. Without them, our science, and this thesis would not be possible.
There are a few specific colleagues I‘d like to single out as being critical to my success.
First to Dr. Jon Cant and Ken Valyear – thanks for the stimulating discussions and
collaborations. Second to my Full Scale team members (and office mates), Daniel Wood
and Jen Milne – our work together has been the most exciting of my career and I look
forward to future projects. Finally, to the other half of the Chapmallivan empire, and the
other founding father of team Full Scale, Jason Gallivan – working with you has been an
absolute pleasure. Every meeting, project and manuscript is exctiting and rewarding and
I know our work together is just beginning.
Of course, I would like to acknowledge and thank my advisor, Dr. Melvyn Goodale.
Mel‘s skills as a scientist are matched as a mentor. He has taught me to be a critical and
vii
I would also like to acknowledge many of the other people in my life that aren‘t directly
related to my work. To the many friends I‘ve made playing squash, tennis, poker, soccer,
hockey and board games – thanks for making my time in London so enjoyable. To my
parents Ian and Judy – words cannot describe what your love and support mean to me.
My success is your success. Most importantly, to my wife Erin – your support,
encouragement and love together with your help organizing my life and prioritizing my
time (suggestions to stop making figures were appreciated) were essential to this thesis.
But more than that, Erin, I thank you for making all the other parts of my life outside of
work so enjoyable – I work so that I can do all those other things with you.
Oh yes – and to my dog Hugo for making me leave my desk at least once a day during
the long days of thesis writing.
Finally, I end with a quote of personal inspiration, from John F. Kennedy‘s speech made
on September 12, 1962 at Rice University. He speaks of why we pursue lofty scientific
goals, in this case the exploration of space, and taking man to the moon. I believe the
sentiments extend to all of our scientific endevours:
―There is no strife, no prejudice, no national conflict in outer space as yet. Its hazards are hostile to us all. Its conquest deserves the best of all mankind, and its opportunity for peaceful cooperation many never come again. But why, some say, the moon? Why choose this as our goal? And they may well ask why climb the highest mountain? Why, 35 years ago, fly the Atlantic? Why does Rice play Texas?
We choose to go to the moon. We choose to go to the moon in this decade and do the other things, not because they are easy, but because they are hard, because that goal will serve to organize and measure the best of our energies and skills,
because that challenge is one that we are willing to accept, one we are unwilling to postpone, and one which we intend to win, and the others, too.‖
viii
Table of Contents
CERTIFICATE OF EXAMINATION ... ii
Abstract ... iii
Co-Authorship... v
Acknowledgements ... vi
Table of Contents ... viii
List of Tables ... xv
List of Figures ... xvi
List of Appendices ... xxi
List of Abbreviations ... xxii
Chapter 1 ... 1
1. General Introduction ... 1
1.1. Preamble ... 1
1.1.1. Why Study Action? ... 1
1.1.2. Why Study Obstacles? ... 2
1.2. Theoretical frameworks of visuomotor selection ... 4
1.2.1. Biased competition hypothesis ... 6
ix
1.2.3. Attentional landscapes hypothesis ... 14
1.2.4. Conclusions from frameworks ... 18
1.3. Neural correlates of distractor suppression ... 20
1.3.1. Suppression in an action task ... 20
1.3.2. Suppression in visual cortex and parietal top-down control ... 22
1.3.3. Conclusions from distractor suppression ... 27
1.4. Distractor interference in reaching tasks... 27
1.4.1. Reaching in the presence of distractors – Tipper and colleagues ... 28
1.4.2. Reaching and grasping in the presence of distractors – other work ... 32
1.4.3. Conclusions from distractor interference ... 35
1.5. Obstacle encoding in non-human animals ... 36
1.5.1. Obstacle avoidance in monkeys ... 36
1.5.2. Obstacle avoidance in cats ... 37
1.5.3. Conclusions from animal obstacle avoidance ... 38
1.6. Obstacle avoidance in neuropsychological patients ... 39
1.6.1. Two visual streams hypothesis ... 39
1.6.2. Impaired obstacle avoidance in patients with dorsal stream damage ... 44
1.6.3. Spared obstacle avoidance in patients with ventral stream damage ... 46
x
1.7. Obstacle avoidance in healthy individuals ... 49
1.7.1. Obstacle avoidance in reach-to-grasp movements ... 49
1.7.2. Obstacle avoidance in reach-to-point movements ... 53
1.7.3. Conclusions from obstacle avoidance in healthy individuals ... 55
1.8. Summary and Motivation of current thesis ... 55
1.9. References ... 59
Chapter 2 ... 68
2. Seeing All the Obstacles in Your Way: The effect of visual feedback and visual feedback schedule on obstacle avoidance while reaching ... 68
2.1. Introduction ... 68
2.2. Materials and Methods ... 74
2.2.1. Participants ... 74
2.2.2. Materials and design ... 74
2.2.3. Procedure ... 77
2.2.4. Data processing ... 77
2.2.5. Dependent measures and analysis ... 79
2.3. Results ... 80
2.3.1. Effects due to Obstacles ... 82
xi
2.4. Discussion ... 93
2.5. References ... 99
Chapter 3 ... 102
3. Obstacle avoidance during online corrections ... 102
3.1. Introduction ... 102
3.2. Methods... 106
3.2.1. Participants ... 106
3.2.2. Materials and Design ... 107
3.2.3. Procedure ... 109
3.2.4. Data Processing ... 109
3.3. Results ... 111
3.3.1. Spatial trajectories ... 111
3.3.1.1. Reaches to initial target position ... 112
3.3.1.2. Reaches to jumped target positions ... 115
3.3.2. Temporal profiles ... 118
3.3.2.1. Effects due to jump direction ... 120
3.3.2.2. Effects due to object position ... 120
3.3.3. Supplemental Error Analysis ... 123
xii
3.5. Conclusion ... 136
3.6. References ... 137
Chapter 4 ... 141
4. Mental Blocks: fMRI reveals top-down modulation of early visual cortex when obstacles interfere with grasp planning... 141
4.1. Introduction ... 141
4.2. Materials and Methods ... 143
4.2.1. Participants ... 143
4.2.2. Setup and Apparatus ... 144
4.2.3. Procedure ... 146
4.2.4. Acquisition and preprocessing of fMRI data ... 149
4.2.5. Data Analysis ... 150
4.2.5.1. Analysis motivation ... 150
4.2.5.2. Analysis overview ... 151
4.2.5.3. Isolating a Plan network ... 152
4.2.5.4. Obstacle effects in the Preview and Plan phases ... 153
4.3. Results ... 154
4.3.1. Plan > Preview network and mask ... 154
xiii
4.3.3. Preview Phase ... 157
4.3.3.1. Right Visual Cortex ... 157
4.3.4. Plan Phase ... 159
4.3.4.1. Right Visual Cortex ... 159
4.3.4.2. Left Posterior IPS ... 162
4.3.4.3. Other Activated Areas... 165
4.4. Discussion ... 167
4.4.1. Summary ... 167
4.4.2. The role of Right-Visual Cortex and the Left-pIPS ... 168
4.4.3. The role of MFG and Left-Visual cortex ... 171
4.4.4. A Unified Perspective of Posterior Parietal Activity ... 173
4.5. Supplemental Results and Discussion ... 176
4.5.1. Note on motion artifacts... 176
4.5.2. Preview network ... 177
4.5.3. Other roles of the IPS – can they all be unified? ... 179
4.6. References ... 181
Chapter 5 ... 186
5. General Discussion ... 186
xiv
5.2. What does the PPC do? ... 188
5.3. How does inhibition work? ... 195
5.3.1. Houghton-Tipper (H&T) model of inhibition... 195
5.3.2. Houghton & Tipper model of reaching (H&T-reach) ... 199
5.3.3. Welsh & Elliot‘s Response Activation Model (RAM) ... 202
5.4. Obstacle Inhibition Model ... 203
5.4.1. Stages of obstacle inhibition ... 205
5.4.2. Temporal evolution of obstacle inhibition ... 217
5.5. Future directions ... 226
5.5.1. Attention scales with interference ... 226
5.5.2. Timeline of inhibition ... 228
5.5.3. fMRI of reaching (vs. grasping)... 229
5.6. Conclusions and Implications ... 230
5.7. References ... 234
Appendix A ... 238
Appendix B ... 241
xv
List of Tables
Table 2.1. Dependent measures showing an effect due to obstacle configuration... 83
Table 2.2. Dependent measures showing an interaction between feedback and schedule ... 85
Table 2.3. Dependent measures showing an effect due to feedback only... 91
Table 3.1. The means and statistical results for the temporal dependant measures... 119
Table 3.2. Tally of rejected trials………... 127
xvi
List of Figures
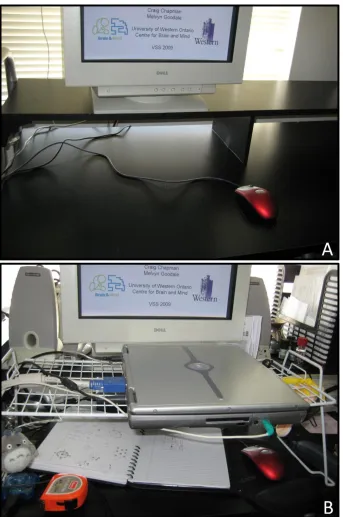
Figure 1.1. Comparative photographs of my desk. (A) An environment where the target object (red computer mouse) is presented in isolation, representative of how visuomotor experiments are usually conducted. (B) A more realistic
cluttered environment, where objects other than the target compete for selection and can function as obstacles………. 3
Figure 1.2. Examples of competitive parallel encoding of objects from the three attentional frameworks discussed in section 1.2. (A) Biased competition hypothesis (from Desimone, 1998)… (B) Affordance competition hypothesis (from Cisek & Kalaska, 2010)… (C) Attentional landscape hypothesis (from Baldauf, Cui, & Andersen, 2008)………. 8
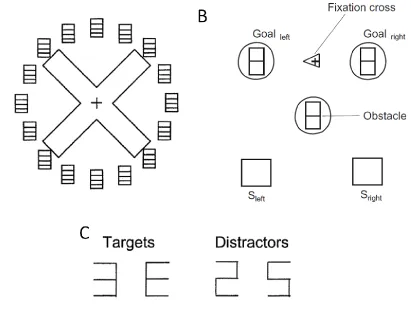
Figure 1.3. Stimuli arrangement for two studies using the dual-task perceptual
identification / reaching paradigm (A) From Shiegg et al. (2003)…(B) From Duebel and Schneider (2004)…(C) Example of targets and distractors used for the perceptual identification……….. 16
Figure 1.4. Compound letter stimuli used by Mevorach and colleagues (from Mevorach et al., 2010)……….. 25
Figure 1.5. Overhead view of reach trajectories showing the effects of distractor
interference in the Tipper reach-to-grasp task (Figure from Tipper, Howard, & Houghton, 1998; Results from Tipper et al., 1997)……… 30
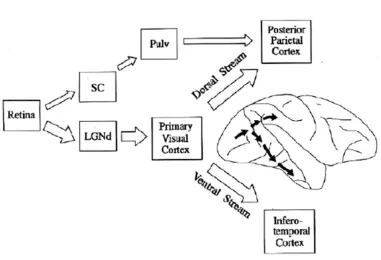
Figure 1.6. A Schematic diagram of the two visual streams (from Milner & Goodale, 1995)……… 41
Figure 1.7. Comparison of neuroanatomy of patients with VFA vs. OA. (A) From (James, Culham, Humphrey, Milner, & Goodale, 2003): A 3D
reconstruction of the brain of VFA patient D.F….(B) From (Rossetti et al., 2005): MRI scans of OA patient I.G……….. 43
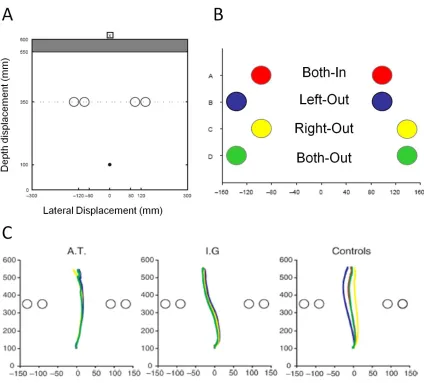
Figure 1.8. Experimental setup and results from obstacle avoidance experiment in OA patients and control participants (Schindler et al., 2004). (A) Overhead view of experimental apparatus… (B) Possible obstacle configurations…(C) Overhead views of reach trajectories under each obstacle configuration... 45
xvii
Figure 1.10. Experimental setup from obstacle avoidance while reaching task (from C. S. Chapman & Goodale, 2008). (A) In Experiment 1…(B) In Experiment 2 ……….… 52
Figure 1.11. Results from Chapman & Goodale (2008) (A) Results from Experiment 1…(B) Results from Experiment 2………. 54
Figure 2.1. Experimental setup and obstacle configurations. Participants made reaches from the start button to the target-LED which were on a 1m x 1m black fabric board. When obstacles (4 cm square base, 25 cm tall) were present they appeared in one of eight configurations (shown on left) at a depth of 25 cm. Movements were recorded using two OPTOTRAK cameras (one right, one in front) at 100 hz………. 76
Figure 2.2. Overhead view (x,y) of average reach trajectories made for trials with no vision (NV, left panel) and trials with vision (V, right panel) under all eight obstacle configurations……… 81
Figure 2.3. The effect of visual feedback (Vision (V) = blue, No Vision (NV) = Red) and schedule (separate sets of bars, blocked, random and alternating) on time to peak velocity (bottom/dark portion of bar) and deceleration time (light/top portion of bar)……….. 88
Figure 2.4. Scatter plots of all reach endpoints made with vision (V = Blue) and with no vision (NV = Red) separated into reaches made under the three feedback schedules (blocked, random and alternating). Overlaid are standard deviation ellipses with a width = twice StdX@End and height = twice StdY@End... 89
Figure 2.5. The proportion of endpoint variance (R2) in the depth (y) dimension
accounted for by the location of the limb (in the depth (y) dimension) at 25, 50 and 75% of the movement as a function of visual feedback (NV = no vision, dashed lines; V = with vision, solid lines) and schedule (blocked = light grey, random = dark grey, alternating = black)……….. 92
Figure 3.1. Experimental setup with target and object positions. Participants made reaches from the start button to the Initial Target (green circle) which were on a 1m x 1m black fabric board. On 1/3 of trials, the target jumped in depth and to the Left (blue circle) or Right (red circle). When an object was present they appeared in one of four positions (indicated by colored squares, size and position to scale). Movements were recorded using two
xviii
Figure 3.2. Overhead view (x,y) of average (average of 18 participants‘ individual average) reach trajectories to the initial target (small red circle) with objects in each position (position and size not to scale)……… 114
Figure 3.3. Overhead view (x,y) of average reach trajectories to the jumped target positions with objects on the Left (A) or Right (B)………..…… 116
Figure 3.4. Average vector velocity (top) and lateral velocity (bottom) traces for trials with (A) No objects and (B) Objects………. 122
Figure 3.5. Collision trajectories (thin black traces) from Jump-right, obstacle Near-Right trials overlaid on average trajectory traces taken from Figure 3.3b ………125
Figure 3.6. Analysis of endpoints of trials removed for having an incorrect endpoint ………128
Figure 3.7. Trajectories of trials removed for having significant re-accelerations during online corrections. Left panel – Jump-left trials with objects on the left. Right panel – Jump-right trials with objects on the right……….. 130
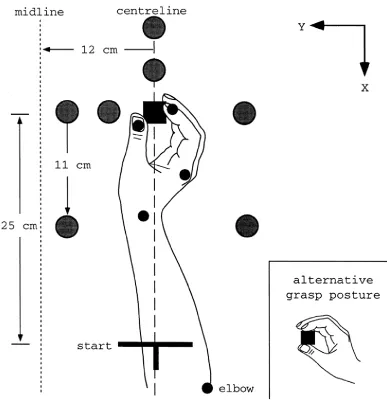
Figure 4.1: (A) Schematic (not to scale) top-down view of platform (see Figure 4.2)…(B) Target object and obstacle object are shown schematically to provide dimensions………... 145
Figure 4.2: Experimental setup, timing, conditions and contrasts. (A) Participant setup from side view…(B) Timing of one event related planning trial….(C) The experimental conditions shown from participant‘s point of view in the 2 (Wrist Posture) x 3 (Obstacle Position) design….(D) A deconvolution design was used to analyze the data with a spike predictor at each volume (20x2s volumes for each trial)………... 148
Figure 4.3: Regions active during grasp-planning. A group voxelwise analysis identified areas that were more active (p<0.001, minimum cluster size 324mm3) during the ―Plan‖ phase (average of volumes 7-12) than the ―Preview‖ phase (average of volumes 1-6). The resulting statistical map is presented on an average anatomical MRI of all 15 participants in
xix
Figure 4.4: Right Visual area showing significant Obstacle-Position x Time interaction (p<0.001, minimum cluster 108mm3) during the Preview phase….The % BOLD signal change throughout the trial is shown to the right……..… 158
Figure 4.5: (A) Right Visual area showing significant Obstacle-Position effect (p<0.001, minimum cluster 108mm3) during the Plan phase. (B) Right Visual area showing significant Interference effect (p<0.001, minimum cluster 108mm3) during the Plan phase…The green outline on anatomical images corresponds to the Right Visual area indentified during the Preview phase (see Figure 4.4). The % BOLD signal change throughout the trial is shown to the right of each area. Above each time course is a bar-plot
depicting the significant effect……….. 161
Figure 4.6: Left Posterior IPS area showing significant Interference x Time interaction (p<0.001, minimum cluster 108mm3) during the Plan phase…Above the time course is a line-plot depicting how the difference between Interfere and No-Interfere trials (purple lines) develops across the Plan phase (Solid line = Th-Side, Broken line = Th-Front). Above the line-plot is a plot of the grand mean slope (thick black line) of the linear fit to the difference plot (collapsed across Wrist-Posture). Each subjects‘ mean slope is shown with the thin grey lines……….. 164
Figure 4.7: Regions active during object preview. A group voxelwise analysis
identified areas that were more active (p<0.001, minimum cluster size 294 mm3) during the Preview phase (average of volumes 1-6) than the Baseline predictors (average of 19-20)……… 178
Figure 5.1. Schematic depiction of the H&T Model (Houghton & Tipper, 1994) of selection and inhibition. (A) Overall flow of information…(B) The modeled timeline of selection/inhibition in a verbal naming task…This model closely matches the actual neural activity for competing targets depicted in Figure 1.2……….. 197
Figure 5.2. Schematic depiction of the H&T-Reach Model (Houghton & Tipper, 1999; Figure from Tipper et al., 1998) of reaching in the presence of distractors. Reach direction is depicted as the peak of a distribution of activity across a population (direction indicated with black arrows). Left Panel: (A) a strong response to a near target and (B) a weak response to a far distractor results in (D) incomplete inhibition of the distractor and deviations toward its location. Right panel: (E) a weak response to a far target and (F) a strong response to a near distractor results in (H) reactive inhibition which
xx
Figure 5.3. Proposed initial activations following visual presentation in a typical
obstacle avoidance study. Where theoretical activity is shown, a 3D view of workspace is presented above a side-on view of the workspace. (A) Layout prior to visual onset…(B) At visual onset both the target and obstacle objects are represented with positive activation…(C) To be consistent with other figures in the section (Figures 5.4 and 5.5), the plane of the table is shown as the relative baseline………... 207
Figure 5.4. Proposed evolution of activity related to target selection and obstacle inhibition. 3D plots of the workspace and activity appear in the top row, overhead view in the second row and along the bottom a theoretical
timeline is shown….(A) Initially, both the target and obstacle are positively represented, and a reach would aim for a midpoint between them. (B) Due to the target matching the desired stimulus and obstacle not matching the desired stimulus there is a yoked enhancement of the target and inhibition of the non-target. Reaches executed during this phase would shift from slight deviations-toward to deviations-away from distractors. (C) Because the obstacle interferes with the desired reach, it receives additional active inhibition, resulting in strong deviations away from its location……….. 210
Figure 5.5. Possible sources of between-trial bias and the potential distribution of activity that may result. Overhead views shown below 3D plots. The plane of the table is the relative baseline. (A) Positive bias at the target location. (B) Negative bias at the obstacle locations, with an even larger bias on the right where participants reach with their right hand. (C) and (D) Positive biases at the hand start position and along the reach path respective. (E) A simple sum of the biases depicted in A-D, demonstrating what is an overwhelmingly complicated workspace bias even prior to task demands being incorporated………. 216
xxi
List of Appendices
APPENDIX A: Documentation of ethics approval………... 238
xxii
List of Abbreviations
1-L-In: one object in the left-in position
1-L-Out: one object in the left-out position
1-R-In: one object in the right-in position
1-R-Out: one object in the right-out position
2-B-In: two objects, both left and right objects in the in position
2D: two dimensional
2-L-In: two objects, one in the left-in position, one in the right-out position
2-R-In: two objects, one in the right-in position, one in the left-out position
3D: three dimensional
ANOVA: Analysis of variance
BOLD: blood oxygenation level dependent
cm: centimeters
EPI: echo planar imaging
ERP: event related potential
FEF: frontal eye fields
fMRI: functional magnetic resonance imaging
H&T: Houghton & Tipper model of inhibition
H&T-Reach: Houghton & Tipper model of inhibition for reaching
Hz: hertz
IPS: intraparietal sulcus
IRED: infrared marker
IT: inferior temporal cortex
xxiii LED: light emitting diode
LGN: lateral geniculate nucleus
LIP: lateral intraparietal area
m: meter
MANOVA: multivariate analysis of variance
MFG: medial frontal gyrus
mm: millimeters
ms: milliseconds
NV: no vision, or reaches where vision was not available during the reach
OA: optic ataxia
pIPS: posterior intraparietal sulcus
PPC: posterior parietal cortex
RAM: response activation model
RFX: random effects
RM: repeated measures
s: seconds
SOA: stimulus onset ansynchrony
TE: echo time
TMS: transcranial magnetic stimulation
TR: repetition time
V: vision, or reaches where vision is available during the reach
V1: primary visual cortex or striate cortex
V4: 4th area of visual cortex
Chapter 1
1. General Introduction
1.1. Preamble
1.1.1. Why Study Action?
In order to gain experimental traction, the careful scientist asks very specific questions.
Specific questions can be the most meaningful precisely because they are the most
answerable. But, by necessarily asking specific questions, we sometimes lose sight of the
big picture – the overarching principles that simply must be true. If our very specific
answers are to questions that have become too far removed from the real world, then we
may have gained traction, but it is on a road that goes nowhere. Two general truths that
mainstream psychology sometimes strays from are revealed in the two following quotes,
each by authors whose thinking has shaped my own. The first, in a recent review by Dr.
Paul Cisek and his collaborator Dr. John Kalaska reads, ―One of the most important facts we know about the brain is that it evolved‖ (2010, p. 275). The second by Dr. Alan Allport states, ―Indeed, I find it difficult to get any clear conception of what ‗perception‘ might be, as a subject of scientific study, isolated from its role in the control of action‖
(1987, p. 395). Taken together, these quotes remind us that the human brain didn‘t
evolve to solve math problems, write novels, ruminate on the beauty of the world or
conduct science, but rather it evolved to control our actions. The first simple organism
that could not just sense where there was a higher concentration of a nutrient, but could
propel itself toward it had a huge evolutionary advantage. Scaling the analogy up several
orders of magnitude, complex animals that make economical action choices expend less
energy accomplishing more rewarding goals. This filter of efficient action choices must
necessarily, I believe, inform how we think about people‘s performance in almost every
experimental psychology task. Certainly, as Dr. Allport argued, the idea of action
choices must be applied when studying how we visually perceive the world. Visual
perception is, after all, merely a part of the processing that necessarily concludes with (at
least) the intention to act. Our conscious experience of the world may be breathtaking,
complexity of the human brain, these actions can, of course, be abstract and complicated,
but a percept without an action is like that organism that senses the nutrient but cannot
move.
Studying action, therefore, is a window into one of the most primitive, and by extension
most important, aspects of the human condition – the ‗Why we are here?‘ (to shape our
environments to our greatest benefit) and ‗How do we do it?‘ (by performing maximally
efficient actions) questions. Of course these are big questions, and by virtue of what I
said earlier, not suitable for good science. An intelligent scientist, however, will remain
cognizant of these fundamental principles as he or she approaches the more narrowly
defined questions that are the tools of the trade.
1.1.2. Why Study Obstacles?
The current thesis explores the more specific questions of how obstacles to action affect
our behaviour and where obstacles are coded in the brain. I say more specific, because
even these questions are not completely amenable to careful scientific inquiry. Consider
even the notion of what an obstacle to an action is (even restricting the definition of
action to reaching movements, which is the topic of the current thesis). It is one of those
deceptively simple yet complicated concepts. Is an object an obstacle to a reach only if
the intended movement would result in a collision with the obstacle? This seems
unlikely, given that motor variability demands a margin of error be incorporated into
almost every movement. The regress of questions from this simple answer is obvious:
how much of a margin is necessary, does this margin change with context, and a myriad
of other questions. Given these problems, I provide a tentative answer to the question of
what an obstacle is that avoids some of the problems of definition, but inevitably creates
many more problems that must be solved. For the purposes of this thesis, an obstacle is
any object in our immediate environment that is not the current target of action. That
means that we encounter obstacles everywhere, all the time. It suggests that, given that
most of our actions will have only a single target among many other objects, objects that
are obstacles are more ubiquitous than objects that are targets. It also suggests that
studying actions performed toward single objects presented in isolation does not provide
Figure 1.1. Comparative photographs of my desk. (A) An environment where the target
object (red computer mouse) is presented in isolation, representative of how visuomotor
experiments are usually conducted. (B) A more realistic cluttered environment, where
Consider the photograph of my desk shown in Figure 1.1a. Imagine that I want to reach
out and grab the red computer mouse. It is presented in relative isolation (though the
edge of the desk and the computer monitor are obviously other objects in the environment
that could shape my behaviour). But my desk is never that clean (unless I clear it to take
a photograph). Instead, my desk usually appears as it does in Figure 1.1b. Admittedly,
my desk is messy, but the introduction of even the mouse pad, or just the lab book,
completely changes the type of reaching movement I can make toward the red mouse.
But when moving in our environments, we rarely consider the targets of our action (the
red mouse) let alone all the other objects that surround them and affect our movements.
This suggests two critical and related features of the visuomotor system. First, it
demands that multiple objects be processed automatically and in parallel. The simple fact
that a reach toward a target object is different than a reach toward a target object when a
second object is present is strong evidence of parallel processing. Second, by extension,
the fact that there is simultaneous encoding of multiple objects requires that the
visuomotor system select and specify targets from non-targets. Consider again my
cluttered desk in Figure 1.1b. The target red computer mouse actually shares many
features (similar size and shape, and similar colour) with the orange tape measure to the
left. Given that both objects obviously give rise to a visual response, but only the mouse
is the target of my action, the visuomotor system must selectively process the mouse
rather than the tape measure. Visuomotor selection, then, lies at the heart of
target-directed reaching, and by extension, determines the role and influence of non-selected
objects in the workspace (for which one label is obstacles). Therefore, I start my
Introduction with a review of three theoretical frameworks that speculate on how
visuomotor selection might be implemented and provide evidence for some of their most
important claims. That section ends with a summary of how the critical points from these
frameworks directly pertain to obstacles, and how this shaped the current thesis,
including the remainder of the Introduction.
1.2. Theoretical frameworks of visuomotor selection
Obstacles are an interesting category of objects in our environment. They must certainly
yet, unlike other objects in our environment which automatically capture attention and
compete for selection, they cannot act as attractors to movement. Moreover, it may not
be enough to simply ignore an obstacle, or treat it as if it were not there, since it must be
avoided. This implies some sort of active inhibition of obstacles. Active inhibition,
however, may not be as complicated as it sounds. If one imagines that all objects – and
potential motor plans for that matter – compete for selection (or execution in the case of
motor plans), then for one object to be actively inhibited it means only that the ‗strength‘
of its representation needs to be less than all other objects currently represented. That is,
selection and inhibition are relative. Consider the simple case of reaching toward one
object in the presence of a second non-target object. Both objects will initially be coded
with some positive activation (a virtue of being an identifiable visual object). Should
both objects act as potential targets even until movement execution, then this would result
in a reach trajectory at the midpoint between the two objects (as we have recently shown,
C. S. Chapman, Gallivan et al., 2010a). If prior to movement onset, however, one of the
targets is clearly selected as the target for action, then the neural activity associated with
its representation will be increased, leading to a hand path that is attracted (or moves
straight toward) the position of that object. Importantly, if one of the objects is identified
as a potential obstacle prior to movement onset, then the neural activity associated with
its representation will be suppressed, leading to the avoidance of its position. Notice that
the coding of the obstacle location could still be above baseline; i.e., its representation
need be reduced only relative to that of the other in order for that object to be avoided.
Underlying this explanation of avoidance is the premise that the representation of objects
(and motor plans) compete for selection (and specification). Here I outline three
theoretical frameworks which have recently been advanced that describe how and where
competitive representations might be implemented in the brain, and describe evidence for
this competition in a variety of domains. While only the last framework (attentional
landscapes hypothesis, section 1.2.3) specifically describes evidence from tasks involving
obstacles, all three raise issues important to understanding how obstacles and other
objects in our cluttered environments compete for neural resources and ultimately affect
1.2.1. Biased competition hypothesis
One of the most formal descriptions of competitive interactions in the brain comes from
John Duncan and Robert Desimone‘s account of selective attention as the result of ‗biased competition‘ (also referred to as integrated competition) between sensory
information (for reviews, see Desimone, 1998; Desimone & Duncan, 1995; Duncan,
1996, 1998, 2006). The majority of the examples they discuss come from the domain of
selective visual attention, which will also be the focus here. A recent review of the
theory integrating new neural evidence has also been written (Beck & Kastner, 2009).
The problem which motivated the development of this framework is best summarized by
Duncan:
―Vision is selective: at any given moment, only a small fraction of the total available visual input can be consciously identified or used in the control of behaviour. Subjectively, attention is paid to some things but withheld from others. How is selectivity implemented in the multiple brain systems activated by visual input?‖ (1996, p. 551)
This led Duncan to propose three tenets (which I have reordered to improve the
coherence of my argument) at the core of the biased competition hypothesis:
―1. Of the many brain systems responding to visual input, perceptual and motor, cortical and subcortical, many and perhaps most are competitive (Rizzolatti and Camarda 1987). Within each system, a gain in activation or representation for one object is bought at a loss to others; for example, representations of different objects may be mutually inhibitory.
3. Competition is controlled…by advance priming of units responding to one kind of object rather than another (see Harter and Aine 1984; Walley and Weiden 1973). Suppose, for example, that the animal searches for fruit of a particular colour. Units selectively responsive to that colour are preactivated in one or more brain systems in which colour is coded. Inputs with the desired colour gain a competitive advantage in the primed system; as such an input gains ascendancy in that system, it tends also to take control of others.
It is important to note that each of these three components is crucial to understanding
how obstacles are encoded in the brain: first, that the neural coding of obstacles competes
with the neural coding of other objects in the environment, and the inhibition of
obstacle-related activity could facilitate the selection of other objects or targets; second, that the
inhibition of obstacle codes could be generated from other (top-down) signals in the brain
and that this inhibition would be contingent on the obstacle‘s task relevance (in this case,
task relevance could directly correspond to the amount an obstacle interfered with a
desired movement); and third, that the inhibition of obstacle codes could propagate
Figure 1.2. Examples of competitive parallel encoding of objects from the three
attentional frameworks discussed in section 1.2. (A) Biased competition hypothesis (from
Desimone, 1998): Recordings from 88 cells in macaque IT cortex initially respond
equally to two complex objects (e.g. a flower). After 170 ms the ‗Good‘ stimuli response
is enhanced and the ‗Poor‘ stimuli response is reduced. This selection occurs prior to the
eye-movement response (short vertical bar on x-axis). (B) Affordance competition
hypothesis (from Cisek & Kalaska, 2010): Population encoding across 100 dorsal
premotor cells in macaque monkeys. Two possible reach targets (Spatial cues) are
encoded across a delay (Memory period) even in the absence of a visual target. When
one is selected (Colour cue) its corresponding activity is enhanced while the activity for
the non-selected target is reduced. Premotor cells are also heavily recruited during the
movement (after the Go cue). (C) Attentional landscape hypothesis (from Baldauf, Cui,
& Andersen, 2008): Recordings from 112 PPC cells in macaque monkeys. Targets
within the receptive field of the cell gave rise to a significant increase in activity
(maintained across a memory delay) whether they were the first (blue trace) or second
(red line) target in a rapid reach to two consecutive locations. Targets outside the
receptive field (black line) showed no enhancement (dashed grey lines show activity on
While a discussion of all of the evidence supporting the three major tenets is beyond the
scope of this thesis, a summary of some of the key findings and their implications to
obstacle representations is useful. First, in support of the notion of competition between
visual objects both neurophysiological recordings in monkeys (e.g. Chelazzi, Duncan,
Miller, & Desimone, 1998; Chelazzi, Miller, Duncan, & Desimone, 1993) and
neuroimaging in humans (e.g. Kastner, De Weerd, Desimone, & Ungerleider, 1998)
demonstrates that presenting two or more objects simultaneously (especially within the
receptive field of a cell) reduces the visual response (from primary visual cortex (V1)
through to inferior temporal (IT) cortex) when compared to activity generated by a single
object (though the response to multiple objects is still positive). This is taken as evidence
of the suppressive effects of competition. Moreover, after an initial rise to this level of
competitive activation (objects are mutually suppressed and equally weighted), when one
of the objects is selected, its neural activity continues to rise to a level comparable to the
response generated when it is presented in isolation. Importantly for this thesis, the
activity of the non-selected target is now significantly suppressed, evidence that the
selection of one target is accompanied by the inhibition of another (see Figure 1.2a).
Desimone summarizes this process as ―…an initial parallel activation of cortical
representations by several stimuli in the visual field, and the ultimate suppression of
response to the behaviourally irrelevant distractor‖ (1998, p. 1248).
Evidence for the control of competitive bias (i.e. top-down selection of some
task-relevant object features over others) is an expansive topic in and of itself (e.g. Corbetta,
Patel, & Shulman, 2008; Corbetta & Shulman, 2002). For the purposes of the current
thesis, it is enough to say that studies have demonstrated that a cue which precedes the
onset of a stimulus activates visual areas in the brain which are sensitive to that cue (e.g.
complex shape in monkey V4/IT neurophysiology (Chelazzi et al., 1998) or spatial
location in human neuroimaging of V1-V4 (Kastner, Pinsk, De Weerd, Desimone, &
Ungerleider, 1999)), and that this activity persists even after the cue is gone – anticipating
the upcoming stimulus and biasing future neural events. Duncan makes one remark
regarding the control of bias that is particularly relevant to the current thesis, ―Perhaps
the most important point is its flexibility – potentially, any type of object can be relevant
(2006, p. 5). One could imagine that, in one task, tall grey objects are the targets of
action, and thus areas in the brain selecting for colour and shape would show a bias for
those features. However, in a different task (like those described in this thesis) tall grey
objects could act as obstacles, and never be selected as targets. In these cases, the
relevance of the tall grey object might be determined by its position with respect to the
current movement goal, and the attention it receives may be generated from areas in the
brain that are specifically involved with generating and maintaining movement plans.
One final issue regarding the control of competitive bias is the ‗source‘ of the biasing
signals. I use the word source tentatively since Duncan argues that, ―integrated
competition does not sit well with a firm site-source distinction…bias can begin at any
part of the system, spreading both to ―higher‖ and ―lower‖ levels‖ (2006, p. 21). He does
suggest, however, that ―flexibility and selectivity…may reach their peak in regions of frontal and parietal cortex‖ (2006, p. 14). This identification of a frontoparietal network
implicated in the control of attention (or selective bias) fits well with a substantive
literature providing evidence for that claim (Beck & Kastner, 2009; Corbetta et al., 2008;
Corbetta & Shulman, 2002; Kastner & Ungerleider, 2000; Pessoa, Kastner, &
Ungerleider, 2003; Riddoch et al., 2010; Serences & Yantis, 2007). Moreover, many of
these studies demonstrate that this frontoparietal network can modulate the visual cortical
representation of objects – enhancing activity at attended locations and suppressing
activity at unattended locations in retinotopic cortex. The most relevant of these studies,
those specifically dealing with the suppression of a signal at a location corresponding to a
distracting stimulus are discussed in section 1.3.
Finally, the tenet of the biased competition hypothesis that has received the least
experimental evidence is for the integration of representations across systems. That is, as
Duncan puts it, ―…effective behaviour will require selective focus on particular sensory
inputs, on particular action goals, on particular information from semantic memory and
so on; usually, we ―attend‖ to all these things as a coherent whole‖ (2006, p. 21). Two
lines of evidence do suggest that integration does occur. First, with improved detection
of retinotopic maps extending into frontal and parietal cortex (e.g. the frontal eye fields
quadrant of the visual field led to an enhanced signal in that field across the nearly 20
maps identified throughout the frontoparietal network (Beck & Kastner, 2009). Second,
when participants were asked to attend to only one feature of an object (say the colour of
a patch of moving dots), selective biases also developed in regions responding to an
orthogonal dimension (e.g. motion areas were also selectively biased, McMains, Fehd,
Emmanouil, & Kastner, 2007); this speaks to the integration of object encoding across
several areas of cortex (O'Craven, Downing, & Kanwisher, 1999). In the current thesis,
we are specifically interested in the integration of object encoding that is relevant because
of its implications to an upcoming action. That is, if an object obstructs a ‗particular action goal‘ (as Duncan remarked) would its neural representation be selectively biased at
other points in the brain? The two additional theoretical frameworks discussed next
address this point in more detail.
1.2.2. Affordance competition hypothesis
First outlined by Paul Cisek in 2007 and recently presented more broadly with additional
accompanying evidence (Cisek & Kalaska, 2010) the affordance competition hypothesis
argues that the competing representations in the brain occur between the potential actions
afforded by the environment. In many ways, the affordance competition hypothesis
operates on the same principles as the biased competition hypothesis, a point Cisek and
Kalaska acknowledge, ―…models of action selection…are functionally equivalent to the
biased competition model used to explain data on visual attention‖ (2010, p. 283). The
critical difference emerges in that the affordance competition hypothesis is completely
grounded in an ethological and evolutionary explanation. As I have already quoted, but
will repeat since I firmly believe it is a point worth repeating, Cisek and Kalaska state,
―One of the most important facts we know about the brain is that it evolved‖ (2010, p.
275). Moreover:
representations of the potential actions which the environment currently affords‖ (Cisek, 2007, p. 1586).
Thus, the selective biases that develop in the brain are selective of and biased toward
actions. Ultimately, task relevance must be dictated by actions, since the task (from an
evolutionary perspective) is always to perform the most beneficial action and thus the
relevance of any object is intrinsically tied to how it shapes movements. From this
perspective, it is clear that obstacle objects (which clearly impact actions) are an
important component of the competitive framework.
Since the key difference between the biased competition and affordance competition
hypotheses is the nature of what is being represented in the brain (which is difficult to test
experimentally), not where and how, the evidence for both hypotheses is similar. That is,
like Duncan, Cisek argues that, ―the competition between potential actions plays out in
large part within the reciprocally interconnected fronto-parietal system‖ (Cisek, 2007, p.
1588). One study by Cisek and Kalaska, which therefore could support both frameworks
of competition, involved recording activity from the premotor cortex of a monkey
performing a delayed reach task (Cisek & Kalaska, 2002, 2005). Here, the monkey was
shown a simple display with two differently coloured targets (a red and blue circle
equally eccentric from a central fixation) either of which could be the target of a reach
action on a given trial. After a delay, a colour cue presented at fixation indicated to the
monkey which target to reach for. The critical finding was that, during the delay, across
a population of neurons in the premotor cortex, two discrete peaks of activity were
recorded – one for each of the two potential target locations (see Figure 1.2b).
Importantly, once the colour cue indicated which target was to be acted on, the activity
corresponding to that target location increased dramatically, while activity corresponding
to the non-selected location was reduced to baseline. Equally importantly, the same
premotor neurons that were active during the delay and showed selectivity for the target
with the presentation of the colour cue were also robustly active during the movement.
This provides critical evidence that the final reach target was not just selected but was
specifically selected for action. The fact that the same neurons were responsible from the
visual specification of both targets, through the selection of one target and, critically,
competitive neural representations are ultimately there to shape action. Given this
hypothesis – which favours an interpretation of attentional distribution based on an
object‘s relevance to the planned action – we would predict that obstacle objects should
show competitive / selective effects comparable to other task / action relevant objects.
One aspect of this hypothesis regarding obstacles is tested and described in the third and
final framework discussed below.
1.2.3. Attentional landscapes hypothesis
Recently put forward by Baldauf and Deubel (2010), the attentional landscapes
hypothesis represents a sort of compromise between the biased competition hypothesis
(which is primarily concerned with visual selective attention) and the affordance
competition hypothesis (which is primarily concerned with the implications of
competitive representations of motor plans). In their review, they introduce a concept
called visual preparation, ―the spatially selective, action-specific extraction of motor-relevant information from the visual scene by means of attentional mechanisms‖ (Baldauf
& Deubel, 2010, p. 999). They go on to argue that,
―Visual preparation involves the top-down weighting of incoming visual information via feedback routes from action planning areas of the brain. We suggest that any kind of goal-directed action preparation is accompanied by a visual preparation process and that the top-down signals that weight visual information at early processing stages may therefore have various possible sources, depending on which motor system is in use. Although understood as a top-down weighting of visual input, the process of visual preparation is automatic in the sense that it is a mandatory component of preparing a goal-directed action‖ (2010, p. 999).
Baldauf and Duebel conceptualize the resulting allocation of visual attention as an
‗attentional landscape‘ with peaks of activation facilitating the visual representation of
task relevant objects (from a goal directed motor sense) and valleys of activation
inhibiting the representation of irrelevant, distracting or interfering objects. Among the
many examples of experimental evidence presented in their review (Baldauf & Deubel,
2010), several of the studies deserve specific attention in the current thesis. A group of
the studies have used a similar paradigm to demonstrate how the allocation of visual
to perform two tasks: the first is a target directed action (here I restrict myself to a
discussion of reach movements, but similar work has been done with eye movements,
Baldauf & Deubel, 2008; Deubel & Schneider, 1996; Schneider & Deubel, 2002) and the
second is a perceptual identification (see Figure 1.3). The perceptual identification
requires participants to indicate whether a target briefly (~100ms) presented among
distractors, then immediately masked, was an ‗E‘ or was a reverse E (similar to a digital
‗3‘). The target is presented after the participants are cued to make a movement but
before the movement has been initiated. The critical comparison examines identification
performance when the target is presented at action-relevant (i.e. the goal of an action) or
action-irrelevant locations. Several studies using this paradigm provide insight that is
significant to the current thesis. First, it was found that the preparation of a reach
movement to a target position facilitated detection specifically at that location (Duebel,
Schneider, & Paprotta, 1998). Second, impressively, this finding extended to cases
where participants were making sequential movements (Baldauf, Wolf, & Deubel, 2006).
In this study, participants planned movements where they reached to an initial target
position and then to a target position one removed in a clockwise direction (equivalent to
pointing to the 1 and then the 3 on a standard clock). Identification at both movement
goals was enhanced. Moreover, when participants were required to extend the movement
to include a 3rd location (either once more removed from the second target (like 1, 3, 5 on
a clock), or directly across the circle (like 1, 3, 9 on a clock)) the identification
enhancement was seen at all three locations. Importantly, the enhancement at multiple
locations did not come at a cost to the enhancement at a single location – that is,
participants were as good at detecting targets at the first movement goal regardless of
whether it was the only target, or the first of three targets. This finding provides strong
evidence for the parallel specification of movement goals and the attentional
enhancement at multiple points in the attentional landscape – likely a necessary
Figure 1.3. Stimuli arrangement for two studies using the dual-task perceptual
identification / reaching paradigm (A) From Shiegg et al. (2003): A cross could be
grasped with the thumb and forefinger at opposite ends of either cross-beam. Targets and
distractors could be presented at one of 16 locations, some of which aligned with the
grasp points. (B) From Duebel and Schneider (2004): Participants made reaches with
either their left or right hand (starting at Sleft or Sright respectively) to one of two goal
targets (aligned directly ahead of the left and right start positions). An obstacle was
sometimes present in the middle of the workspace. Targets and distractors could be
presented at either of the goal locations or at the obstacle location. (C) Example of targets
Two additional studies are particularly relevant to the current thesis. The first (of
consequence to the experiment described in Chapter 4, C. S. Chapman, Gallivan,
Culham, & Goodale, 2010) showed that when participants planned a grasp toward an
object shaped like an ‗X‘ (finger and thumb on opposite ends of one arm of the ‗X‘)
identification enhancement was seen for targets presented at both the index finger and the
thumb targets, but not at the ends of the other arm of the ‗X‘ (see Figure 1.3a, Schiegg et
al., 2003). This suggests that grasping also requires the parallel processing of multiple
target positions, in this case both the finger and thumb goals. Finally, most relevant to
the current study, these researchers examined the allocation of attention in a task
requiring the avoidance of an obstacle (Deubel & Schneider, 2004). In this study
participants made reaches with either their left or their right hand, each of which started
from its own start position (see Figure 1.3b). Reaches with either hand could be toward
one of two targets – straight ahead or across the workspace (to the straight-ahead target
for the opposite hand). On half the trials, an obstacle was placed in the middle of the
workspace (midpoint of the square formed by start and target positions). Identification
was tested at three locations – the two target locations and the location of the obstacle.
Of most interest, identification performance was enhanced at the obstacle location only
when an obstacle was present and only when an across-workspace reach was required.
That is, on straight ahead reaches with either hand (where avoidance was not required
and trajectory deviations were not observed) there was no perceptual enhancement at the
obstacle location. In comparison, on trials when the arm crossed the workspace, and
deviations were required in order to avoid the obstacle, perceptual enhancement was seen
at the obstacle location. Critically, this finding suggests that the obstacle position was
automatically coded (as measured by attentional enhancement) prior to movement onset,
and that this enhancement was specifically tied to the current movement goal and level of
interference provided by the obstacle.
Finally, two recent studies by the same research group have examined the neural
correlates of this attentional enhancement at action-relevant locations. Using the known
event related potential (ERP) response difference to flashed items at attended versus
unattended locations (known as the dot-probe paradigm), Baldauf and Duebel (2009)
a sequential pointing task. While source localization is a difficult problem with ERPs,
these researchers speculated that the prefrontal cortex and posterior parietal cortex (PPC)
were likely involved. The involvement of the PPC was directly tested using neural
recordings from the PPC of behaving monkeys (Baldauf et al., 2008). The majority of
cells with a preferred reach direction showed an enhanced response when either the first
or second of the sequential targets was present in their receptive field, and this
enhancement persisted across a delay period (see Figure 1.2c).
Several principles can be extracted from the attentional landscape hypothesis that
resonate with the two previously discussed frameworks and that have important
implications for the current thesis and obstacle representation in general. First, as with
both the biased competition and affordance competition hypotheses, the attentional
landscape hypothesis argues for the parallel representation of multiple visual objects (or
parts of objects, as is the case in grasping). While the attentional landscape hypothesis
does not make a direct claim for competition, parallel encoding when (usually) only one
target is selected implies a competitive interaction. Second, and more akin to the
affordance competition hypothesis, the peaks of facilitation within an attentional
landscape are intrinsically bound to action goals. Third, a frontoparietal network is
implicated in the control (or manifestation) of selective biases, with potential effects
visible in the early visual cortical representation of selected or inhibited objects. Finally,
and specific to the evidence presented for the attentional landscape hypothesis, the
representation at obstacle locations is enhanced prior to movement onset and is
contingent on the level of interference the obstacle presents to the current reach
movement.
1.2.4. Conclusions from frameworks
Here I summarize three key points of convergence across the three frameworks described
above. For each point, how it specifically affects our understanding of obstacles, and
how it motivated the current thesis is discussed.
At the start of this section I proposed that one way obstacles might influence action is for
their neural coding to be actively inhibited relative to the encoding of a target object.
This proposal requires that there is an initial positive coding for both the target and
obstacle object, followed by the inhibition of the obstacle-related activity and a
corresponding boost to the target-related activity. Studies that have been motivated by all
three frameworks provide evidence supporting the notion of an initial parallel encoding
of objects, where an initial response to two or more objects in the workspace has been
demonstrated (see Figure 1.2). Both the competitive bias and affordance competition
hypotheses have argued that the activity associated with non-target objects (but not
necessarily obstacles) is suppressed once a target is specified. What is still unknown is
whether or not the neural encoding of obstacles will show the same suppression as the
neural encoding of non-selected objects; that is, if an obstacle‘s non-target status is
implied, rather than cued, will there still be evidence for suppression? That is one of the
specific questions tackled in the current thesis.
Dynamics of non-target representations – from planning to execution
Another feature uniting all three frameworks is the evidence that parallel selective biases
develop prior to movement initiation. This indicates that parallel object/motor-plan
specification develops and is maintained across delays during movement planning – an
aspect that will become important both when we consider the obstacle effects in
neuropsychological patients discussed in section 1.6 and the design of the functional
magnetic resonance imaging (fMRI) study discussed in Chapter 4 (C. S. Chapman,
Gallivan, Culham et al., 2010). Furthermore, the idea of the dynamics of the obstacle
representation (i.e. how they evolve during movement execution) – a relatively
unexplored aspect of non-target representations – also provided the motivation for the
behavioural studies (C. S. Chapman & Goodale, 2010a, 2010b) conducted in the current
thesis.
Frontoparietal (dorsal stream) control of visuomotor bias
A final point of commonality between the three frameworks that is significant to the
frontoparietal network. This network is putatively responsible for the flexible selection
of action relevant objects and inhibition of objects that are irrelevant or interfere with
movements. As will be discussed in section 1.6, frontoparietal circuits are also part of the
dorsal visual stream, known to carry and transform visual information important for the
control of action and implicated in obstacle avoidance in neuropsychological populations.
In the current thesis, I aim to specifically test the involvement and capabilities of the
dorsal stream in obstacle avoidance both behaviourally and through neuroimaging.
The remainder of the Introduction loosely follows the order of the three topics presented
above. First, I review experimental evidence in support of the suppression of non-target
(or distractor) visual information in both neuroimaging and behavioural work. Since the
current thesis presents the first neuroimaging experiment directly looking for the
suppression of neural activity associated with obstacles, the neuroimaging portion of this
review is restricted to an examination of the suppression of activity associated with
non-obstacle distractors in predominantly non-action tasks. The behavioural portion focuses
entirely on work examining the effect of distractors on reaching and grasping
movements. A complementary literature in the domain of eye-movements is likely
relevant, but is not discussed for the sake of brevity. The second and third topics –
namely the dynamics of obstacle representation and its control by the dorsal visual stream
– while distinct motivating factors for the current thesis, are largely inseparable in the
relevant work that is reviewed. As such, the remaining sections in the Introduction
discuss the dynamics and dorsal stream control of obstacle avoidance together. First, I
review the (limited) work on obstacle avoidance in non-human animals before turning the
focus to work on neuropsychological patients. I conclude the Introduction with a
summary of previous behavioural work on obstacle avoidance during reach and grasp
movements.
1.3. Neural correlates of distractor suppression
1.3.1. Suppression in an action task
As discussed above, within a biased competition framework, an obstacle can be