Decoding the Functional Relevance of
Intrinsic Brain Activity with (TMS-)EEG
Sarah Glim
Dissertation
der Graduate School of Systemic Neurosciences der Ludwig-Maximilians-Universität München
Supervisor: Dr. Afra M. Wohlschläger Department of Neuroradiology Technische Universität München
First Reviewer: Dr. Afra M. Wohlschläger
Second Reviewer: Dr. Christian Sorg
External Reviewer: Prof. Dr. Dr. Kai Vogeley
Date of Submission: September 05, 2018
ABSTRACT
While the human brain had long been considered a reflexive organ that operates primarily in response to stimulation, more and more recent evidence instead points to a proactive role of it. Among such evidence is the observation that the brain exhibits striking patterns of activation also in the absence of any external stimulus, with these patterns being highly organized in both time and space. The overarching aim of the current thesis is to contribute to a better understanding of this so-called intrinsic brain activity, as measured non-invasively with electroencephalography (EEG). To this end, two original research projects were conducted. By examining the functional relevance of low-frequency fluctuations in intrinsic activity on the one hand and by exploring an experimental design able to enhance the measurability of intrinsic cross-frequency coupling on the other hand, these projects were targeted at dynamically evolving intrinsic brain activity in terms of both content and methodology.
In the second project of the current thesis, EEG was combined with concurrent transcranial magnetic stimulation (TMS), implemented as single-pulse TMS (sTMS) and repetitive TMS (rTMS) at 5, 11, and 23 Hz over the left motor cortex and the right visual cortex of healthy participants. We investigated the influence of this stimulation on theta-gamma, alpha-gamma, and beta-gamma phase-amplitude coupling and found that, relative to sham stimulation, TMS pulses caused transient coupling increases in all assessed conditions. This effect arose not only at the stimulation site but also over various other cortical regions, with the propagation induced by rTMS outperforming that induced by sTMS. The obtained findings support considerations according to which TMS synchronizes natural neural oscillators and thereby enhances the detectability of associated intrinsic signals at the EEG-recorded population level. It stands to reason that concurrent TMS-EEG thus constitutes an effective methodological tool to assess (the functional relevance of) intrinsic brain activity non-invasively at a considerably improved signal-to-noise ratio.
TABLE OF CONTENTS
ABSTRACT ………... i
TABLE OF CONTENTS ………. iii
1 Introduction: The Human Brain’s Intrinsic Activity ………... 1
1.1 The Human Brain during Rest ……….... 2
1.1.1 Discovering Intrinsic Brain Activity ………... 2
1.1.2 Temporo-Spatial Properties of Intrinsic Brain Activity ………….. 3
1.1.3 Intrinsic Brain Activity in Clinical Populations ……….. 6
1.2 The Human Brain during Active Tasks ……….. 7
1.2.1 Intrinsic Brain Activity Impacts on Human Performance ………... 7
1.2.2 Relating Intrinsic Brain Activity in V1 to Visual Consciousness ... 10
1.3 Aims of the Thesis ……….. 11
2 Project I: The Evolution of Pre-Stimulus Slow Cortical Potentials is Associated with an Upcoming Stimulus’ Access to Visual Consciousness ……….... 15
3 Project II: Phase-Amplitude Coupling of Neural Oscillations can be Effectively Probed with Concurrent TMS-EEG ……….. 51
4 Discussion: Decoding the Restless Brain ………. 83
4.1 Advancing Research on Intrinsic Brain Activity ……… 83
4.2 Methodological Considerations ……….. 87
4.3 Future Directions and Already Accomplished Steps ………... 90
4.4 Conclusions ……….... 94
REFERENCES ………. v
ACKNOWLEDGMENTS ……….... xix
LIST OF PUBLICATIONS ………. xxiii
EIDESSTATTLICHE VERSICHERUNG/AFFIDAVIT ……….... xxv
1
Introduction:
The Human Brain’s Intrinsic Activity
decoding of the restless brain is going to be indispensable for a general understanding of the brain in both the healthy and diseased state.
1.1 The Human Brain during Rest
While the human brain is restless by its very nature, this nature is best investigated during so-called resting state measurements, in which the participant’s brain activity is recorded in the absence of any explicit task. In the current section, essential insights into the brain’s condition during resting state are presented by portraying (1) a short history of such measurements, (2) the temporo-spatial properties of intrinsic brain activity that were identified through them, and (3) the potential of human resting state data for the assessment of different psychiatric and neurological disorders, whose diagnosis and treatment monitoring might be crucially facilitated through the study of intrinsic brain activity.
1.1.1 Discovering Intrinsic Brain Activity
research aimed at identifying the human brain’s intrinsic functional connectome (for reviews, see Smith et al. 2013; van den Heuvel and Hulshoff Pol 2010). Up to the present, manifold methods for associated signal analyses and the treatment of potentially confounding non-neuronal signals (e.g., fluctuations originating from cardiac and respiratory cycles) have been actively developed (e.g., Allen et al. 2014; Chang et al. 2009; Friston et al. 2014; Murphy et al. 2013). Novel technological advancements, especially the simultaneous collection of EEG and fMRI data and the involved combination of high temporal and high spatial data resolution (see Huster et al. 2012), promise further remarkable discoveries in the near future, with the research potential in the field of intrinsic brain activity being far from exhausted.
1.1.2 Temporo-Spatial Properties of Intrinsic Brain Activity
region or set of regions, as a means of effective information gating. As active information processing is by contrast associated with neural activity in the faster gamma band (approximately 30-100 Hz; Henrie and Shapley 2005; Melloni et al. 2007; Pesaran et al. 2002), cross-frequency interactions between both bands are considered a fundamental tool of intrinsic neural coordination (Bonnefond and Jensen 2015; Jensen and Mazaheri 2010; Osipova et al. 2008). More generally, such interactions, implemented in particular as coupling between a slower oscillation’s phase and a faster oscillation’s amplitude (Canolty et al. 2006; Lakatos et al. 2005; Tort et al. 2010), enable the integration of functional systems across different temporo-spatial scales, with high-frequency activity typically reflecting local cortical processing and low-frequency activity arising from the computations of large-scale brain networks (Canolty and Knight 2010). At the lower end of such low-frequency activity and outside of the traditionally employed frequency bands, so-called slow cortical potentials (SCPs; typically ≤ 1 Hz) have lately received broad attention and are now increasingly considered in the context of neural information processing (He and Raichle 2009; Khader et al. 2008; Northoff 2017). Based on their slow time scale, SCPs have been proposed to be optimally positioned for the synchronization of distributed brain regions and to consequently carry out large-scale information integration in the brain (He and Raichle 2009).
on multiple frequency channels (Deco et al. 2017). To illuminate the precise specifics of such communication patterns, modern neuroimaging research is taking advantage of the wide spatial range of low-frequency signal transmission in particular and has so far produced a number of seminal findings on the brain’s global architecture, as detailed next.
distinct stable networks. Taking a different approach, Mitra and colleagues (Mitra et al. 2015) broke the conventional resting state networks down into sequences of propagating activity and identified so-called temporal lag threads as a fundamental organizing property of intrinsic brain activity. By applying analysis techniques based on graph theory, others have characterized the complex topological properties of intrinsic brain networks, including small-world organization with deeply connected hub regions (for a review, see Wang et al. 2010). When taking these extensive temporo-spatial mechanisms of intrinsic brain activity into consideration, it should come as no surprise that their maintenance accounts for the majority of the brain’s energy consumption (Raichle and Mintun 2006).
1.1.3 Intrinsic Brain Activity in Clinical Populations
network, the salience network, as well as the central executive network (Menon 2011). Since resting state data have thus good potential as a significant marker of disease and treatment response and can be collected easily in clinical populations (relative to task-based examinations), their assessment together with an elevated understanding of intrinsic brain activity might be able to drive personalized medicine in the context of brain-related disorders to a new and enduring high.
1.2 The Human Brain during Active Tasks
In everyday life though, the brain rarely operates in a state of task-free rest. Instead, it continuously receives sensory input, actively processes and evaluates information, forms decisions, and plans and executes motor commands. Intrinsic brain activity does not cease to exist during these routines but runs alongside them and interacts with associated stimulation- or task-related activations and resulting overt output. In the current section, the form of such interactions is discussed in order to convey a detailed picture of how intrinsic brain activity influences human perception, cognition, and behavior. This is achieved by portraying (1) a broad overview of neuroscientific studies that contributed to the field and (2) a close-up view of one particular fMRI study that examined the tight relationship between intrinsic brain activity in early visual areas and the conscious perception of a briefly presented visual target stimulus (Wohlschläger et al. 2016). The latter study is highlighted as it is part of the research work of the current thesis’ author and a direct precursor of this thesis’ first main project.
1.2.1 Intrinsic Brain Activity Impacts on Human Performance
naturally free of any effects directly evoked by the stimulus, and to examine how this activity influences subsequent post-stimulus activity and/or relevant behavioral outcome measures (e.g., Britz et al. 2014; Busch et al. 2009; Devrim et al. 1999; Ergenoglu et al. 2004; Hesselmann et al. 2008a, 2008b; Scheeringa et al. 2011). Given a sufficient spatial resolution, one can also use activity time courses of non-engaged brain regions that exhibit high resting state functional connectivity to the engaged region of interest as a proxy for ongoing intrinsic activity in that very region not only before but also during active processing (e.g., Fox et al. 2006, 2007; Schölvinck et al. 2012; Wohlschläger et al. 2016). Recently, Huang and colleagues (Huang et al. 2017) furthermore proposed a novel signal correction approach, based on the subtraction of stimulation-free pseudo-trials, to analyze the interaction between intrinsic and evoked brain activity without the need to assume that certain brain regions are entirely unaffected by stimulation. While findings can vary among analysis techniques (see Huang et al. 2017), they are all in all suited to draw a comprehensive picture of the eminent functional relevance of intrinsic brain activity.
scales and the brain’s operations and outputs during active (visual) tasks. Yet, numerous open questions remain to be explored.
1.2.2 Relating Intrinsic Brain Activity in V1 to Visual Consciousness
unstimulated left-hemispheric parts of these networks served as a proxy for intrinsic brain activity. In addition, sites of significant activation by the target in the right-hemispheric network parts were extracted to examine stimulation-related brain activity. Analyzing the BOLD signal time courses within these regions of interest revealed the following main findings. In trials where the target was consciously perceived as compared to missed, (1) intrinsic brain activity in V2 was significantly lower before target presentation, (2) intrinsic brain activity in V1 was significantly higher during the interval of active target processing, and (3) stimulation-related activity in both V1 and V2 was significantly higher during active target processing. Interestingly, in V1, intrinsic activity before target presentation was significantly correlated with stimulation-related activity during target processing on a trial-by-trial basis, with lower pre-target intrinsic activity accompanying higher stimulation-related activity. An additional analysis of the intrinsic BOLD signal time courses, filtered narrowly to the dominant frequency of the whole-brain resting state data in order to eliminate any remaining task effects, moreover revealed a significant relation between V1’s intrinsic signal evolution before target presentation and the access to consciousness, with a predominant pre-target signal decrease preceding a lack of conscious awareness. Together, these findings vividly illustrate the strong connection between fMRI-based fluctuations in intrinsic brain activity, especially within the primary visual cortex/V1, and the neural and behavioral markers of conscious visual perception. Since the fate of sensory information seems to critically depend on the particular intrinsic state that it meets when entering the human cortex, it becomes obvious now that intrinsic brain activity is not a mere by-product of normal brain functioning but an elementary building block of this very condition.
1.3 Aims of the Thesis
spectral characteristics. This activity is assessed non-invasively with scalp EEG, whose high temporal data resolution and relatively easy and cost-efficient application make the method attractive for a wide range of scientific and clinical practices. The thesis is subdivided into two main projects, with the first project directly continuing our fMRI study on the relation between low-frequency fluctuations in intrinsic brain activity and the emergence of visual consciousness (Wohlschläger et al. 2016; see above) and the second project putting forth a novel experimental technique based on the combination of EEG and transcranial magnetic stimulation (TMS) to enhance the measurability of intrinsic brain activity, in the form of intrinsic phase-amplitude coupling, in non-invasive brain recordings. The two presented projects examine the dynamics of prevalent fluctuations and oscillations within the restless brain and thereby contribute directly to the ever-growing field of interest surrounding intrinsic brain activity. Together, they open the door for future studies aimed at demonstrating the relevance of this activity for emerging perception at a considerably improved signal-to-noise ratio.
project, it was tested whether this link holds true for intrinsic brain activity in the context of conscious visual perception. Using a visual backward-masking paradigm similar to the one used by Wohlschläger and colleagues (Wohlschläger et al. 2016) with concurrent EEG, we addressed the following research question. Do intrinsic fluctuations in SCPs, in particular their relative evolution toward stimulus presentation (rather than their sheer magnitude; see Devrim et al. 1999), relate to whether that stimulus will reach conscious awareness? Substantiated insights into this matter can advance our understanding of the neurophysiological basis and functional relevance of fluctuating intrinsic brain activity while further illuminating the variability in sensory experiences omnipresent in everyday life.
particular, the following research question was addressed. Does TMS cause a transient enhancement of the macroscopic phase-amplitude coupling of neural oscillations, as measured with concurrent EEG? Evidence for such a modulation can enable a new surge of studies successfully demonstrating intrinsic phase-amplitude coupling in the human brain and relating this mechanism to healthy and/or pathological brain functioning.
2
Project I:
The Evolution of Pre-Stimulus Slow Cortical Potentials
is Associated with an Upcoming Stimulus’
Access to Visual Consciousness
The current chapter depicts a research article entitled “The evolution of pre-stimulus slow cortical potentials is associated with an upcoming stimulus’ access to visual consciousness”. The article is authored by Sarah Glim, Anja Ries, Christian Sorg, and Afra M. Wohlschläger and is currently unpublished. In the presented research project, a visual backward-masking task was used to elicit perception near sensory threshold. It was demonstrated that the evolution of EEG-recorded SCPs can be related to the level of conscious stimulus perception seconds before the actual stimulus presentation, with this finding strengthening the link between slow fluctuations in intrinsic brain activity and essential perceptual functioning.
Contributions
The evolution of pre-stimulus slow cortical potentials is associated
with an upcoming stimulus’ access to visual consciousness
Sarah Glim1,2,3, Anja Ries1,2, Christian Sorg1,2,4, Afra M. Wohlschläger1,2,3,*
1
Abstract
Slow cortical potentials (SCPs) have been proposed to be optimally positioned for neural processes leading up to the formation of conscious visual experience. While the sheer signal magnitude of SCPs can indeed influence the perception of a subsequently appearing visual stimulus, the role of their relative evolution toward stimulus presentation has so far received much less attention. To this end, we recorded direct-current electroencephalography during a visual backward-masking task, which required participants to localize the missing part of a briefly presented target stimulus. A subsequent confidence rating was used as a proxy for the target’s access to conscious awareness. Broadband event-related potentials (ERPs) of all correct trials were determined relative to a short period immediately before the target and then compared among consciousness levels. From 2 s prior to target presentation up to this period, a negative relationship between ERPs and the level of consciousness became evident, with the grand average ERP slowly increasing toward the target when highest conscious awareness was about to be formed and slightly declining in all other cases. After target presentation, conscious awareness was characterized by an enhanced visual awareness negativity, an increased P3 component, and associated positive SCPs. By stressing the relevance of their intrinsic pre-stimulus evolution while also noting their occurrence during active stimulus processing, our findings support the proposed role of SCPs in the successful emergence of conscious visual perception.
Keywords
New & Noteworthy
We used a backward-masking paradigm to elicit visual perception near sensory threshold. The level of conscious target processing was found to be associated with the evolution of slow cortical potentials (SCPs) seconds before target presentation. After target presentation, visual consciousness was characterized by enhancements of the visual awareness negativity, the P3 component, and related positive SCPs. Results stress the importance of SCPs alongside faster neural processes for emerging visual consciousness.
Introduction
the global neuronal workspace model (GNW model; Dehaene and Changeux 2011; Dehaene and Naccache 2001; Dehaene et al. 1998), the integrated information theory (IIT; Oizumi et al. 2014; Tononi 2004), and the temporo-spatial theory of consciousness (TTC; Northoff 2013, 2017; Northoff and Huang 2017). While the fundamental role of SCPs in the emergence of conscious awareness is thus generally agreed upon, knowledge of their precise shape and timing in empirical recordings of varying perceptual outcomes is still incomplete.
of SCPs. It should be noted, though, that methodological criticism regarding such phase dependency has recently been raised, attributing effects in parts to a mere filtering artifact, namely the characteristic of acausal filters to smear post-stimulus differences into the pre-stimulus time interval (Zoefel and Heil 2013). While these studies thus hint, tentatively and with reservations, at a potential connection also between the pre-stimulus signal evolution of EEG-recorded SCPs on the one hand and upcoming consciousness in the visual domain on the other hand, the present study aims at providing direct and methodologically clean evidence for this relation.
about the precise profile (e.g., frequency structure and rhythmicity) of SCPs and other potentially relevant electrophysiological signals. We hence spared narrow band-pass filtering and involved artificial signal modifications and instead took advantage of the 1/f power relationship inherent to EEG data (Buzsáki and Draguhn 2004; Dehghani et al. 2010; see also Freeman et al. 2000; He 2014) by assessing SCP-dominated, broadband event-related potentials (ERPs). ERPs were computed relative to a 0.2 s window immediately before target onset and thereby satisfied our primary interest not in sheer signal magnitude but in the evolution of signals around the target stimulus. Subsequent statistical tests (Page 1963) were used to assess monotonic changes of voltage values with changing consciousness levels. As the analysis’ main focus was on slowly changing pre-target differences in intrinsic activity fluctuations, the analysis window began 2 s before target onset. In addition, we also examined a corresponding post-target time interval, ending 2 s after target onset, with the intention to replicate previously established post-stimulation correlates of conscious processing (e.g., Koivisto et al. 2008; Lamy et al. 2009; Ojanen et al. 2003; Pins and ffytche 2003).
Materials and Methods
Participants
Behavioral Task
trials), the middle interval in 33/100 trials (17/50 trials), and the longest interval in 33/100 trials (16/50 trials) of the actual experimental blocks (training blocks) in randomized order.
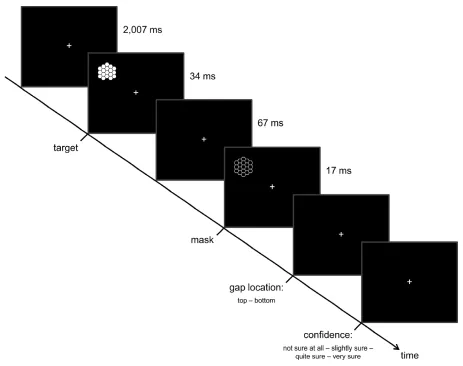
Fig. 1. Behavioral task. Throughout the task, participants fixated a white cross displayed
centrally on a black computer screen. Following the presentation of just this fixation cross,
each trial proceeded with the addition of a target stimulus, a honeycomb-like grid with a
missing comb either at its top or bottom, in the upper or lower left visual field. After a fixed
inter-stimulus interval, a negative image of the complete grid was presented at the same
location, acting as a backward mask. Participants then had to indicate, first, the location of
the target’s missing comb and, second, their confidence on a four-point scale from “not sure
at all” over “slightly sure” and “quite sure” to “very sure” via unspeeded button presses.
After an inter-trial interval of 6,021 ms, 8,028 ms, or 10,035 ms, the next trial began
The visual perception task was implemented within the following testing procedure. To familiarize them with the task, participants first underwent a training session, in which at least two blocks of 50 trials each had to be completed. In the first training block, the white fixation cross turned either green or red for 500 ms after the first response to indicate a correct or an incorrect judgment, respectively. No confidence ratings had to be given. The second training block was identical to the actual experiment, as described above. Depending on a participant’s performance and learning rate, further training blocks were optionally inserted. After this training session, participants completed 10 min of eyes-closed resting state, data of which were not analyzed in the context of the present study, followed by four blocks of 100 trials each of the visual perception task. Between blocks, participants could take short breaks.
Experimental Setup
plus system (Brain Products GmbH, Germany). Impedances between the skin and the electrodes were kept below 10 kΩ.
Behavioral Analysis
trials within each category relative to the total number of correct trials of a participant and then tested all proportions against the value of 0.25, representing the theoretical outcome of uniformly distributed confidence ratings, with two-tailed one-sample Student’s t-tests over participants. The significance threshold for the conducted behavioral analyses was set at p ≤ .05, unless stated otherwise.
EEG Preprocessing and Analysis
average of electrodes TP9 and TP10 and subjected to a semi-automatic data inspection with the following criteria: maximal allowed voltage step: 50 µV/ms, maximal allowed difference of values in a 100 ms interval: 200 µV, lowest allowed activity (difference between maximum and minimum) in a 100 ms interval: 0.5 µV. Whenever a criterion was violated, an interval of ± 200 ms around the respective data point was marked as bad for later data rejection. Additional intervals were tagged upon visual inspection where required. At last, the preprocessed time-domain data as well as the computed ICA components were down-sampled to a sampling rate of 500 Hz and imported into MATLAB (The MathWorks, Inc., USA).
Separately for each trial time point, we then performed a pair of non-parametric significance tests for linear ranks (Page’s trend tests; Page 1963), which allowed us to check the data for monotonic changes of voltage values with increasing levels of the ordinal confidence variable. To conduct these tests, we first ranked the trial-averaged voltage values of the different confidence categories separately for each participant, with the lowest value receiving the rank 1 and the highest value receiving the rank 4. Second, the test statistic L was computed as
∑ ∑
= n Yj m Xij
L ,
where n = 4 confidence categories, m = 14 participants, Yj = hypothetical rank of the jth confidence category, and Xij = observed rank of the jth confidence category within the ith participant. The test statistic L was computed twice, with the hypothetical ranking of confidence categories from “not sure at all” to “very sure” (Y) being 4, 3, 2, 1 when checking for a monotonic decrease and 1, 2, 3, 4 when checking for a monotonic increase of voltage values with increasing confidence. Third, statistical significance was determined by permutation testing. For each observed test statistic L, we computed 1,000 test statistics based on ranks that were permuted within participants. The p-value was defined as the proportion of permuted test statistics equal to or larger than the originally observed one. As we performed 4,002 such tests, two for each of 2,001 covered time points, p-values were subsequently adjusted for multiple comparisons with the false discovery rate (FDR) procedure (Benjamini and Hochberg 1995). The significance threshold was set at pFDR≤ .05.
Results
Behavioral Results
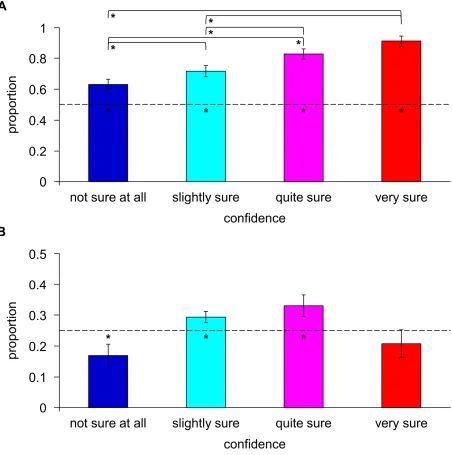
8.92, p < .001), and attests that neither floor nor ceiling effects in performance prevailed. The implemented backward-masking paradigm was thus well suited to elicit visual perception near the threshold of conscious awareness. Broken down into the different confidence categories (Fig. 2A), the proportion of correct trials relative to the total trial number within a particular category was 0.63 ± 0.13 for “not sure at all”, 0.72 ± 0.13 for “slightly sure”, 0.83 ± 0.12 for “quite sure”, and 0.91 ± 0.12 for “very sure” (mean ± SD over participants). All performance levels differed significantly from chance performance (two-tailed one-sample Student’s t -tests: t(13) = 3.91, p = .002 for “not sure at all”; t(13) = 6.00, p < .001 for “slightly sure”;
Fig. 2. Behavioral results. Bar charts show the proportion of correct trials in a particular
confidence category relative to the total trial number in that category (A) and the total
number of correct trials (B), respectively. Depicted are the mean proportion ± 1 SEM over N
= 14 participants. Values are based on valid trials only, as defined in “Materials and
Methods”. Statistical significance was examined with two-tailed one-sample Student’s t-tests
against the values of 0.5 or 0.25 (see dashed lines in A and B: * p ≤ .05) and two-tailed
paired-sample Student’s t-tests between categories (see lines above the respective bars in A: *
Next, we checked the allocation of correct trials to the different confidence categories in order to examine the relative sample sizes underlying the EEG analysis (Fig. 2B). The proportion of correct trials in a particular category relative to the total number of correct trials was 0.17 ± 0.14 for “not sure at all”, 0.29 ± 0.07 for “slightly sure”, 0.33 ± 0.13 for “quite sure”, and 0.21 ± 0.17 for “very sure” (mean ± SD over participants), with the first three proportions differing significantly from a value of 0.25, the theoretical outcome of uniformly distributed confidence ratings (two-tailed one-sample Student’s t-tests: t(13) = -2.20, p = .047 for “not sure at all”;
t(13) = 2.39, p = .032 for “slightly sure”; t(13) = 2.29, p = .039 for “quite sure”; t(13) = -0.94,
p = .362 for “very sure”). Although correct trials were thus non-uniformly distributed among the different confidence categories, the ranking of their relative sample sizes (“not sure at all” < “very sure” < “slightly sure” < “quite sure”) differed from those rankings tested in the EEG analysis and was therefore unlikely to have confounded the following findings.
Event-Related Potentials
manifest also ~0.2 s after target presentation, but did not r
electrode O2. Third, the opposite pattern, i.e., significant signal increases with increasing confidence ratings, emerged in an interval of approximately 0.45
yellow highlighting in Fig. 3). Th
difference between the two lowest confidence categories and a conspicuous deviation of the “very sure” category.
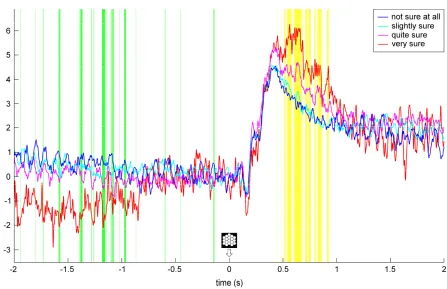
Fig. 3. Local event-related potentials (ERPs) at electrode O2. Grand average ERPs over N =
14 participants are displayed for the four utilized confidence categories as a function of trial
time, ranging from -2 s to 2 s around target onset. Time points at which th
significantly with increasing confidence ratings are highlighted in green, time points of
significant signal increase are marked in yellow (Page’s trend tests: p
correct valid trials were included in this analys
relative to a window of -0.2 s to 0 s around target onset.
manifest also ~0.2 s after target presentation, but did not reach statistical significance at , the opposite pattern, i.e., significant signal increases with increasing confidence ratings, emerged in an interval of approximately 0.45-0.9 s after target onset (see yellow highlighting in Fig. 3). The signal modulation was again non-linear, with only little difference between the two lowest confidence categories and a conspicuous deviation of the
related potentials (ERPs) at electrode O2. Grand average ERPs over N =
14 participants are displayed for the four utilized confidence categories as a function of trial
2 s to 2 s around target onset. Time points at which th
significantly with increasing confidence ratings are highlighted in green, time points of
significant signal increase are marked in yellow (Page’s trend tests: pFDR≤ .05). Note that only
correct valid trials were included in this analysis, with single-trial signal values computed
0.2 s to 0 s around target onset.
each statistical significance at , the opposite pattern, i.e., significant signal increases with increasing 0.9 s after target onset (see linear, with only little difference between the two lowest confidence categories and a conspicuous deviation of the
related potentials (ERPs) at electrode O2. Grand average ERPs over N =
14 participants are displayed for the four utilized confidence categories as a function of trial
2 s to 2 s around target onset. Time points at which the signal decreased
significantly with increasing confidence ratings are highlighted in green, time points of
≤ .05). Note that only
Next, we examined the topographic layout of the aforementioned three effects across all analyzed electrodes (Fig. 4). First, significant signal decreases with increasing confidence (see green highlighting in Fig. 4A) before target onset turned out to be concentrated on right occipital electrodes, with less prominent effects being observable at right parietal and fronto-temporal electrodes (see also Fig. 4B, for a different visualization of this topographic focus). As already observed at electrode O2, other electrodes’ signal patterns likewise indicated that the effect was driven primarily by a deviation of the “very sure” category from the other categories’ low-frequency signal traces. Second, several midline and right central electrodes showed significant signal decreases with increasing confidence around 0.2 s after target onset (see also Fig. 4C). Third, significant signal increases with increasing confidence ratings (see yellow highlighting in Fig. 4A) occurred in the post-target intervals of almost all electrodes. As can be easily appreciated via visual inspection, this effect was broadest at right frontal, fronto-central, and fronto-temporal electrodes, where it encompassed most of the post-target interval, and the least pronounced at corresponding electrodes of the left hemisphere (see also Fig. 4D).
Discussion
Fig. 4. Global topographic layout. (A) Grand average event
= 14 participants are displayed for the four utilized confidence categories and each available
scalp electrode. Time points at which the signal decreased significantly with in
confidence ratings are highlighted in green, time points of significant signal increase are
marked in yellow (Page’s trend tests: p
time points highlighted in green during the pre
target onset (C) as well as the number of time points highlighted in yellow during this latter
interval (D), with each interval containing 1,000 time points at a sampling rate of 500 Hz in
total.
with both acausal and causal (high
Zoefel and Heil 2013), including, but not limited to, the creation of artificial rhythmicity when
bal topographic layout. (A) Grand average event-related potentials (ERPs) over N
= 14 participants are displayed for the four utilized confidence categories and each available
scalp electrode. Time points at which the signal decreased significantly with in
confidence ratings are highlighted in green, time points of significant signal increase are
marked in yellow (Page’s trend tests: pFDR≤ .05). (B-D) Topographic maps show the number of
time points highlighted in green during the pre-target interval (B) and the entire interval after
target onset (C) as well as the number of time points highlighted in yellow during this latter
interval (D), with each interval containing 1,000 time points at a sampling rate of 500 Hz in
(high-pass) filters (Acunzo et al. 2012; Tanner et al. 2015, 2016; Zoefel and Heil 2013), including, but not limited to, the creation of artificial rhythmicity when
related potentials (ERPs) over N
= 14 participants are displayed for the four utilized confidence categories and each available
scalp electrode. Time points at which the signal decreased significantly with increasing
confidence ratings are highlighted in green, time points of significant signal increase are
D) Topographic maps show the number of
l (B) and the entire interval after
target onset (C) as well as the number of time points highlighted in yellow during this latter
interval (D), with each interval containing 1,000 time points at a sampling rate of 500 Hz in
being actually interested in a largely arrhythmic fluctuation (He and Raichle 2009) with no a priori hypotheses about the contribution of phase and amplitude progressions within specific tight frequency limits. The observations made in this manner fit closely to previous studies in the field, which related enhanced somatosensory stimulus detection to the rising phase of SCP activity (Monto et al. 2008) and associated a lack of conscious access with a declining pre-stimulus blood-oxygen-level-dependent (BOLD) signal (Wohlschläger et al. 2016). The present result extends these previous studies into the domain of EEG-monitored visual perception, where the access to consciousness has been shown before to relate to low-frequency differences in sheer pre-stimulus signal magnitude, with cortical negativity accompanying better perception (Devrim et al. 1999), rather than to differences in relative signal evolution.
Ekman et al. 2012). As proposed by the recently introduced TTC (Northoff and Huang 2017), such favorable settings might be characterized by a temporo-spatial alignment or binding of intrinsic activity to the incoming stimuli. The long cycle duration of SCPs could in this regard provide a temporal window for the integration of stimuli into a cognitive unity of consciousness, with the proper correspondence between SCP timing and stimulus onset constituting the prerequisite for that stimulus’ successful transfer to conscious awareness.
Topographically, the demonstrated relationship between pre-target EEG activity and conscious access was concentrated on electrodes over occipital and parietal sites of the right cerebral hemisphere, where the left-sided stimuli were primarily processed. This finding is consistent with previous work indicating that the connection between slow fluctuations in intrinsic brain activity and task performance is clearest in those brain regions pertaining to the task (Born et al. 1984) and, in the case of visual consciousness, stronger for the primary visual cortex, where bottom-up processing of the incoming stimulus dominates (Melloni et al. 2012), than for a later visual processing stage (Wohlschläger et al. 2016). Even though the spatial resolution of scalp EEG does not allow for a precise anatomical localization of effects, the topographic focus of our results together with these studies support the hypothesized role of intrinsic brain activity in the anticipatory fine-tuning of relevant processing capacities, with the stage for successful conscious access being set locally in brain regions involved in sensory stimulus processing.
this ignition will arise or not (Dehaene and Changeux 2005) is in accordance with the demonstrated relationship between pre-target activity fluctuations and conscious access. While broad correspondence thus seems to exist between the observed data and established model concepts, it should be noted that other authors have objected to the interpretation of P3 and associated positive SCPs as reflecting global ignition and instead related these signals to a global inhibition of irrelevant information (Li et al. 2014). Notwithstanding these discrepancies, our results support the long-distance character innate to both approaches by emphasizing the role of far-ranging information processing rather than that of localized activity in single visual areas (e.g., ffytche and Zeki 1996; Zeki and Bartels 1998; Zeki and ffytche 1998) for a successful transfer of visual information to consciousness, with evidence for the supramodality of human meta-cognitive mechanisms having recently been provided (Faivre et al. 2018).
Merikle 1986; Dienes et al. 1995; Fleming et al. 2012; Maniscalco and Lau 2012; Wohlschläger et al. 2016) and captured the emergence of visual consciousness sufficiently well in our study, as indicated by the broad correspondence of post-target effects with established correlates of conscious awareness (but see Li et al. 2014, for a dissociation of neural activity underlying confidence ratings and other measures of conscious access). Controlled experimental studies investigating the current findings with other behavioral measures are needed in the future to illuminate the precise interplay among the various theorized dimensions of consciousness inclusively (meta-)cognition that are potentially underlying them.
To summarize, we recorded DC-EEG during a demanding backward-masking task in which the visual target’s access to conscious processing was assessed on a trial-by-trial basis via subjective confidence ratings. The evolution of slow EEG signals in the SCP range was associated with this access as early as ~2 s before target presentation. Even though no claim to direct causality is made, these results suggest that the brain’s intrinsic state is critically involved in the perceptual fate of incoming sensory information. After target presentation, this fate was characterized by established neural correlates of consciousness, in particular the VAN, the P3 component, and related positive SCP shifts, with differences between consciousness categories lingering for at least 2 s post-target. Together, these findings add to our growing understanding of SCPs in the context of conscious awareness and encourage the routine inclusion and analysis of such low-frequency activity in future EEG studies.
Acknowledgments
Grants
S. Glim was supported by a scholarship of the Graduate School of Systemic Neurosciences (DFG - GSC 82/3). A. Ries was supported by the Studienstiftung des deutschen Volkes.
Disclosures
References
Acunzo DJ, MacKenzie G, van Rossum MCW. Systematic biases in early ERP and ERF components as a result of high-pass filtering. J Neurosci Methods 209: 212-218, 2012.
Bar M. The proactive brain: Using analogies and associations to generate predictions. Trends Cogn Sci 11: 280-289, 2007.
Benjamini Y, Hochberg Y. Controlling the false discovery rate: A practical and powerful approach to multiple testing. J R Statist Soc B 57: 289-300, 1995.
Birbaumer N, Elbert T, Canavan AGM, Rockstroh B. Slow potentials of the cerebral cortex and behavior. Physiol Rev 70: 1-41, 1990.
Born J, Whipple SC, Stamm J. Potential-related events: Reaction time tasks contingent upon frontal lobe slow potential shifts. Ann N Y Acad Sci 425: 667-670, 1984.
Bosch V, Mecklinger A, Friederici AD. Slow cortical potentials during retention of object, spatial, and verbal information. Brain Res Cogn Brain Res 10: 219-237, 2001.
Busch NA, Dubois J, VanRullen R. The phase of ongoing EEG oscillations predicts visual perception. J Neurosci 29: 7869-7876, 2009.
Buzsáki G, Draguhn A. Neuronal oscillations in cortical networks. Science 304: 1926-1929, 2004.
Cheesman J, Merikle PM. Distinguishing conscious from unconscious perceptual processes.
Can J Psychol 40: 343-367, 1986.
Dehaene S, Changeux J-P. Ongoing spontaneous activity controls access to consciousness: A neuronal model for inattentional blindness. PLoS Biol 3: e141, 2005.
Dehaene S, Changeux J-P. Experimental and theoretical approaches to conscious processing.
Neuron 70: 200-227, 2011.
Dehaene S, Kerszberg M, Changeux J-P. A neuronal model of a global workspace in effortful cognitive tasks. Proc Natl Acad Sci U S A 95: 14529-14534, 1998.
Dehaene S, Lau H, Kouider S. What is consciousness, and could machines have it? Science
358: 486-492, 2017.
Dehaene S, Naccache L. Towards a cognitive neuroscience of consciousness: Basic evidence and a workspace framework. Cognition 79: 1-37, 2001.
Dehghani N, Bédard C, Cash SS, Halgren E, Destexhe A. Comparative power spectral analysis of simultaneous electroencephalographic and magnetoencephalographic recordings in humans suggests non-resistive extracellular media. J Comput Neurosci 29: 405-421, 2010.
Desender K, Van Opstal F, Hughes G, Van den Bussche E. The temporal dynamics of metacognition: Dissociating task-related activity from later metacognitive processes.
Neuropsychologia 82: 54-64, 2016.
Devrim M, Demiralp T, Kurt A, Yücesir I. Slow cortical potential shifts modulate the sensory threshold in human visual system. Neurosci Lett 270: 17-20, 1999.
Dienes Z, Altmann GTM, Kwan L, Goode A. Unconscious knowledge of artificial grammars is applied strategically. J Exp Psychol Learn Mem Cogn 21: 1322-1338, 1995.
Ergenoglu T, Demiralp T, Bayraktaroglu Z, Ergen M, Beydagi H, Uresin Y. Alpha rhythm of the EEG modulates visual detection performance in humans. Brain Res Cogn Brain Res 20: 376-383, 2004.
Faivre N, Filevich E, Solovey G, Kühn S, Blanke O. Behavioral, modeling, and electrophysiological evidence for supramodality in human metacognition. J Neurosci 38: 263-277, 2018.
ffytche DH, Zeki S. Brain activity related to the perception of illusory contours. Neuroimage
3: 104-108, 1996.
Fingelkurts AA, Fingelkurts AA, Neves CFH. Natural world physical, brain operational, and mind phenomenal space-time. Phys Life Rev 7: 195-249, 2010.
Fingelkurts AA, Fingelkurts AA, Neves CFH. Consciousness as a phenomenon in the operational architectonics of brain organization: Criticality and self-organization considerations. Chaos Solitons Fractals 55: 13-31, 2013.
Fleming SM, Huijgen J, Dolan RJ. Prefrontal contributions to metacognition in perceptual decision making. J Neurosci 32: 6117-6125, 2012.
Fox MD, Snyder AZ, Vincent JL, Raichle ME. Intrinsic fluctuations within cortical systems account for intertrial variability in human behavior. Neuron 56: 171-184, 2007.
Freeman WJ, Rogers LJ, Holmes MD, Silbergeld DL. Spatial spectral analysis of human electrocorticograms including the alpha and gamma bands. J Neurosci Methods 95: 111-121, 2000.
Haynes J-D, Driver J, Rees G. Visibility reflects dynamic changes of effective connectivity between V1 and fusiform cortex. Neuron 46: 811-821, 2005.
He BJ. Scale-free brain activity: Past, present, and future. Trends Cogn Sci 18: 480-487, 2014.
He BJ, Raichle ME. The fMRI signal, slow cortical potential and consciousness. Trends Cogn Sci 13: 302-309, 2009.
He BJ, Snyder AZ, Zempel JM, Smyth MD, Raichle ME. Electrophysiological correlates of the brain’s intrinsic large-scale functional architecture. Proc Natl Acad Sci U S A 105: 16039-16044, 2008.
Helfrich RF, Schneider TR, Rach S, Trautmann-Lengsfeld SA, Engel AK, Herrmann CS. Entrainment of brain oscillations by transcranial alternating current stimulation. Curr Biol
24: 333-339, 2014.
Hennighausen E, Heil M, Rösler F. A correction method for DC drift artifacts.
Electroencephalogr Clin Neurophysiol 86: 199-204, 1993.
Hesselmann G, Kell CA, Eger E, Kleinschmidt A. Spontaneous local variations in ongoing neural activity bias perceptual decisions. Proc Natl Acad Sci U S A 105: 10984-10989, 2008a.
Hesselmann G, Kell CA, Kleinschmidt A. Ongoing activity fluctuations in hMT+ bias the perception of coherent visual motion. J Neurosci 28: 14481-14485, 2008b.
Hipp JF, Siegel M. Dissociating neuronal gamma-band activity from cranial and ocular muscle activity in EEG. Front Hum Neurosci 7: 338, 2013.
Jachs B, Blanco MJ, Grantham-Hill S, Soto D. On the independence of visual awareness and metacognition: A signal detection theoretic analysis. J Exp Psychol Hum Percept Perform
Jung T-P, Makeig S, Humphries C, Lee T-W, McKeown MJ, Iragui V, Sejnowski TJ. Removing electroencephalographic artifacts by blind source separation. Psychophysiology 37: 163-178, 2000.
Koivisto M, Lähteenmäki M, Sørensen TA, Vangkilde S, Overgaard M, Revonsuo A. The earliest electrophysiological correlate of visual awareness? Brain Cogn 66: 91-103, 2008.
Koivisto M, Revonsuo A. An ERP study of change detection, change blindness, and visual awareness. Psychophysiology 40: 423-429, 2003.
Koivisto M, Revonsuo A, Salminen N. Independence of visual awareness from attention at early processing stages. Neuroreport 16: 817-821, 2005.
Lamy D, Salti M, Bar-Haim Y. Neural correlates of subjective awareness and unconscious processing: An ERP study. J Cogn Neurosci 21: 1435-1446, 2009.
Li Q, Hill Z, He BJ. Spatiotemporal dissociation of brain activity underlying subjective awareness, objective performance and confidence. J Neurosci 34: 4382-4395, 2014.
Linkenkaer-Hansen K, Nikulin VV, Palva S, Ilmoniemi RJ, Palva JM. Prestimulus oscillations enhance psychophysical performance in humans. J Neurosci 24: 10186-10190, 2004.
Maniscalco B, Lau H. A signal detection theoretic approach for estimating metacognitive sensitivity from confidence ratings. Conscious Cogn 21: 422-430, 2012.
Mathewson KE, Gratton G, Fabiani M, Beck DM, Ro T. To see or not to see: Prestimulus α phase predicts visual awareness. J Neurosci 29: 2725-2732, 2009.
Mitzdorf U. Current source-density method and application in cat cerebral cortex: Investigation of evoked potentials and EEG phenomena. Physiol Rev 65: 37-100, 1985.
Monto S, Palva S, Voipio J, Palva JM. Very slow EEG fluctuations predict the dynamics of stimulus detection and oscillation amplitudes in humans. J Neurosci 28: 8268-8272, 2008.
Northoff G. What the brain’s intrinsic activity can tell us about consciousness? A tri-dimensional view. Neurosci Biobehav Rev 37: 726-738, 2013.
Northoff G. “Paradox of slow frequencies” - Are slow frequencies in upper cortical layers a neural predisposition of the level/state of consciousness (NPC)? Conscious Cogn 54: 20-35, 2017.
Northoff G, Huang Z. How do the brain’s time and space mediate consciousness and its different dimensions? Temporo-spatial theory of consciousness (TTC). Neurosci Biobehav Rev 80: 630-645, 2017.
Oizumi M, Albantakis L, Tononi G. From the phenomenology to the mechanisms of consciousness: Integrated information theory 3.0. PLoS Comput Biol 10: e1003588, 2014.
Ojanen V, Revonsuo A, Sams M. Visual awareness of low-contrast stimuli is reflected in event-related brain potentials. Psychophysiology 40: 192-197, 2003.
Oostenveld R, Fries P, Maris E, Schoffelen J-M. FieldTrip: Open source software for advanced analysis of MEG, EEG, and invasive electrophysiological data. Comput Intell Neurosci 2011: 156869, 2011.
Page EB. Ordered hypotheses for multiple treatments: A significance test for linear ranks. J Am Stat Assoc 58: 216-230, 1963.
Pun C, Emrich SM, Wilson KE, Stergiopoulos E, Ferber S. In and out of consciousness: Sustained electrophysiological activity reflects individual differences in perceptual awareness.
Psychon Bull Rev 19: 429-435, 2012.
Raichle ME. Two views of brain function. Trends Cogn Sci 14: 180-190, 2010.
Raichle ME. The restless brain. Brain Connect 1: 3-12, 2011.
Raichle ME, MacLeod AM, Snyder AZ, Powers WJ, Gusnard DA, Shulman GL. A default mode of brain function. Proc Natl Acad Sci U S A 98: 676-682, 2001.
Raichle ME, Mintun MA. Brain work and brain imaging. Annu Rev Neurosci 29: 449-476, 2006.
Rutiku R, Bachmann T. Juxtaposing the real-time unfolding of subjective experience and ERP neuromarker dynamics. Conscious Cogn 54: 3-19, 2017.
Samaha J, Iemi L, Postle BR. Prestimulus alpha-band power biases visual discrimination confidence, but not accuracy. Conscious Cogn 54: 47-55, 2017.
Sandberg K, Timmermans B, Overgaard M, Cleeremans A. Measuring consciousness: Is one measure better than the other? Conscious Cogn 19: 1069-1078, 2010.
Schmitz TW, Rowley HA, Kawahara TN, Johnson SC. Neural correlates of self-evaluative accuracy after traumatic brain injury. Neuropsychologia 44: 762-773, 2006.
Schölvinck ML, Friston KJ, Rees G. The influence of spontaneous activity on stimulus processing in primary visual cortex. Neuroimage 59: 2700-2708, 2012.
Seth AK, Dienes Z, Cleeremans A, Overgaard M, Pessoa L. Measuring consciousness: Relating behavioural and neurophysiological approaches. Trends Cogn Sci 12: 314-321, 2008.
Tanner D, Morgan-Short K, Luck SJ. How inappropriate high-pass filters can produce artifactual effects and incorrect conclusions in ERP studies of language and cognition.
Psychophysiology 52: 997-1009, 2015.
Tanner D, Norton JJS, Morgan-Short K, Luck SJ. On high-pass filter artifacts (they’re real) and baseline correction (it’s a good idea) in ERP/ERMF analysis. J Neurosci Methods
266: 166-170, 2016.
Tononi G. An information integration theory of consciousness. BMC Neurosci 5: 42, 2004.
van Boxtel GJM, Böcker KBE. Cortical measures of anticipation. J Psychophysiol 18: 61-76, 2004.
Vanhatalo S, Palva JM, Holmes MD, Miller JW, Voipio J, Kaila K. Infraslow oscillations modulate excitability and interictal epileptic activity in the human cortex during sleep. Proc Natl Acad Sci U S A 101: 5053-5057, 2004.
Vanhatalo S, Voipio J, Kaila K. Full-band EEG (FbEEG): An emerging standard in electroencephalography. Clin Neurophysiol 116: 1-8, 2005.
von Stein A, Sarnthein J. Different frequencies for different scales of cortical integration: From local gamma to long range alpha/theta synchronization. Int J Psychophysiol 38: 301-313, 2000.
Wohlschläger AM, Glim S, Shao J, Draheim J, Köhler L, Lourenço S, Riedl V, Sorg C. Ongoing slow fluctuations in V1 impact on visual perception. Front Hum Neurosci 10: 411, 2016.
Yokoyama O, Miura N, Watanabe J, Takemoto A, Uchida S, Sugiura M, Horie K, Sato S, Kawashima R, Nakamura K. Right frontopolar cortex activity correlates with reliability of retrospective rating of confidence in short-term recognition memory performance. Neurosci Res 68: 199-206, 2010.
Zehetleitner M, Rausch M. Being confident without seeing: What subjective measures of visual consciousness are about. Atten Percept Psychophys 75: 1406-1426, 2013.
Zeki S, Bartels A. The asynchrony of consciousness. Proc Biol Sci 265: 1583-1585, 1998.
Zeki S, ffytche DH. The Riddoch syndrome: Insights into the neurobiology of conscious vision. Brain 121: 25-45, 1998.
3
Project II:
Phase-Amplitude Coupling of Neural Oscillations can
be Effectively Probed with Concurrent TMS-EEG
The current chapter depicts a research article entitled “Phase-amplitude coupling of neural oscillations can be effectively probed with concurrent TMS-EEG”. The article is authored by Sarah Glim, Yuka O. Okazaki, Yumi Nakagawa, Yuji Mizuno, Takashi Hanakawa, and Keiichi Kitajo and has been submitted for publication. In the presented research project, concurrent TMS-EEG was used to demonstrate that both single-pulse TMS (sTMS) and repetitive TMS (rTMS) can transiently enhance the macroscopic phase-amplitude coupling of neural oscillations, presumably by synchronizing underlying neural oscillators. It was concluded that TMS-EEG constitutes an effective experimental technique to probe intrinsic phase-amplitude coupling in humans.
Contributions
Phase-amplitude coupling of neural oscillations can be effectively
probed with concurrent TMS-EEG
Sarah Glim1,2,3, Yuka O. Okazaki1, Yumi Nakagawa1, Yuji Mizuno1,4,
Takashi Hanakawa1,4, Keiichi Kitajo1,4,*
1
RIKEN BSI-TOYOTA Collaboration Center, RIKEN Brain Science Institute, Wako, Japan;
2
Department of Neuroradiology, Technische Universität München, Munich, Germany;
3
Abstract
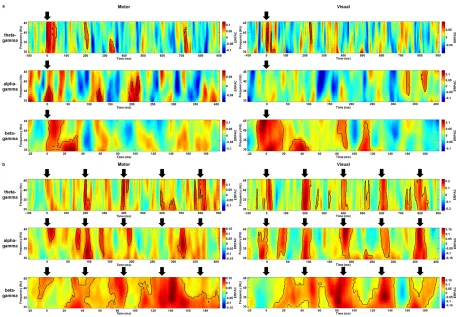
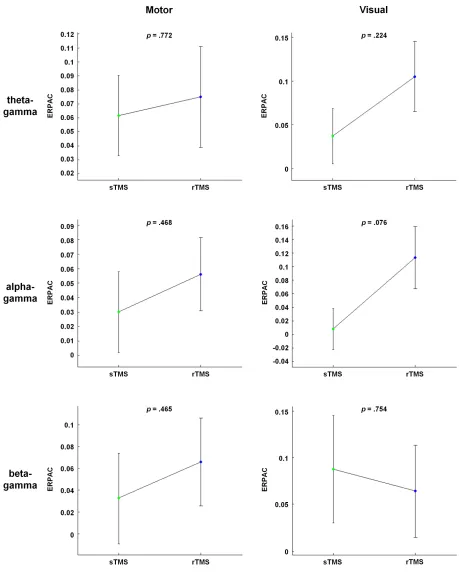
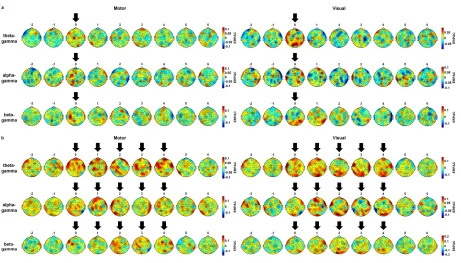
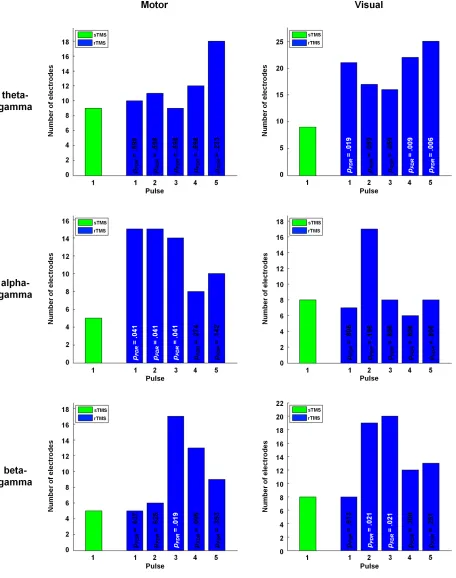
Despite the widespread use of transcranial magnetic stimulation (TMS), knowledge of its neurophysiological mode of action is still incomplete. Recently, TMS has been proposed to synchronise neural oscillators, and to thereby increase the detectability of corresponding oscillations at the population level. As oscillations in the human brain are known to interact within nested hierarchies via phase-amplitude coupling, TMS might also be able to increase the macroscopic detectability of such coupling. In a concurrent TMS-electroencephalography study, we therefore examined the technique’s influence on theta-gamma, alpha-gamma and beta-gamma phase-amplitude coupling by delivering single-pulse TMS (sTMS) and repetitive TMS (rTMS) over the left motor cortex and right visual cortex of healthy participants. The rTMS pulse trains were of 5 Hz, 11 Hz and 23 Hz for the three coupling variations, respectively. Relative to sham stimulation, all conditions showed transient but significant increases in phase-amplitude coupling at the stimulation site. In addition, we observed enhanced coupling over various other cortical sites, with a more extensive propagation during rTMS than during sTMS. By indicating that scalp-recorded phase-amplitude coupling can be effectively probed with TMS, these findings open the door to the technique’s application in manipulative dissections of such coupling during human cognition and behaviour.
Introduction
Over the past decade, interest has arisen in the effects of TMS on macroscopic neural oscillations, as measured with non-invasive recording techniques such as electroencephalography (EEG)10,11,12,13,14. In this context, Kawasaki and colleagues13 demonstrated a direct modulation of the temporal dynamics of these oscillations by showing that the consistency of oscillatory phases across stimulation trials, so-called phase locking, is transiently enhanced after single-pulse TMS (sTMS). Even though this effect can occur within a wide oscillatory spectrum, sTMS is assumed to act on intrinsic neural systems, and thus to be most effective for those frequencies that arise naturally within particular cortico-thalamic modules15. Accordingly, a highly probable candidate mechanism behind the observed increase in macroscopic across-trial phase locking is the phase resetting of underlying intrinsic oscillators (but see Sauseng and colleagues16 for a critical discussion of phase locking). Considering that such resets would simultaneously pertain to a multitude of coexistent oscillators, transiently enhanced synchronisation would also unfold within stimulation trials. As Thut and colleagues12,17 argued, rhythmic stimulation via repetitive TMS (rTMS) can foster such a synchronisation through neural entrainment, during which individual oscillators start to cycle with the same period as pulses delivered at their eigenfrequency, and thus become more and more aligned to such pulses, and consequently also to each other. Interestingly, this synchronisation or alignment of coexistent neural oscillators has been argued to prevent population-level signal nullifications, and to thereby enhance the detectability of macroscopic oscillations with scalp-based measurement techniques17. Associated EEG-recorded oscillatory power increases have de facto been reported for both sTMS15,18 and rTMS12.
lies in a myriad of dynamic neural interactions that serve the integration of information across various temporal and spatial processing scales19. One promising mechanism for how such integration may be implemented in the brain is through a nested hierarchy of neural oscillations20. In particular, studies have shown that the phase of oscillations arising from slower global computations can flexibly modulate the amplitude of faster local oscillations21,22,23,24,25, a mechanism that might enable the coordination of multiple specialised processing nodes across large-scale brain networks. The functional relevance of such phase-amplitude coupling is supported by findings associating its strength with behavioural outcomes, e.g., success in a visual motion discrimination task26. Given that phase-amplitude coupling is an inherent property of neural systems, the alignment of oscillators by TMS should enhance not only the detectability of individual macroscopic oscillations, but also the detectability of their coupling to other oscillations. As this feature would greatly facilitate the investigation of phase-amplitude coupling with non-invasive measurement techniques such as scalp EEG, which often require extensive recordings to cope with only moderate signal-to-noise ratios, its clear demonstration would be of high relevance for both TMS methodologists and cognitive neuroscientists.
of healthy participants while simultaneously collecting EEG. To ensure coverage of a wide range of the oscillatory nesting observable in neural systems20,29,30, the enhancement of phase-amplitude coupling relative to sham stimulation was assessed separately for theta-gamma, alpha-gamma and beta-gamma coupling, with the rTMS frequency always equalling the frequency of the slower modulating oscillation to allow for this oscillation’s direct entrainment. The experiments were designed to evaluate the following theoretical reasoning. As enhanced oscillatory power has been reported for both sTMS15,18 and rTMS12, scalp-recorded phase-amplitude coupling should likewise be transiently enhanced for both stimulation paradigms. As both paradigms were further shown to modulate phase dynamics not only locally at the stimulation site, but also with network-wide signal propagation13,14, the enhancement of phase-amplitude coupling might likewise propagate across the cortex. Finally, we directly compared the neurophysiological effects of sTMS and rTMS by examining whether an rTMS-induced entrainment of neural oscillators can induce a locally stronger and/or globally more widespread enhancement of phase-amplitude coupling relative to sTMS.
Methods
Participants
TMS Design
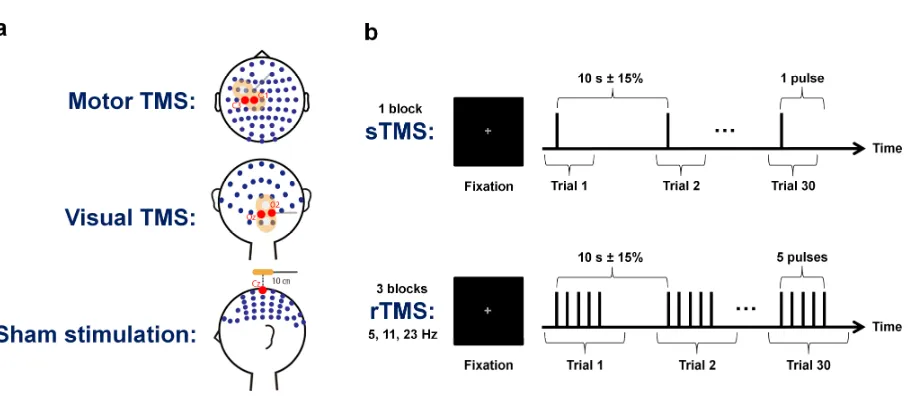
TMS pulses were delivered through a figure-of-eight coil with a 70 mm wing diameter, connected to a biphasic magnetic stimulator unit (Magstim Rapid, The Magstim Company Ltd, UK). Stimulation intensity was fixed at 90% of a participant’s active motor threshold, which was determined for the right first dorsal interosseous (FDI) muscle. During the entire experimental procedure, participants fixated on a central grey cross on a black computer monitor background and wore earplugs to reduce stimulation-evoked auditory potentials in neural activity.
An overview of the experimental design is presented in Fig. 1. Each participant received stimulation at three different sites in randomly ordered sessions. In one session, TMS was applied over the left motor cortex (approximately between electrodes C1 and C3, with the exact position being determined by the individual hotspot of the right FDI muscle stimulation; coil handle perpendicular to the central sulcus) and in a second session, it was applied over the right visual cortex (between electrodes Oz and O2; coil handle perpendicular to the midsagittal plane). In a third session, sham stimulation was delivered at a location 10 cm above the vertex of the head (electrode Cz; coil handle directed posteriorly). Each of these sessions comprised four different blocks, with each block consisting of 30 trials with inter-trial intervals of 10 s ± 15%. Depending on the block, inter-trials contained either single TMS pulses or trains of five consecutive pulses delivered at 5 Hz, 11 Hz or 23 Hz.
EEG Recording and Preprocessing
to reduce TMS-induced artefacts31. In addition, horizontal and vertical electrooculography (EOG) was recorded to monitor eye movements and blinks. All signals were sampled at a rate of 5,000 Hz, filtered online from DC to 1,000 Hz and amplified using the TMS-compatible BrainAmp MR plus system (Brain Products GmbH, Germany). Impedances were kept below 10 kΩ.
Figure 1: Experimental design. (a) The EEG electrode layout used in the present study is
displayed along with the different stimulation sites. In separate sessions, TMS was applied
over the left motor cortex (first row), over the right visual cortex (second row) and as sham
stimulation 10 cm above the vertex of the head (third row). (b) Each session contained four
blocks of 30 trials each, in which we performed sTMS (first row) as well as 5 Hz, 11 Hz and
23 Hz rTMS (second row). During rTMS trials, stimulation was delivered in trains of five
consecutive pulses.