Inaugural-Dissertation
zur Erlangung des Grades
Doctor oeconomiae publicae (Dr. oec. publ.)
an der Volkswirtschaftlichen Fakultät
an der Ludwig-Maximilians-Universität München
2019
vorgelegt von
Inaugural-Dissertation
zur Erlangung des Grades
Doctor oeconomiae publicae (Dr. oec. publ.)
an der Volkswirtschaftlichen Fakultät
an der Ludwig-Maximilians-Universität München
2019
vorgelegt von
Tobias Lohse
Referent:
Prof. Dr. Oliver Falck
Korreferent:
Prof. Dr. Stephan Heblich
Over the course of the past years, I have enjoyed the tremendous support of many people.
All of them deserve being acknowledged, but I can only thank a selection of them here.
If it was not for my supervisor Oliver Falck, I would not have started writing a doctoral
thesis. I am very grateful for the confidence he placed in me and the invaluable guidance he
provided. I cannot overstate how much I appreciate that, independent of his own schedule,
he always took the time to offer his advice (and a coffee) whenever I knocked on his door.
I would also like to thank Stephan Heblich for his academic support from very early on.
The indefatigableness with which he approaches new and old research questions was and
continues to be inspiring. I further thank Monika Schnitzer for her ever-astute reviews of the work produced at the ifo Institute and for completing my dissertation committee.
I am very grateful to Andreas Mazat, with whom I had the great pleasure to share an
office for more than four years. While his contributions as a coauthor and colleague were
instrumental for many parts of this dissertation, his friendship turned this endeavour into
something joyful and fun. I would also like to thank Johannes Koenen. Our discussions
and collaboration have not only shaped my academic thinking as an economist, but also profoundly enriched my life in many other ways. I have greatly enjoyed discussing
many aspects in the field of economics, especially as they relate to the development of
disadvantaged regions, with Balázs Spéder, who was never short of encouragement and
always provided an open ear when needed. I further thank Valentin Lindlacher, Robert
Lehmann, Simone Schüller, Michael Ebnet, Udo Ludwig, Barbara Grave, and many other
colleagues and friends, both present and past, for their great support throughout the
years.
Finally, yet foremost, I thank my family and my girlfriend Anne. Their unconditional
sup-port, encouragement, and patience went far beyond what I could have asked for but were the
privilege I needed.
Thank you. Sincerely.
Preface 1
1 Evaluating a Place-Based Innovation Policy: Evidence from the Innovative
Regional Growth Cores Programme in East Germany 7
1.1 Introduction . . . 7
1.2 The IRGC Programme . . . 9
1.2.1 Institutional Background . . . 9
1.2.2 Conceptual Framework . . . 11
1.2.3 Outline of the Evaluation Approach . . . 13
1.3 Firm-Level Analysis . . . 15
1.3.1 Data . . . 15
1.3.2 Direct Effects . . . 17
1.3.3 Indirect Effects . . . 25
1.4 Regional-Level Analysis . . . 32
1.4.1 Data . . . 32
1.4.2 Event Study Analysis – Testing the DiD Assumptions . . . 34
1.4.3 Estimated Aggregate Treatment Effects . . . 38
1.5 Discussion and Conclusions . . . 39
2 Next Generation Access Networks: Very High-Speed Internet and Regional Employment in Germany 41 2.1 Introduction . . . 41
2.2 Architecture of NGA Networks: A Brief Overview . . . 44
2.3 Empirical Framework and Identification Strategy . . . 46
2.3.1 Hypotheses, Baseline Specification, and Endogeneity Concerns . . . . 46
2.3.2 Minimum Spanning Trees and Identifying Variation . . . 49
2.4 Data . . . 52
2.4.1 Diffusion of NGA Networks in Germany between 2011 and 2016 . . . . 52
2.4.2 Labour Market Outcomes and Regional Control Variables . . . 55
2.6 Summary and Conclusions . . . 65
3 Online Shopping and Retail Employment: Evidence from Brick-and-Mortar Bookstores 67 3.1 Introduction . . . 67
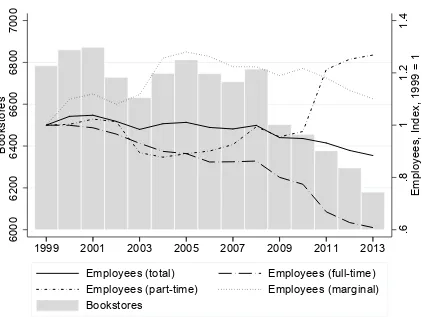
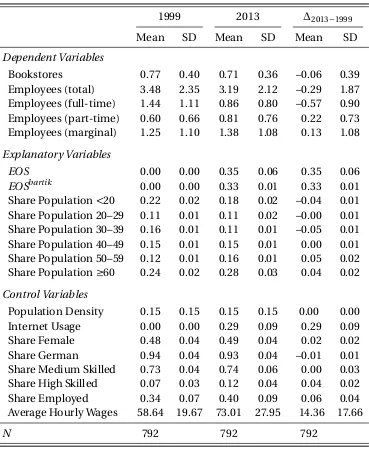
3.2 The German Book Market Between 1999 and 2013 . . . 70
3.3 Data . . . 73
3.3.1 Geomarketing Information . . . 73
3.3.2 Administrative Data . . . 75
3.4 Empirical Framework . . . 78
3.4.1 Baseline Specification . . . 78
3.4.2 Identification . . . 80
3.5 Results . . . 85
3.5.1 Baseline OLS and IV Results . . . 85
3.5.2 Robustness and Heterogeneity . . . 88
3.6 Summary and Conclusions . . . 93
Appendices 95 A Appendix to Chapter 1 96 A.1 Additional Programme Details . . . 96
A.2 Estimating the Number of Factors . . . 97
A.3 Additional Figures . . . 98
A.4 Additional Tables . . . 100
B Appendix to Chapter 2 105 B.1 Additional Figures . . . 105
B.2 Additional Tables . . . 108
C Appendix to Chapter 3 113 C.1 Additional Figures . . . 113
C.2 Additional Tables . . . 115
List of Figures 116
List of Tables 118
Over the past century, it has become a political paradigm that public interventions can
promote economic growth in disadvantaged areas and pave the way for regional cohesion.
Already during the aftermath of the Great Depression, the federal government of the United States initiated a large-scale infrastructure investment programme to support the economic
development of the Tennessee valley [Kline and Moretti, 2014a]. In the second half of the
20th century, many European countries followed suit and established ambitious place-based
policies of their own. Among the most prominent examples are theZonenrandgebiet-policy
in Germany [von Ehrlich and Seidel, 2018] and the Regional Selective Assistance programme
in the United Kingdom [Criscuolo et al., 2018].
Because regional prosperity continues to differ vastly [Rosés and Wolf, 2018], spatially
targeted initiatives have become an integral part of the policy toolkit in most developed
countries. In the United States, the federal government spends more than 15 billion Dollars
per year on programmes explicitly targeting specific regions [United States Government
Accountability Office, 2012]. The regional policies conducted by the EU account for annual
investments of approximately 50 billion Euros, that is, a third of its entire budget.1
Despite the long-standing interest of policy makers and economists in regional
development programmes, empirical tests of whether place-based policies indeed promote
economic growth have often faced substantial difficulties. Beyond the limited availability
of data, the absence of suitable evaluation methods presented a pivotal challenge for
decades. This only changed during the early 1990s when seminal advances in the
econometrics of programme evaluation provided a framework for systematic investigations
of causal relationships in the social sciences [Imbens and Wooldridge, 2009]. In combination with improved data availability, these methodological developments gave rise
to a burgeoning literature in the field of regional and urban economics that studies the effectiveness of targeted infrastructure investment programmes and other types of
place-based policies.
1 The EU provides funding for regional policies through the European Regional Development Fund
Often focussing on labour market outcomes, these evaluations show that only some
place-based policies successfully create local jobs whereas others failed to boost local
employment.2Depending on the programme considered, additionally created jobs come at
varying costs [Busso et al., 2013; Criscuolo et al., 2018] and do not always persist beyond the
end of the regional support programme [Becker et al., 2018]. Furthermore, even if targeted
places experience a sustained increase in local employment, these improvements may come
at the expense of other areas [Kline and Moretti, 2014a].
While these studies have made significant contributions to an improved understanding
of the labour market effects of place-based interventions, the evidence base on other aspects
addressed by these policies continuous to be a lot more fragmental. For example, it remains
an open question whether positive labour market effects induced by a specific place-based
intervention also translate into improved living conditions for the residents. As economic
support for regions is typically motivated by the normative objective to help specific groups
of people rather than specific geographic areas, answering this question is crucial for many place-based interventions.
Studying this question theoretically, Glaeser and Gottlieb [2008], Kline [2010] and Kline
and Moretti [2014a] introduce the idea of place-based policies in the framework of spatial
equilibrium models.3They show that subsidies confined to specific areas only feed through
to the local population if housing supply is elastic and the mobility of workers (or firms)
across regions is limited. However, if housing is scarce and mobility sufficiently cheap,
the benefits of the subsidies will be entirely absorbed by increases in local rents [Kline and
Moretti, 2014b].
Beyond pursuing equity-based motives, spatially targeted interventions may also seek to
counteract localised market failures. For instance, a lack of regional economic capacity can
aggravate the public goods problem associated with the provision of suitable infrastructures
(e.g., because low levels of local tax revenues prohibit necessary infrastructure investments).
In a similar vein, using public subsidies to attract large manufacturing firms to specific regions can constitute an important policy tool to internalise the productivity externalities
generated by agglomeration [Greenstone et al., 2010].4
Considering the plurality of objectives that many place-based interventions (ex- or
implicitly) motivate, evaluating these policies along multiple dimensions is essential to
better understand their effectiveness. Furthermore, more comprehensive evaluations may
2 For more details, see, for example, the evidence reviews on area based initiatives and transport infrastructure
investments provided by the What Works Centre for Local Economic Growth [2015c, 2016].
3 The ideas for these models go back to some of the earliest works in the field, i.e., Alonso [1964], Rosen [1979],
and Roback [1982].
4 For a comprehensive review of potential market failures motivating place-based policies, see Kline and
also reveal through which mechanisms place-based interventions operate and, thereby,
enable the design of better policies in the future. Building on these insights, this dissertation
makes three contributions to the literature investigating the economic effects of (targeted)
infrastructure investments and place-based policies.
In the first chapter, Oliver Falck, Johannes Koenen, and I evaluate the effects of one of
the largest place-based innovation policies in Germany – the Innovative Regional Growth
Cores (IRGC) programme. In contrast to many other place-based policies, the IRGC does
not directly support the development of physical infrastructures like roads or research
facilities. Instead, it provides targeted subsidies for collaborative research and development
projects at the firm level in Eastern Germany. If these collaborations are successful, they
are meant to develop into self-sustaining innovative networks that, as a specific type of
“infrastructure” necessary for innovation, generate local spillovers and promote regional economic development.
Following this narrative, the IRGC may be best thought of as a programme that does
not only seek to address market failures commonly associated with innovation at the firm
level5, but also failures of the regional innovation system more generally [Freeman, 1987;
Lundvall, 1992; Nelson and Rosenberg, 1993]. Taking the comprehensive scope of the IRGC
into account, we evaluate the effects of this programme not only along a broad range of outcomes, but also separately at the firm and regional level. Our evaluation is designed
to address three central questions: (1) Did the IRGC induce additional innovation efforts
by firms directly subsidised through the programme? (2) Did other innovative firms that
were located in the same regions, but did not receive subsidies themselves (“indirectly
treated” firms), benefit from the IRGC; that is, are there firm-level spillovers? And (3), did
the IRGC cause measurable improvements to aggregate economic outcomes at the regional
level?
Exploiting differences in the regional and temporal incidence of IRGC funding, our
empirical strategy relies on difference-in-differences (DiD) approaches. To answer the first
two questions, we compare the development of firms (directly and indirectly) treated by the
IRGC to that of other innovative firms located in Eastern German regions not targeted by
the programme (control group). For the firm-level analysis, we are among the first to use
confidential survey data covering an extensive sample of innovative firms in Germany. At
the regional level, we introduce interactive fixed effects in a DiD framework to compare
aggregate economic outcomes in treated and non-treated areas [Bai, 2009; Gobillon and
Magnac, 2016].
5 In particular, the externalities of knowledge creation first described by Arrow [1962] and Spence [1984], or
We find that firms directly receiving IRGC subsidies have significantly increased their
innovative activity. As to indirect and aggregate effects, the empirical evidence does not
support the notion that the IRGC affected other innovative firms located in the same regions
or prosperity at the regional level. While the point estimates for the second and third
question are statistically insignificant, which may be due to relatively low statistical power,
they are also “small” with regard to their economic importance. Even subject to the caveat, that we cannot interpret the statistical absence of proof as proof of absence of any economic
effects, these results raise questions whether the IRGC provides an effective means to address
the market failures that motivated it.
While the IRGC uses a very broad definition of the term infrastructure, the second
chapter of this dissertation considers the economic effects of an infrastructure in the
classical sense: the Next Generation Access (NGA) networks used for the provision of very high-speed Internet. Over the past two decades, it has often been argued that access to
very high-speed Internet constitutes a pre-requisite for regional economic development.
According to three ministers of the federal government in Germany, for example, a fast
Internet connection is an amenity as important as fresh water or electricity.6
However, installing NGA networks that can provide all German households with speeds
of at least 50 MBit/s is estimated to cost more than 20 billion Euros [TÜV Rheinland Consulting GmbH, 2013]. As the private provision of these investments might be subject to
market failures7, better understanding their importance for regional economic development
is of crucial interest. In this chapter, I therefore investigate whether and how the availability
of NGA networks affects local employment in the short run. Although local labour
market effects only reflect some of the determinants motivating the (publicly subsidised)
development of broadband infrastructures, they may provide an important benchmark for
policy makers who must decide on local infrastructure investments.
As access to very high-speed Internet can enable the uptake or development of
technologies that can both complement and substitute local labour inputs, the sign of its
aggregate effect is not clear ex ante. Focussing on a sample of relatively rural areas in
Germany between 2011 and 2016, I find no empirical evidence that NGA network availability
affects the employment rate in the short run. With respect to the share of employees
living in a municipality, however, my results indicate that increasing the availability of NGA
networks by 5 percentage points leads to an increase in the number of people living (but
not necessarily also working) by 0.09 percentage points. Taken together, NGA network
6
https://www.zeit.de/wirtschaft/2018-11/digitalisierung-katarina-barley-hubertus-heil-olaf-scholz, last accessed: 16 March 2019.
7 Concerns frequently associated with the roll-out of NGA networks are discussed in the introduction of
availability does not seem to be an important determinant for the creation (or destruction)
of local jobs, but affects employed individuals in their decision where to live.
This study is not only among the first to investigate the causal effects of NGA network availability, but also proposes a novel identification strategy. The idea for this strategy is
based on the observation that most of the technologies currently used to provide speeds
of at least 50 MBit/s require the installation of local optical fibre networks that serve
specific access points in the streets. From these access points, signal transmission to and
from the customers is realised via pre-existing networks such as the copper wires of the
public switched telephone network or the coaxial cables of the TV network. As the
roll-out of optical fibre cables in Germany is costly (i.e., because they are typically installed
subsurface), installing these optical fibre networks represents the most important obstacle
to the provision of NGA networks.
This technical peculiarity can be exploited to identify the causal effects of NGA network
diffusion. By taking advantage of detailed geographic information on local land use and
methods from graph theory, I approximate the locations of these access points and construct
hypothetical networks that minimise the total length of cables required to connect them.
The total length of the optical fibre cables required for these hypothetical networks denotes a
cost measure for local NGA network roll-out that is solely affected by the spatial dispersion of settlement structures but not any other, potentially endogenous, factors. In an instrumental
variables framework, I explain the regional diffusion of NGA network availability over time
as a function of network cost (i.e., cable length) while simultaneously controlling for network
size (i.e., the number of access points).
Although the benefits promised by the development of new infrastructures are often in
the focus of the political debate, they may also have unintended consequences. In the third
and final chapter of this dissertation, Andreas Mazat, Bastian Stockinger, and I therefore evaluate how online shopping, a retail channel only enabled by the diffusion of the Internet,
has affected the development of brick-and-mortar bookstores in Germany between 1999 and
2013. By investigating this question, we contribute to a better understanding of whether and
how e-commerce has shaped the stationary retail industry and the structure of cities more
generally.
We focus on the book market in Germany because a specific regulation (the
Buchpreisbindungsgesetz) prohibits sellers of books to end customers to differentiate prices between retail channels. This institutional setting allows us to identify how the availability
of a convenient distribution channel affects traditional retailers. While online shopping may
also affect stationary retailers through other channels (e.g., price competition, differences in
product portfolios, transparency, etc.), the convenience channel is of interest as it applies to
For our empirical analysis, we combine administrative records from social insurance
with novel geomarketing information on regional shopping behaviour at the retail market
level. Employing a long difference approach, we explain retail market-specific changes in the
number of local brick-and-mortar bookstores (and the employment therein) as a function of
changes in online shopping. To identify causal effects, we instrument the long-run change
in online shopping by a Bartik-type instrumental variable that exploits historic differences in local age structures [Bartik, 1991].
Our results indicate that regional exposure to online shopping has negative effects on
brick-and-mortar bookstores. For example, relative to the levels in 1999, an increase in
online shopping exposure by one standard deviation reduces the number of traditional
bookstores and total employment therein by on average 14% and 13%, respectively. As
stationary retailers represent an important part of urban structures, these results are important for urban planners as they highlight some of the challenges that city centres and
high streets may face in the future.
Although all chapters of this dissertation contribute to the same strand of the literature
in the field of regional and urban economics, they are self-contained and can be read
Evaluating a Place-Based Innovation Policy:
Evidence from the Innovative Regional Growth
Cores Programme in East Germany
*
1.1 Introduction
How can economic growth be promoted in disadvantaged areas? Finding answers to this
question is not only pivotal to local policy makers, but also a matter of national and
international relevance. For example, the European Union spends more than a third
of its budget on social and economic cohesion policies promoting the development of
structurally weaker regions. In Germany, the aim of providing similar living conditions
throughout the country is even enshrined in the constitution. Although reducing regional disparities is an objective of many countries and institutions, the approaches taken toward
its implementation differ considerably.
A growing literature in the fields of regional science and urban economics is devoted to
determining which types of place-based policies are actually effective. Ex-post evaluations
of prominent schemes in the United States and Europe, as well as related theoretical
contributions, have improved our understanding of whether and how these programmes
affect the local economy.1Our study analyses a particular type of place-based policy, i.e., an
innovation programme. Focusing on innovation as a driver of regional development [Romer,
1990; Aghion and Howitt, 1992] has recently (re-)gained substantial political traction, but so
* This chapter is based on joint work with Oliver Falck and Johannes Koenen.
1 This includes Busso et al. [2013], Kline and Moretti [2014a], Gobillon et al. [2012], von Ehrlich and Seidel
far little robust empirical evidence exists in this area with the exception of cluster policies.2 In Germany, a number of high-level place-based innovation policies have been initiated
recently or are planned in the immediate future. For instance, the Federal Ministry of
Education and Research (BMBF) has just established the framework programme “Innovation
and Structural Transformation” to bundle its efforts in using innovation policies as an explicit
tool for regional economic development. Since the empirical evidence on the effectiveness and efficiency of place-based innovation policies is still scant, we contribute to this literature
by evaluating the effects of the Innovative Regional Growth Cores programme (IRGC).
The IRGC is one of the largest place-based innovation policies in Germany. It provides
subsidies for collaborative innovation projects of private firms and public research institutes
in East Germany. Through its focus on innovation, it complements other public funding
channels for regional development in East Germany. Therefore, it is important to control for this backdrop of other public funding schemes when evaluating the effects of the IRGC.
To better understand the underlying mechanisms and differentiate between individual
channels of this policy, especially the role of spillovers, our evaluation is designed to
address three central questions: (1) Did the IRGC induce additional innovation efforts
by firms directly subsidised through the programme? With regard to this question, our
analysis of the IRGC is very close to Bertamino et al. [2017], who consider the Technology
Districts programme in Italy, as well as other studies that investigate the causal effects of an
innovation subsidy on directly treated firms.
However, we go further in that we also consider two other questions: (2) Did other
innovative firms that were located in the same regions, but did not receive subsidies
themselves (“indirectly treated” firms), benefit from the IRGC; that is, are there
firm-level spillovers? And (3), did the IRGC cause measurable improvements to aggregate
economic outcomes at the regional level? Positive externalities are an important factor in the
underlying rationale both for place-based policies as well as for innovation subsidies. Taking
this into account, the IRGC could affect firm- and regional-level outcomes through multiple channels. Therefore, answering the latter two questions provides a more differentiated and
comprehensive analysis of the true effects of the IRGC.
Our estimation strategy relies on difference-in-differences (DiD) approaches. At the
firm level, the development of firms (directly and indirectly) treated by the IRGC is
compared to the development of similar innovative firms located in East German regions
not targeted by the programme. For this analysis, we use extensive survey micro-data
covering R&D conducting firms in Germany since 1995. For our regional analysis, we compare developments of aggregate economic outcomes in treated and non-treated areas.
Along all steps of our analysis, we address endogeneity concerns by introducing appropriate
fixed effects and controls; at the regional level, we employ an interactive fixed effects (IFE)
specification. For each step, we conduct a series of event study estimations that demonstrate
empirically under which conditions our chosen specifications are valid.
We find that firms directly receiving IRGC subsidies have significantly increased their
R&D activity. As to indirect effects, the empirical evidence does not support the notion that
the IRGC affected other innovative firms located in the same regions. Finally, there is no
measurable effect on a set of indicators for regional prosperity. In addition to their lack of
statistical significance, which could be due to relative imprecision, the point estimates for
the second and third question are also “small” with regard to their economic importance.
Even subject to the caveat, that we cannot interpret the absence of statistical proof as proof
of absence of any economic effects, this raises some questions to the underlying rationale
behind the regional development-aspects of the IRGC. Given the increasing relevance of place-based innovation policies, this issue requires further study and more detailed
attention.
The paper proceeds as follows: In Section 1.2, we introduce the IRGC in detail and
develop a conceptual framework for our evaluation that is based on the related literature.
Section 1.3 describes the comprehensive survey data and presents the firm-level analysis.
Section 1.4 focuses on the regional-level analysis featuring the IFE-approach. Section 1.5 concludes.
1.2 The IRGC Programme
1.2.1 Institutional Background
The IRGC is the flagship programme of a series of innovation policies carried out within the
BMBF’s “Entrepreneurial Regions” (ER) initiative in East Germany. The guiding principle of
all ER policies is to overcome structural weaknesses in East German regions by “improv[ing]
the framework conditions for innovative processes” [BMBF, 2016a]. In contrast to most
other place-based policies in Germany, the ER initiative does not promote this objective
by subsidising private or public capital investments in general but by explicitly supporting
collaborative innovation projects within given regions.3
Implementing this principle, the BMBF established the IRGC in 2001 and began to issue
its last wave of funding in 2017. The premise underlying the IRGC is that regions possess
“unique competences [that] could for example be the command of certain technologies
or applications or a specific way of processing materials. [Often, these] are based on long
3 See, e.g., the Zonenrandgebietsförderung, the Gemeinschaftsaufgabe “Verbesserung der regionalen
Wirtschaftsstruktur”(GRW), and the European Regional Development Funds (ERDF) for programmes
regional traditions and are anchored in companies and research institutes or patented”
[BMBF, 2016c]. Building on this premise, the IRGC supports regional collaborations between
“businesses, universities and research institutes, which either already possess a joint,
specific platform technology or have the potential to develop one, [and pursue a]
market-oriented strategy [...] aimed at developing innovative, economically successful products in
the long run” [BMBF, 2016c]. For example in Rostock, a former stronghold of the German
ship-building industry, the IRGC supports the development of new tanks and ships for the
transport and storage of cryogenic gases.4Based on comparable manufacturing traditions, a
growth core developing new solutions for technical textiles has been established in Chemnitz
– the historical centre of Germany’s textile industries.5 Focusing on development and
commercialisation projects rather than basic research, these grants are meant to provide the
starting point for a cluster process that can eventually increase regional value creation.
In principle, all companies and public research institutes (including universities) that
have a joint platform technology and are based in the same East German region are eligible
to apply. Despite the IRGC’s focus on regions, the geographic boundaries of the term “region”
are not explicitly defined within the programme. Based on the observed existing projects and
the wider documentation of the IRGC, in the context of our evaluation we define regions
according to so-called regional labour markets (RLMs).6 To allocate funding, the BMBF
has designed an elaborate application process intended to ensure the quality of selected
projects.7 This application process does not involve explicit measurable selection criteria
that are publicly observable (either ex anteorex post). Instead, the BMBF announces the
winning projects without providing any information on unsuccessful contestants. Similar
selection approaches are also used for a wide range of other innovation policies in Germany
– especially within the ER framework.
In our analysis of the IRGC, we consider the first 13 of 15 waves of the programme and
include all 54 joint research projects that were started between 2001 and 2013.8Within these
first 13 waves, the IRGC granted a total of 275.6 million Euros (EUR), implying an average grant of roughly 6.3 million EUR per project (see Figure 1.2.1 for a map of East German
regions with at least one IRGC project and Figure 1.2.2 for a timeline of all projects). On
average, a supported private firm (i.e., not a public research institute) received 330,000 EUR
in subsidies.
4 http://www.unternehmen-region.de/de/1743.php, last accessed: 17 March 2019.
5 http://www.unternehmen-region.de/de/1034.phpandhttp://www.malitec.org/, last
accessed: 17 March 2019.
6 See Appendix A.1 for a detailed discussion of this issue. 7 See Appendix A.1 for more details on the application process.
8 Among these 54 projects, we also include the eleven projects that are continuations of projects started in
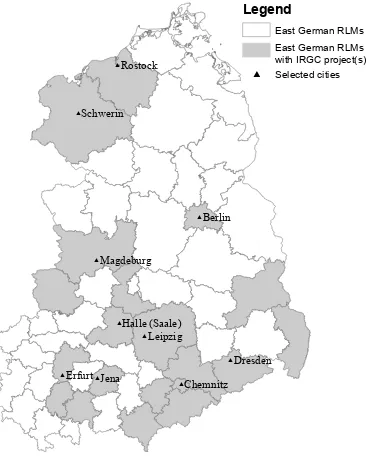
Figure 1.2.1: IRGC Treated Regions # # # # # # # # # # Chemnitz Schwerin Rostock Halle (Saale) Magdeburg
ErfurtJena Dresden
Berlin
Leipzig
East German RLMs East German RLMs with IRGC project(s)
# Legend
Selected cities
Figure 1.2.2: Timing of IRGC Grants
Berlin Cottbus Rostock Schwerin Chemnitz Erzgebirgskreis Mittelsachsen Vogtlandkreis Zwickau Dresden Görlitz Leipzig Halle (Saale) Magdeburg Anhalt-Bitterfeld Harz Erfurt Jena Arnstadt/Illmenau Saalfeld
2 1 1 2 1
1
1 1 2 1 2
1 1 1 1 1 1 1
1 1 1
1 1
1 1 1 1 1
1 1
1 1
1 1
1 1
1 1 1 1
1 1 1
1 1 1 1
1 1 1
2001 2003 2005 2007 2009 2011 2013 Year
Note: This map illustrates the geographic distribution of IRGC funding in the RLMs of East Germany. Grey shaded regions indicate RLMs that were “core regions” of at least one IRGC project between 2001 and 2013.
Note: This graph shows the timing of the 54 IRGC projects started between 2001 and 2013. It vertically lists all RLMs in East Germany that were “core regions” of at least one IRGC project. The number in the grey shaded diamonds indicates how many IRGC projects were started in each region that year.
1.2.2 Conceptual Framework
The IRGC provides development and commercialisation subsidies for collaborative innovation projects between firms and research institutes. These subsidies are designed
to address the same two market failures commonly used to justify R&D subsidies and
other innovation support schemes. First, private R&D investment tends to be lower than
socially optimal since R&D activities generate externalities (e.g., in the form of spillovers)
that impede firms from fully internalizing the benefits of their own R&D efforts [Arrow, 1962;
Spence, 1984]. Second, R&D investment is inherently risky and often associated with severe
information asymmetries. Both attributes can give rise to failures in the capital markets
when they translate into financing constraints for otherwise profitable R&D projects. The
latter concern is of particular relevance for smaller and younger firms as they might not be able to draw on internal funds in the same way larger and more mature firms can [Hall
and Lerner, 2010]. Importantly for our study, these considerations also carry forward to
commercialisation undertakings since not only the success of R&D projects, but also the
demand for eventually developed products is highly uncertainex ante.
Beyond these market failures at the firm level, the IRGC also seeks to address failures
whom point out that institutional, geographic, and economic factors are crucial in shaping
knowledge flows and, hence, impact the capacity of economies to innovate. Thus, policy
interventions are not only based on market failure arguments, but also on flaws in the
institutional and economic settings relevant to innovations. For example, Bertamino et al.
[2017, p. 1828] note that public policies can also be justified “to overcome imperfections
in the innovation systems because some essential links are missing, or the linkages within them are not working well.” In fact, all ER programmes are explicitly designed to improve
the framework conditions for innovative processes.
The concept of innovation systems is an integral part of most cluster and place-based
policies.9 By concentrating innovative and economic activities in specific areas, they are
meant to generate positive externalities of agglomeration that are of importance to the
regional innovation system [Glaeser and Gottlieb, 2008]. However, externalities caused by the IRGC are not necessarily always positive. For example, if the supply of qualified
R&D workers in the regional labour pool is limited in the short run, positive employment
effects on treated firms may fail to materialise or coincide with other firms in the same
regions losing qualified employees. In this case, the net effect of the subsidy would be
to raise demand for a given set of high-skilled workers (see, e.g., the displacement effects
investigated in Einiö and Overman [2016]).
To provide an overview of the policy measures addressing possible failures of innovation
systems, it is helpful to divide them into two groups based on the degree of discretion that
is granted to decision makers. On the one hand, there are (mostly) rule-based measures
involving few if any decisions by politicians once they are in place. This first group is
comprised of programmes that are primarily designed to counteract market failures rather
than improving the innovation system in general. For example, most tax incentives for R&D
investment are, in principle, available to any firm incurring qualifying expenditures. R&D
subsidy and loan programmes that do not have demanding eligibility requirements and are
well-enough endowed fall into the same category.
On the other hand, the second group includes many large-scale (infrastructure)
investment programmes that “pick” specific industries, technologies, or locations precisely
because this is where decision makers expect to generate the greatest positive externalities.
For example, Falck et al. [2010] evaluate a large-scale cluster policy in Bavaria, the
“High-Tech-Offensive”. This policy had an explicit focus on specific technological fields and
helped improve public research infrastructure such that it could be used by (mostly
geographically close) private firms in related industries. Hausman [2017] shows that
university innovations are particularly beneficial for the local economy. In the same vein,
9 See, e.g., Chatterji et al. [2014], Kline and Moretti [2014b] and Neumark and Simpson [2015] for reviews on
the strategic establishment of new research sites, rather than simply improving existing
ones, has been shown to be an important means for regional development [Andersson et al.,
2004].
To this point, our discussion of market and system failures, as well as associated policy
responses, has primarily focused on how the IRGC might have affected innovative firms.
Focusing on these firms captures the main effects of the IRGC, but ignores the fact that
the programme can affect the local economy through other channels. For instance, the
commercialisation of new products could lead to an increase in the demand for marketing
or accounting services.10 Taking these possibilities into account, the fundamental logic
behind the IRGC might be best thought of as the one underlying location subsidies for
large manufacturers. In this context, Greenstone et al. [2010] show that attracting large
manufacturing plants can generate substantial productivity spillovers in the local economy that are not necessarily limited to innovative firms (even though this group might benefit in
particular; see, e.g., Agrawal et al. [2014] and Fons-Rosen et al. [2016]).
1.2.3 Outline of the Evaluation Approach
A comprehensive evaluation of the IRGC thus must encompass all effects that can occur
along the supply chain as well as through other regional linkages. We follow a three-pronged
evaluation approach (see Figure 1.2.3 for an illustration). The first step of our empirical
analysis is concerned with evaluating the “direct effects” of the IRGC. That is, we want to
determine whether firms directly subsidised through the IRGC undertook additional R&D
activity. We answer this question by implementing a DiD approach in which we compare the directly treated firms with innovative firms that did not receive any IRGC subsidies and
were located outside targeted regions (i.e., in the unshaded regions in Figure 1.2.1). Defining
and measuring the direct effects of the IRGC in this manner is similar to the approach taken
by other studies evaluating innovation policies.11
In the second step of our analysis, however, we go further than many previous studies
in that we also evaluate whether the IRGC had “indirect effects” on other innovative firms in treated regions. We consider firms that were based in regions with at least one IRGC
project but that did not receive subsidies themselves, and compare them to the same group
of control firms as before. Distinguishing between these two treatment definitions at the
firm level is particularly informative since localised knowledge spillovers are not merely a
by-product of the IRGC but an explicitly specified goal. Even though generating positive
10Gans and Stern [2003] provide a framework for thinking about commercialisation settings in general. 11See, e.g., Zúñiga-Vicente et al. [2014] and Becker [2015] for surveys of the literature and the What Works
Figure 1.2.3: Evaluation Strategy
IRGC Subsidies
Direct Effects
Firms w/ subsidies
Indirect Effects
Firms w/o subsidies in treated RLMs
Aggregate Effects
Firm-level Regional-level
Note: Own illustration.
externalities may be an implicit goal of most conventional R&D and business support
programmes, it is rarely made explicit along which dimension they are intended (i.e., within regions, industries, and/or classes of technology) and, consequently, how they should be
measured. In this regard, we benefit from the strong place-based focus of the IRGC in that
the relevant spillovers caused by this programme are expected to accrue within the region
that the programme is embedded in.
The third step of our empirical analysis investigates the aggregate effects of the IRGC at
the regional level. We again draw on the fact that the IRGC is designed to target regions that
are smaller than the area for which funding is available (i.e., individual RLMs rather than East Germany as a whole) and compare treated regions with non-treated ones. Our focus
on the regional dimension addresses the concern that only considering innovative firms
neglects several potentially important channels of impact, for example, effects that public
research institutes participating in the IRGC have on the local economy (e.g., via the links
considered in Hausman [2017]). This part of our evaluation is closest to the broader literature
investigating the place-based effects of subsidies for infrastructure and physical capital. For
example, Ahlfeldt and Feddersen [2018] consider the agglomeration effects of a large-scale
investment in high-speed rail infrastructure; von Ehrlich and Seidel [2018] and Dettmann
et al. [2016] evaluate two policies that provided substantial investment subsidies for firms in disadvantaged German regions. The central place-based policy scheme within Europe,
the European Structural Development Funds, is evaluated by Becker et al. [2010, 2012, 2013,
1.3 Firm-Level Analysis
1.3.1 Data
In our firm-level analysis, we are the first to use confidential survey data provided by the
Wissenschaftsstatistik of the Stifterverband (WiStat) in the area of innovation policies. On
behalf of the BMBF, WiStat has collected information on the R&D activity of innovative firms
in Germany since the early 1970s.12 WiStat aims to conduct a census of all R&D conducting
firms in every odd-numbered year. These “full-surveys” are complemented by smaller
surveys of the largest R&D conducting firms in all even-numbered years. Since participating
in WiStat’s surveys is not legally mandatory, the data available to us do not include complete
information on the entire population of innovative firms in Germany. Nevertheless, WiStat’s surveys are highly comprehensive and unique in terms of time span and detail. Designed
according to the Frascati Manual [OECD, 2002], they follow international standards and
are not only an integral part of national reporting systems in Germany (e.g., the regional
accounts), but also incorporated internationally (e.g., the EU and the OECD). Finally,
WiStat’s data are particularly suitable for our analysis as they are also the central source of
information about innovative activities for the BMBF – the institution that rolled out the
IRGC programme.
The data available to us span the years from 1995 to 2013 and include all information
WiStat collected within the full and complementary surveys during this time. They provide
information on R&D expenditures by source, R&D personnel by type, and a small selection
of general business indicators (i.e., total employment and turnover). WiStat matches the
surveyed firms with Bureau van Dijk (BvD) identifiers if possible. We use these identifiers to
merge the survey data with publicly available information on private firms participating in
the first 13 waves of the IRGC.13Among the 389 private firms in East Germany that received
IRGC grants within these waves, we are able to match 228 firms, that is, 59%. WiStat’s
firm panel is unbalanced, e.g., due to startups being added, panel attrition or general unit-and item non-response. To minimise related problems, WiStat complements the written
surveys with telephone interviews and partly relies on imputing techniques for particularly
important variables (i.e., intramural R&D expenditures and total R&D personnel).
12WiStat defines firms as the smallest part of a privately owned business enterprise that is required to provide
balance sheet information. Since there is no administrative definition of the term “innovative firm”, WiStat identifies the population of R&D conducting firms, among others, from previous R&D surveys and auxiliary variables such as a firm’s industrial classification, its size and the receipt of public R&D subsidies.
13Information on the participants of the IRGC, i.e., their treatment status, timing of treatment, and paid out
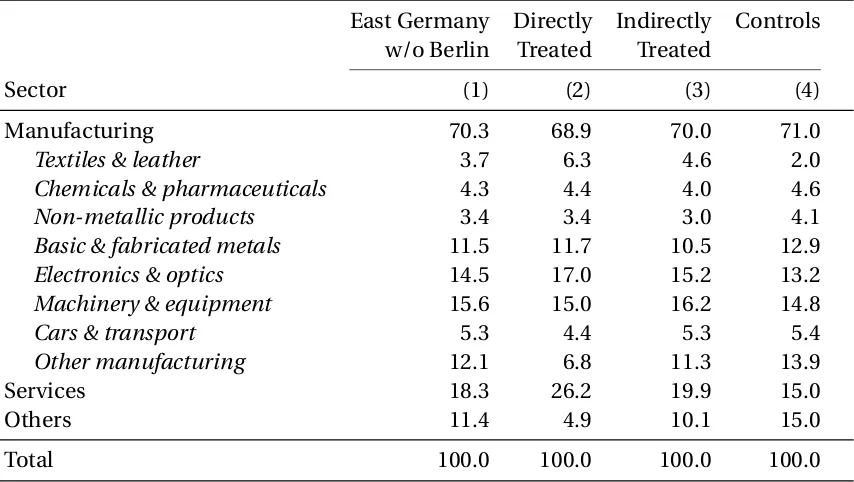
Table 1.3.1: Distribution of Firms by Industrial Sector (Percentages)
East Germany Directly Indirectly Controls
w/o Berlin Treated Treated
Sector (1) (2) (3) (4)
Manufacturing 70.3 68.9 70.0 71.0
Textiles & leather 3.7 6.3 4.6 2.0
Chemicals & pharmaceuticals 4.3 4.4 4.0 4.6
Non-metallic products 3.4 3.4 3.0 4.1
Basic & fabricated metals 11.5 11.7 10.5 12.9
Electronics & optics 14.5 17.0 15.2 13.2
Machinery & equipment 15.6 15.0 16.2 14.8
Cars & transport 5.3 4.4 5.3 5.4
Other manufacturing 12.1 6.8 11.3 13.9
Services 18.3 26.2 19.9 15.0
Others 11.4 4.9 10.1 15.0
Total 100.0 100.0 100.0 100.0
Note: This table shows the industrial distributions of innovative firms included in our sample. We distinguish between four different groups: all firms in East Germany, directly treated firms, indirectly treated firms, and the control group. For data confidentiality reasons, we subsume firms in industrial sections or divisions (printed in italic) with more than 1 but less than 5 firms observed between 1995 and 2013 in the “Others” section or the “Other manufacturing” division.
We exclude all firms with observations in less than two consecutive full surveys and
interpolate values in even-numbered years.14Furthermore, we also exclude firms located in
Berlin so as to be consistent with our regional analysis and to alleviate concerns related to the
specific industry and firm structure of Berlin (see Table A.4.1 in Appendix A.4 for details). As
mentioned above, one of the IRGC’s objectives is to foster the clustering of (innovative) firms
in targeted regions. Since actual relocations of firms are rarely observed by WiStat, however,
they pose a particular challenge for our regional analysis as their treatment exposure is highly selective. Therefore, we choose to exclude relocating firms from our analysis.
After restricting the data in this way, we have a final sample of 4,448 distinct innovative
firms in East Germany. Of these, 206 received direct subsidies within the IRGC (directly
treated). Among the firms not directly associated with the IRGC, 2,550 are located in regions
with at least one IRGC project (indirectly treated) while the remaining 1,692 firms are located
outside targeted regions (control group).
Table 1.3.1 reports the industrial distribution of innovative firms included in our sample
by treatment type and status (Columns (2) – (4)). Within the manufacturing sector (which
is the main focus of the programme), this table shows that the industrial composition of
14We also interpolate values for the few firms actually surveyed in even years as small surveys only provide
innovative firms in East Germany is very similar across treatment types and status. The close
resemblance of the industrial distribution between Columns (1) and (2), that is, between
all innovative East German firms outside Berlin and the directly treated ones, indicates
that the IRGC’s allocation mechanism did not result in a specific industry benefiting
disproportionately from the programme. Furthermore, comparing the industrial structures
between treated and non-treated regions (Columns (3) – (4)), there are also no strong differences between indirectly treated and non-treated firms. This is particularly important
for our regional analysis as it supports the assumption that non-treated regions are a suitable
control group for IRGC regions.
1.3.2 Direct Effects
1.3.2.1 Descriptives
The first step of our evaluation is to determine whether the IRGC has effectively encouraged
directly subsidised firms to undertake additional R&D that they would not have pursued otherwise. To answer this question, we employ a DiD approach in which we compare
the directly treated firms with non-treated firms residing outside targeted regions (i.e., we
compare firms in Columns (2) and (4) in Table 1.3.1).
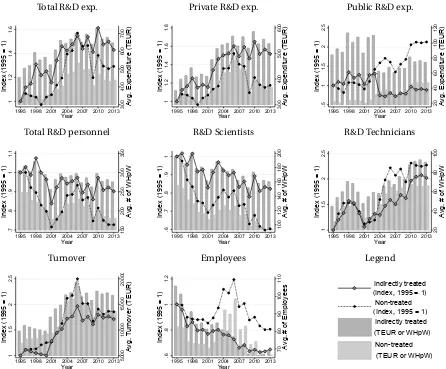
Figure 1.3.1 illustrates a simple descriptive comparison of these two groups over time.
The graphs depict the development of eight firm-level indicators for treated and non-treated
firms between 1995 and 2013: Total R&D expendituresmeasure the overall yearly volume of
expenditures classified for R&D purposes by the firm under consideration. We then further
differentiate these expenditures by source of financing. Private R&D expenditures only
include R&D spending financed from the firm’s own resources, whereas the variablepublic
R&D expendituresmeasures expenses that are financed from domestic public programmes
funded by local, state or federal governments.15 All R&D expenditures are measured in
thousand Euros (TEUR).
Total R&D personnelrepresents the overall working hours per week (WHpW) spent on R&D activities by any type of employee of the firm. We are further able to differentiate
between working hours ofscientists(tasks mainly involve scientific research) andtechnicians
(mainly applied or technical tasks, often performed under supervision of scientists). In the
WiStat surveys, working time for (groups of ) employees can be distributed across types of
tasks, e.g., an individual’s job description might involve 10% scientific and 90% technical
tasks. Turnover andemployeesare measured in TEUR and number of employed persons,
respectively.
15Note that Total R&D expenditures is not equal to the sum of private and public expenditures, as it also
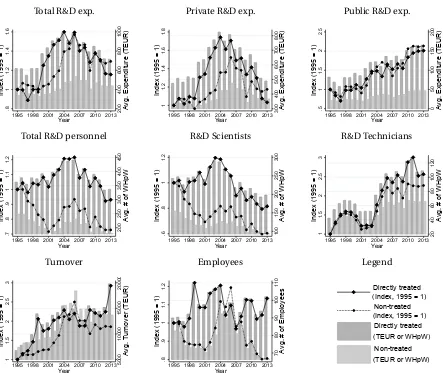
Figure 1.3.1: Descriptive Statistics – Directly Treated vs Control Firms
Total R&D exp.
.8
1
1.2
1.4
1.6
Index (1995 = 1)
200
400
600
800
1000
Avg. Expenditure (TEUR)
1995 1998 2001 2004 2007 2010 2013
Year
Private R&D exp.
1
1.2
1.4
1.6
1.8
Index (1995 = 1)
300 400 500 600 700 800
Avg. Expenditure (TEUR)
1995 1998 2001 2004 2007 2010 2013
Year
Public R&D exp.
.5
1
1.5
2
2.5
Index (1995 = 1)
0
50
100
150
200
Avg. Expenditure (TEUR)
1995 1998 2001 2004 2007 2010 2013
Year
Total R&D personnel
.7 .8 .9 1 1.1 1.2
Index (1995 = 1)
200 250 300 350 400 450
Avg. # of WHpW
1995 1998 2001 2004 2007 2010 2013
Year R&D Scientists .6 .8 1 1.2
Index (1995 = 1)
100
150
200
250
300
Avg. # of WHpW
1995 1998 2001 2004 2007 2010 2013
Year R&D Technicians 1 1.5 2 2.5 3
Index (1995 = 1)
20 40 60 80 100 120
Avg. # of WHpW
1995 1998 2001 2004 2007 2010 2013
Year Turnover 1 1.5 2 2.5 3
Index (1995 = 1)
5000
10000
15000
20000
Avg. Turnover (TEUR)
1995 1998 2001 2004 2007 2010 2013
Year Employees .8 .9 1 1.1 1.2
Index (1995 = 1)
70
80
90
100
110
Avg. # of Employees
1995 1998 2001 2004 2007 2010 2013
Year Legend Directly treated Non-treated Directly treated Non-treated (TEUR or WHpW) (Index, 1995 = 1) (Index, 1995 = 1)
(TEUR or WHpW)
Note: This figure provides a descriptive comparison of the directly treated and non-treated firms across eight different indicators: R&D expenditures by source (TEUR), R&D personnel by type (WHpW), turnover (TEUR), and the number of employees (head count). Outcome variables are interpolated in even years. The grey bars represent yearly averages (directly treated firms are depicted in dark grey to the left of non-treated ones). The connected lines show the development of these yearly averages indexed to the year 1995 (directly treated firms are denoted by black diamonds).
For each of these variables, the graphs depict both relative/indexed developments (lines)
as well as the average absolute values/levels (bars). The black diamonds and dots mark the
relative development of these indicators indexed to the levels of 1995 for both groups of
firms, respectively (left vertical axis). The grey bars plot the average level (right vertical axis;
treated firms in dark grey, non-treated ones in light grey). Figure 1.3.1 shows that the levels
of R&D activities of directly treated firms, as denoted by investments and working hours,
are approximately twice as high as in the control group. This ratio is relatively constant
across R&D expenditure categories (i.e., privately financed or paid for by public sources)
and types of R&D personnel (i.e., scientists and technicians). Note that the treated firms
As our identification strategy is based on a DiD approach, identification relies upon
variation within firms (and regions) across time rather than on differences in levels across
groups. Consequently, we are actually interested in the relative developments over time for
each group. There is no obvious divergence of the relative R&D expenditure profiles over
time. If the IRGC had large and persistent effects, one would expect this to be reflected in
the graphs post programme start in 2001. Given that the IRGC provided relatively generous subsidies, the almost parallel development of the two groups is particularly surprising with
regard to public R&D expenditures.
The relative development of R&D personnel is heterogeneous across employment types
and groups. While the WHpW of R&D technicians follow a strong and mostly parallel
upward trend in both groups, a substantial wedge develops for the total R&D personnel
and scientists, with the indices for treated firms roughly 20 percentage points higher than those of non-treated firms. Finally, average turnover and the average number of employees
develop less smoothly than the other outcome variables. With regard to turnover, treated
firms appear to outperform non-treated firms both prior to and after the financial crisis. A
similar pattern holds for their total number of employees, as well.
Thus, Figure 1.3.1 illustrates that despite the substantial differences in levels, the group
means of treated and non-treated firms behave relatively similarly over time in most cases. One caveat is that the WiStat data are unbalanced, which can make simple comparisons of
means problematic due to sample composition. Furthermore, these simple descriptives do
not take into account that the IRGC issued grants at different points in time. For example, the
group of “treated firms” in 2002 includes a high number of firms that were actually treated
in later waves. In the next section, we derive an empirical model that, among other things,
addresses both concerns and allows estimating the causal effects of the IRGC on directly
treated firms.
1.3.2.2 Event Study Analysis – Testing the DiD Assumptions
A DiD approach yields consistent estimates of the treatment effect only if treatment and
control groups would have followed common trends in the absence of treatment [Angrist
and Pischke, 2009]. The validity of this assumption is jeopardised by the same endogeneity
concerns usually associated with evaluations of innovation policies. In our context, these
include, among others, the fact that the IRGC grants decision makers wide discretion in
their subjective assessments, making the allocation of grants selective not only across firms but possibly also across regions and time. For example, decision makers could try to “pick
winners” [Cantner and Kösters, 2012] or, on the contrary, target firms in industries with
selectively targeted by the IRGC cluster in specific regions, these firm-level concerns could
translate to similar selection problems at the aggregate level.
A generalization of the DiD approach – an event study – enables us to check for divergence in pre-trends. Based on this analysis, we demonstrate empirically under which
conditions the common trends assumption is most likely to hold in our context and derive a
standard DiD model for evaluating the direct effects of the IRGC. We begin by estimating the
following two event study models:
TFE: l n(yi r t)= k X
k=k γd i r
k 1{Ki t=k}+αi+δt+²i r t (1.3.1)
TFE+LT: l n(yi r t)= k X
k=k γd i r
k 1{Ki t=k}+αi+δt+µt·1{Di>0}+²i r t, (1.3.2)
where (the natural log of ) an outcome y of firmi in RLMr and yeart is regressed on the
“standard” set of two-way fixed effects (TFE), i.e., firm αi and year δt fixed effects, as well
as a full set of indicator variables depending on “relative time” Ki t. For treated firms,Ki t
can be formally expressed asKi t =t−Di, that is, it measures the difference between year
t and the first year of treatmentDi.16 For non-treated firms,Ki t always assumes a value
of zero. Consequently, the coefficients {γd i rk }kk=k measure treatment-group specific effects
that correspond to “pre-trends” for all periodsk <0 and dynamic treatment effects for all
k≥0.17Note that if {γd i rk }−k=1k=0, this model corresponds to a standard (semi-dynamic) DiD
model. In Equation (1.3.2), we follow a common approach in the literature and augment
the usual TFE event study specification with a treatment group specific linear time trend
(LT) to account for general differences in the growth trajectories of both groups. Given the
broad scope of the IRGC, we refrain from including any additional time varying controls as
they could represent “bad controls” and, therefore, should instead be considered as separate
outcomes [Angrist and Pischke, 2009].
In a general investigation of event study designs, Borusyak and Jaravel [2017] show
that in absence of a control group, the path of {γd i rk }kk=k in Equation (1.3.1) is identified
only up to a linear component in k. Intuitively, this follows from the observation that, in
principle, adjustments in the firm and year fixed effects could offset an arbitrary linear trend
in {γd i rk }kk=kwhile still delivering the same predicted values as a model without any trend. In
our setting, we benefit from the fact that we have a relatively large control group for our direct
effects analysis (i.e., only 12% of the 1,898 firms in the sample used at this step are actually
16In case of multiple treatments, which occur rarely in the context of direct effects, we use the first treatment
year.
17In our notation,kandkdenote the two periods at the beginning and end of each sample indexed relative to
treated). This large control group should ensure that the year effects are predominantly
determined by the controls and, therefore, prevent arbitrary adjustments in the fixed effect
components.
While the size of the control group allows us to trace out the path of {γd i rk }kk
=kin Equation
(1.3.1), adding a group-specific trend re-introduces the same collinearity problems that
would occur in absence of a control group [Borusyak and Jaravel, 2017]. To solve this
problem when estimating Equation (1.3.2), we follow the authors’ suggestions and drop
a second period-specific indicator prior to treatment. While Borusyak and Jaravel [2017]
demonstrate that dropping any two k <0 is sufficient to determine non-linearities in the
pre-trends, they suggest choosing a period that is as far away from the first reference period
(k= −1) as possible. We choosek= −6 as it is the last pre-treatment period available in the
WiStat data for firms that were treated in the first wave of IRGC funding, that is, in 2001.
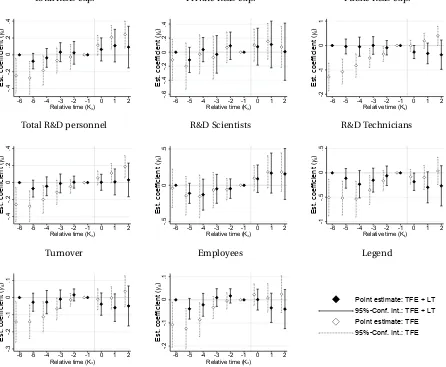
Figure 1.3.2 plots { ˆγd i rk }2k=−6 for Equations (1.3.1) and (1.3.2). Considering the TFE
estimates first (white diamonds with grey outline), there are significant pre-trends in
almost all outcome variables of interest. As this indicates that the IRGC seems to “pick
winners” in that directly treated firms grow significantly faster than firms in the control
group even before receiving treatment, simple TFE estimates likely violate the common
trends assumption. However, by estimating Equation (1.3.2), we can take advantage of the observation that many of the pre-trends in the TFE estimates are strikingly linear. After
including a treatment group-specific time trend in our event study (black diamonds), most
of the pre-treatment differences (i.e., fork<0) become considerably smaller in magnitude
and turn insignificant at the 95% significance level.18 Based on these results, we choose the
following semi-dynamic DiD model to evaluate the direct effects of the IRGC:
l n(yi r t)= k X
k=0
γd i r
k 1{Ki t=k}+αi+δt+µt·1{Di>0}+²i r t. (1.3.3)
We do not replace the set of period specific post-treatment dummies with a simple
post-treatment indicator since we expect treatment effects in the context of the IRGC to
develop dynamically over time. In fact, given that the IRGC specifies different goals in the
short and long run, a dynamic approach is per se required. Moreover, Borusyak and Jaravel
[2017] emphasise that one should not expect an immediate and persistent treatment effect
18In Table A.4.2 in Appendix A.4, we present the results of all event studies that we conducted for the direct
Figure 1.3.2: Event Studies – Directly Treated Firms
Total R&D exp.
-.4
-.2
0
.2
.4
Est. coefficient (
γit
)
0 1 2 -1 -2 -3 -4 -5 -6
Relative time (Kit)
Private R&D exp.
-.6 -.4 -.2 0 .2 .4
Est. coefficient (
γit
)
0 1 2 -1 -2 -3 -4 -5 -6
Relative time (Kit)
Public R&D exp.
-2
-1
0
1
Est. coefficient (
γit
)
0 1 2 -1 -2 -3 -4 -5 -6
Relative time (Kit)
Total R&D personnel
-.4
-.2
0
.2
.4
Est. coefficient (
γit
)
0 1 2 -1 -2 -3 -4 -5 -6
Relative time (Kit)
R&D Scientists
-.5
0
.5
Est. coefficient (
γit
)
0 1 2 -1 -2 -3 -4 -5 -6
Relative time (Kit)
R&D Technicians
-1
-.5
0
.5
Est. coefficient (
γit
)
0 1 2 -1 -2 -3 -4 -5 -6
Relative time (Kit)
Turnover -.3 -.2 -.1 0 .1
Est. coefficient (
γit
)
0 1 2 -1 -2 -3 -4 -5 -6
Relative time (Kit)
Employees
-.2
-.1
0
.1
Est. coefficient (
γit
)
0 1 2 -1 -2 -3 -4 -5 -6
Relative time (Kit)
Legend
Point estimate: TFE + LT Point estimate: TFE 95%-Conf. Int.: TFE + LT 95%-Conf. Int.: TFE
Note: This figure illustrates the results of the event study models shown in Equations (1.3.1) and (1.3.2) for {k}2−6, respectively. Outcome variables are interpolated in even years and expressed in natural logs. Values smaller than one have been replaced by one prior to taking logs. TFE estimates are denoted by white diamonds with black outline, TFE+LT estimates are depicted by black diamonds. Solid and dotted whiskers denote confidence intervals at the 95% level.
in the context of most event study analyses and, therefore, recommend using a more flexible
specification.19
To keep the presentation of our results comprehensive, the following section only shows
dynamic average treatment effects within four distinct intervals: years 0–1, years 2–3, years
4–5, and all years thereafter (years 6+). We calculate these effects as weighted averages of
the full set of estimated coefficients { ˆγd i rk }120 . In particular, we define a weighting scheme
that assigns every ˆγd i rk a weightωk according to the share of (non-missing) observations
19A common alternative to Equation (1.3.3) would include firm-specific time trends rather than a single
recorded for firms treated in periodk relative to the sum of all observations of treated firms in the relevant interval.
Formally, these weights can be defined as:
ωk=
P
i∈NPt∈T1{Ki t=k} P
i∈NPt∈TP j
j=j1{Ki t=j}
∀k∈{j,j}, (1.3.4)
whereN denotes the total number of firms,T the last year of our sample period (2013), and
{j,j} the reference interval. On the one hand, this weighting scheme allows us to reduce the
number of coefficients. On the other hand, it also both helps to account for the unbalanced
nature of our panel data as well as the differential timing of IRGC grants, which implies
that the number of observations available to estimate period-specific effects shrinks with
increasingk. Our weighting scheme helps ensure that estimated average treatment effects
are not influenced too strongly by these caveats.
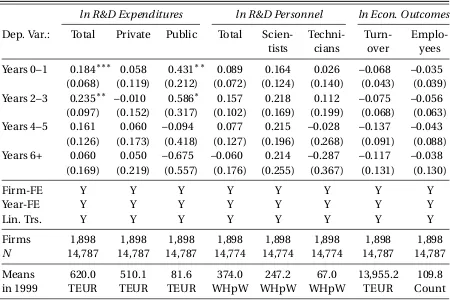
1.3.2.3 Estimated Direct Treatment Effects
Table 1.3.2 reports the dynamic treatment effects for the directly subsidised firms. Regarding
total R&D spending, we find that the IRGC induced directly treated firms to increase their
total expenditures during the first four years after treatment by between 18 and 24%. We
can quantify these effects in absolute terms to be able to compare them to the average
subsidy received. Based on the means observed in the descriptive statistics for 199920, these
relative increases would be equivalent to additional total R&D expenditures between 110 and 150 TEUR in each of these four years – compared to the calculated (overall, not yearly)
average subsidy allocated to each private firm of about 330 TEUR. While these effects are
economically and statistically significant, they do not persist beyond year 4.
Turning to the separate spending categories included in our data, we are able to
differentiate the funding channels that are responsible for the overall spending observed
between public and private funding. Again, there is a substantial positive effect on publicly
funded R&D for the first four years, but not thereafter.21 We do not observe statistically
significant effects on privately funded R&D expenditures. As a result, these findings do not
allow us to draw strong conclusions, but it is worth pointing out that most point estimates
are positive. This suggests that the IRGC did not substantially crowd out private investments
on average.
20Note that this is a conservative assumption, as average R&D expenditures were subsequently higher both for
treated and non-treated firms.
21The absolute of the public channel accounts for about one third of the overall R&D-spending effect. It has to