THE EFFECT
OF
SELECTION ON ESTERASE ALLOZYMES IN A BARLEY POPULATION1R. W. ALLARD2, A. L. KAHLER2 AND B. S. WEIR3,4
University of California, Davis, California 95616
Manuscript received December 27, 1971 Revised copy received June 26, 1972
ABSTRACT
Changes in gene and genotypic frequencies at four esterase loci were monitored over 25 generations in Composite Cross V, an experimental popu- lation of barley, to obtain experimental evidence concerning the balance of
forces responsible for: (1) the marked differences in allelic frequencies among barleys from different ecogeographical regions of the world; and (2) the extensive allelic variation found within local populations of barley. Analyses of the highly significant changes in allelic frequencies which occurred in CCV showed they were due to directional selection favoring par- ticular alleles and not to mutation, migration or genetic drift. The results show that intense balancing selection, featuring consistent excesses of heterozygotes, also occurred in CCV. I t is concluded that among the factors of neo-Darwinian evolution, natural selection plays the predominant role in determining the observed patterns of allelic variation in the barley species as a whole.
TUDIES of allozymes in the world collection of barley (Hordeum uulgm-e L.) Smaintained by the
U.
S. Department of Agriculture (KAHLER and ALLARD1970; and in preparation) have shown that there is extensive allelic variation within many of the accessions of this collection, as well as pronounced differences in allelic frequencies among barleys from different ecogeographical regions of the world. According to the neo-Darwinian theory of evolution, the kind and amount of genetic variability within and among populations is governed mainly by the combined effects of mutation, selection, migration, population size and mating system. The present investigation was undertaken to determine the relative effects of these factors on the single-locus population dynamics of four esterase loci in Composite Cross V (CCV), an experimental population of barley. The results show that balancing selection with direction of selection different for dif- ferent alleles is responsible for the changes in allelic frequencies which occurred over generations in this population, and f o r the maintenance of variability within the population. Extension of these results to the barley species as a whole leads us to the conclusion that the observed patterns of variability in this species are also due in large part to a combination of directional and balancing selection.
I Supported in part by grants from the National Institutes of Health ( G h l 104715) and from the National Science
Foundation (GB 13213) Department of Genetics
Department of Agronorny and Range Scienre
' Present address Department of Rlaihematicc, Massey Uni\ersit> Palnieiston North, New Zealand
490 R. W. ALLARD, A. L . K A H L E R A N D B. S. WEIR
MATERIALS A N D METHODS
CCV was developed by the late H. V. HARLAN and his associates by intercrossing 30 barley varieties representing all of the major barley growing regions of the world (SUNESON 1956).
In 1937 the parents were crossed in pairs and during the next three years the F, hybrids of each cycle were pair crossed to produce a single hybrid stock involving all 30 parents. This hybrid stock was planted in a plot in 1941 and allowed to reproduce by natural self pollination, giving
the
F2
generation. The F, generation was grown in 1942, the F, in 1943, and so on, from random samples of seeds taken from the harvest of the previous year. The plot was managed according to usual agricultural practice and no conscious selection was practiced at any time. However, it should be noted that, in the 25 years that CCV has been grown a t Davis, California, temperature, rainfall and many other factors of the environment have fluctuated sharply from year to year, and they have also fluctuated in longer cycles. Population size was approximately 15,000 in the earliest generations (F2, F3) but thereafter it was increased to more than 200,000 individuals/generation. We are indebted to Dr. C. A. SUNESON who, i n 1958, made available to US stored seed of the F,, F,,, and F,, generations of this population. The earliest generation for which viable seeds are still available is the F, generation.The materials studied electrophoretically were obtained from seedlings grown from random samples of seeds taken from 10 different generations of the population, including three successive early generations (F,-F,), four successive intermediate ( Fl,-F17) and three successive late
(Fz4-Fz6) generations. The seeds were germinated at 22°C in a laboratory germinator. When the seedlings were 7 days old, plumules were excised above the coleoptile, crushed in a Petri dish, and the crude squeezate absorbed on a filter paper wick. Electrophoretic techniques followed those described in detail by KAHLER and ALLARD (1970). Four loci were assayed in the present study, Esterase loci EA, EB, EC and ED, henceforth designated A, B, C and D. The A, B, and C loci are tightly linked with each other (B +- 0.0023t0.0007 4 A t 0.0Mi-0.0008 + C), whereas the D locus segregates independently of these three loci. Among the 30 parents of CCV loci A and D are each represented by four alleles and loci B and C each by three alleles. Homozy- gotes are single banded and heterozygotes are double banded for loci A and B whereas homo- zygotes are double banded and heterozygotes are quadruple banded for loci C and D. Designation of these alleles is based on migrational distance in centimeters from the origin, e.g. Ao.2, B1.*,
c4.4
(alleles producing double bands in homozygous condition are designated by the leading band). One of the four alleles a t the D locus is a recessive null allele ( D N ) . All genotypes can be identified directly from starch gels, with the following exceptions (KAHLER and ALLARD 1970): (1) heterozygotes involving the recessive D" allele, which cannot be distinguished from banded homozygotes; (2) heterozygotes involving the A2.6 allele in genotypes which are either homo-zygous or heterozygous for the B2.7 allele. The B 2 . 7 allele produces a heavy staining band which
obscures the lighter staining A2.6 band; hence A0 2A2 6, A1 OA2 6 and A1 *A'.6 heterozygotes
cannot be distinguished from the corresponding A0 2, A1 0 or A1 8 homozygotes in the presence
of B2.T. Heterozygotes involving these alleles are scored as homozygous for the alternative alleles; consequently these difficulties in classification, and the method of scoring they necessitate, lead to underestimation of heterozygosity and also to downward bias in estimates of the frequencies of the DN and A2 6 alleles. This is not a serious problem because the A2 6 and DN alleles are both
IOW in frequency.
To facilitate scoring, a standard genotype, developed by 40 generations of enforced selfing, and invariant in banding pattern, was included in each gel. Also all gels were read independently by two or more persons, including one of the authors (ALK), to ascertain objectivity in scoring. Since results were identical in all cases it seems unlikely that scoring errors o r biases could have had more than inconsequential effects in this study.
Many alleles in addition to those represented in CCV have been found a t each of these four loci in the world collection of barley. At present, the numbers of alleles (including those repre- sented in CCV) that have been established by segregation tests are, respectively, 5, 6, 5, and 6
SELECTION IN BARLEY
49
1
of these loci is considerably larger yet, perhaps Z or 3-fold larger, in the 13,000 items in the world barley collection. Thus spontaneous mutations affecting electrophoretic mobility have notonly occurred at these loci but have also become established in populations. However, in a study
of mutation rates now in progress, more than 80,000 individuals, representing more than Is0,OOO possible mutational events per locus, have been examined to date for mutation at these loci. Since no mutants have been found, these four loci do not appear to be unusually mutable.
RESULTS
The parents of CCV: Each of the parents of CCV is an entry in the world barley collection maintained by the
U. S.
Department of Agriculture. The introduction of items into the collection is on the basis of a small sample of seeds and thereafter each entry is maintained by growing a short row when seed supply is nearly exhausted (Personal communication, Dr.J.
C. CRADDOCK, Crops ResearchDi-
vision, Agricultural Research Service,
U. S.
Department of Agriculture). Thus, due to founder effect at the time of introduction into the collection, and severe genetic drift arising from recurring drastic reductions in population size, the entries in the collection are expected to be less variable genetically than the popu- lations from which they were derived. To determine the extent of allozyme vari- ability within and among the 30 parents of CCV, 54 or more individuals of each parent stock were assayed electrophoretically (the average number assayed was 152 per parent for loci A,B
and C and 90 for locusD).
The results have been presented in detail elsewhere (KAHLER and ALLARD 1970) but they are given here in summary form because of their relevance to the present study. Twelve ofthe 30 parents were monomorphic for one or the other of the three A locus alleles; however, 12 were polymorphic with two A locus alleles preEent and six were polymorphic with three alleles present. At the B locus 21 of the 30 parents were monomorphic and the majority were fixed for the B2.? allele; this is expected be- cause this allele is very frequent on a worldwide basis. However, nearly one-third
of the parents were polymorphic for 2 or 3 alleles at this locus. The C and
D
loci were the most extensively polymorphic; two-thirds or more of the parents were polymorphic, including many polymorphic for three alleles and three polymor- phic for four alleles. Considering all four loci simultaneously only three of the parents were monomorphic at all four loci, whereassix
were polymorphic for one locus, six for two loci, six for three loci and nine for all four loci. The polymorphic parents included heterozygotes in approximately the proportions expected in a species which is about 99% self pollinated. It is therefore apparent that many of the parents of CCV are extensively polymorphic. This result is not consistent with adaptive neutrality, since adaptively neutral alleles are expected to become fixed very rapidly in such small populations. Maintenance of such polymorphisms by migration also seems unlikely; each parent is remarkably uniform and distinc- tive morphologically so that the rare hybrids which occur between entries in the world collection are easily recognized and rogued. The extensive polymorphism observed appears, however, to be consistent with certain types of balancing selec- tion to be considered later.492 R. W. ALLARD, A. L. K A H L E R A N D B. S. W E I R
TABLE 1
Allelic frequencies and percent heterozygosity at the A locus*
Number Percent
Generation of plants A Q . 2 Al.0 A1.S M.6 heterozygosity
Initial+ 4569 ,1061 ,3484 .5149 ,0306 -
4 1390 .I 072 .3482 5277 .0169 7.12
5 1486 .IO03 .3641) .5185 ,0172 4.31
6 1006 ,0944. .3613 .5224 .0219 3.29
14 1931 ,1142 ,3729 ,5046 .GQ83 2.44
15 28 1.3 ,0922 .3765 ,5222 .0091 2.78
16 2369 .I097 .3624 .5241 .0038 1.48
17 2461 .0941 .3393 .5626 . O M 0.65
24 4802 .os00 . 3 m .6087 .0109 2.50
25 3967 ,065 1 .3113 .6042 ,0194 1.61
26 3083 .0478 ,3258 .6098 .0166 1.30
* Standard errors
<
0.01.+
Allelic frequencies inferred from those of the 30 parents.gene frequencies for Loci A, B, C and D, respectively, in each of 10 generations of CCV, together with the size of sample from which each frequency was estimated. Since viable seeds of the initial (F,) generation are no longer available. gene fre- quencies in that generation were inferred from the gene frequencies in the 30
parents of CCV, assuming no selection took place during the intercrossing phase of the development of the population. Gene frequencies for the other generations were computed directly from observed genotypic frequencies (genotypic fre- quencies are not reported since they can be computed from data of Tables 1-4 and the Fixation Indices given in Table 5 ) . The number of individuals assayed
TABLE 2
Allelic frequencies and percent heterozygosity ai the B locus*
Number Percent
Generation of plants Bl.0 B2.7 B3.9 heterozygosity
Initial+ 44 5 6 14 15 16 17 24 25 26 4569 1279 1486 1006 1928 2843 2369 2461 4587 3967 3083 ,0656 ,0606 .ow1 .0905 .06M ,0769 .0656 .0508 .I521 .I592 ,1758 .go50 ,9042 ,9189 ,8857 ,8955 ,841 7 ,9057 ,9118 ,7771 .7724 ,7408 ,029) ,0352 .0320 .OB8 ,0441 ,0814 ,0287 ,0374 ,0708 .0684 ,0834 - 3.83 1.34 0.00 1.87 4.37 1.14 0.08 2.10 1.06 0.64
* Standard errors
<
0.01.SELECTION I N BARLEY
TABLE 3
Allelic frequencies and percent heterozygosity at the C ~OCUS'
493
Percent Generation of Number plants c4.4 c4.9 cs.4 heterozygosity
Initial+ 4 5 6 14 15 16 17 24 25 26 4569 12344 1486 1005 1651 2843 2369 2461 4397 3967 3083 .I437 .0332 .OM5 .07M .0336 .0823 .0500 .0772 .lo23 ,2113 ,2791 2474 . 2 M .3008 ,2868 ,2035 2312 .3263 .3074 .3157 .3079 ,2538 5089 .7022 .6M7 .6392 .7629 6365 .6237 .6154 .5820 .4808 .4671
-
9.24 5.72 1.89 7.2.0 2.33 3.17 0.61 7.62 1.48 1.56* Standard errors
<
0.01.+
Allelic frequencies inferred from those of the 30 parents.was large (from 1006 to 4802) in each of the three early
(F,-F,),
four intermedi- ate(FI4-Fl7)
and three late (F24-F26) generations that were monitored. Standard errors of allelic frequencies are small (<O.Ol ) so that changes of 0.02 or larger in frequencies are significant.The data of Tables 1 4 show that highly significant changes in allelic fre- quencies occurred in a number of single-generation transitions. I n many cases (e.g. allele C5.4 in transition from generation 14 to 15) changes in allelic fre- quency >0.10, i.e. 10 standard errors or larger, occurred. In addition it is clear that longer-term changes also took place. Thus at locus A the 1.8 allele increased gradually at the expense of 0.2, at locus
B
alleles 1.6 and 3.9 increased at the expense of 2.7, while at loci C andD,
the C4.4 andD6.4
alleles increased markedly at the expense of alleles C5.4 andD".
Also allelic frequencies in generations FI4-TABLE 4
Allelic frequencies and percent heterozygosity at the D locus'
Percent
DO.& D6.3 DB.6 DN heterozygosity
Number
Generation of plants
Initial+ 2698 .5830 .0843 .I730 .1597
-
5 1486 .M1 .a027 .I568 .4001E 0.40
6 1006 .5238 ,0318 ,1730 .2714 0.79
16 2369 ,5047 .0025 .2277 .265 1 0.29
17 2458 .5388 .0867 .18M .I941 0.85
25 39% .6263 .0038 .0833 .2866 1.09
26 3082 ,7279 .0513 .1663 . 0 5 6 1.39
* Standard errors
<
0.01.494 R. W. ALLARD, A. L. KAHLER A N D B. S . WEIR
F,,
were not always intermediate to those in the early and late generations, probably reflecting longer-term reversals in environment. However, attempts to relate either single-generation or longer-term changes in allelic frequencies to rainfall, temperature, or other factors of the environment revealed no consistent associations.Tables 1 to 4 also show that the proportion of heterozygotes decreased rapidly in early generations (F,-F,), as expected in a population in which there is more than 99% of self fertilization. However, the proportion of heterozygotes there- after showed no further consistent decreases but fluctuated about apparent equi- librium values. Estimation of the proportion of heterozygotes for the D locus is complicated by the recessive D" allele, which causes estjmates of heterozygosity to be biased downward. This bias, which is expected to be larger in generations when DN was frequent than in generations when its frequency was lower, prob- ably contributes to the erratic results for the D locus (Table 4 ) .
Amount of outcrossing: Before the above changes in gene and genotypic fre- quencies can be discussed quantitatively, precise information is required about the mating system of CCV. I n particular, an estimate is required of the extent of self fertilization (s) versus random outcrossing ( t = 1
-
s).
The mating system was assessed by harvesting 100 random spikes from each of theF,-F6,
F,,-FI7
and F,,-F,, generations, grown in three different years. This sampling was done prior to harvesting the population and so is independent of the samples from which allelic frequencies were estimated. Sixteen seedlings grown from the seeds of each spike were then assayed electrophorectially. If more than 3 heterozygotes and/or two different homozygotes were observed in any family for a particular locus, the maternal parent was judged to be heterozygous and the family was not used in estimating outcrossing for the locus in question. The parameter t and its standard error were estimated from the data obtained using the methods given in Appendix A. The estimates of t obtained were homogeneous over loci, genera- tions, and also over years. They also agree closely with previous estimates made using morphological polymorphisms, and they are in accord with general experi- ence at Davis, California, which is that a consistent low level of outcrossing occurs in barley. Hence, it is appropriate to use the mean estimate of t = 0.0057
*
0.0014 to characterize the mating system of CCV.Inbreeding coeficients and fixation indices: For an inbreeding population with neutral alleles at each locus, the amount of heterozygosity in any generation is directly related to the Inbreeding Coefficient, F . Values of F in generation n for a population which is initially non inbred and practices an amount t of random outcrossing and s = (1 -t) of selfing, are given by
F " = - ( l - - ( ? ) n ) . S S
1 f t
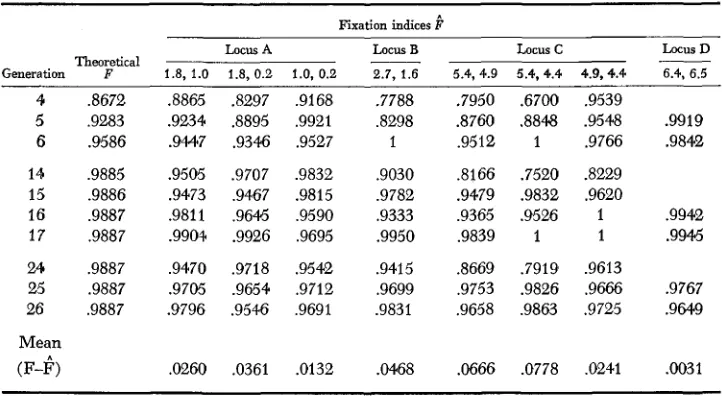
SELECTION I N BARLEY 495 TABLE 5
Theoretical inbreeding coeficients and observed fixation indices*
Fixation indices F
Locus A Locus B Locus c Locus D
Generation Theor F e tical 1.8, 1.0 1.8, 0.2 1.0, 0.2 2.7, 1.6 5.4, 4.9 5.4,4.4 4.9,4.4 6.4, 6.5
4 3672
5 ,9283 6 ,9586 14 ,9885 15 .9886 16 .9887 17 .9887 24 .9887 25 .9887 26 .9887
Mean
(F-I?)
,8865 .8297 .9168 .9234 .8895 .9921 .9M7 .9346 .9527 .9505 .9707 .9832 .9473 ,9467 .9815 .9811 ,9645 ,9590 .9904 .9926 .9695 ,9470 .9718 .9542 .9705 .9654 .9712 9796 .9546 ,9691
.0260 .0361 .0132
.7788 ,8298 1 .9030 .9782 .9333 .9950 .9415 .9699 .9831
.W68
.7950 5700 .9539
.8760 .8848 .9548 .9919 .9512 1 .9766 .9842 .8166 ,7520 .8229
.9479 .9832 .9620
.9365 9526 1 .9942
.9839 1 1 .99%
3669 .7919 .9613
.9753 .9826 .9666 .9767 .9658 .9863 .9725 .9649
.Of566 .0778 ,0241 .0031
* Alleles AO.2 and A2.6, alleles B1.6 and B3.9, and alleles D6.5, D6.6, DN have been combined.
If
factors other than inbreeding (such as selection) affect the relationship be- tween gene and genotypic frequencies, their combined effects can be represented by the Fixation Index, denoted by F(n). The Fixation Index is defined(WEIR
1970) for the ith and j t h alleles at a locus by
p .
-
1-
f . . / .1.5 - 1.3
PsPi,
where 2fcj is the observed frequency of the heterozygote and p. and pj are allelic frequencies. Values of the Fixation Index for CCV are also given in Table
5.
Values of the Fixation Index are generally lower than those of the Inbreeding Coefficient for each locus, indicating an excess of heterozygotes. Most of the ex- ceptions
(E"
>
F )
occurred either in generation 17, in which generation the pro- portion of heterozygotes was low for all loci, or in the early and intermediate generations for locus D, when heterozygosity was underestimated due to the high frequency of the recessive DN allele. Although values of Pn increased substantially for all loci from the early (F,-Fs) to the intermediate (F14-F17) generations, nofurther increases occurred from the intermediate to the late (F24-F26) genera- tions. Apparently, therefore, CCV had not reached inbreeding equilibrium by generation 6 but had done so by generation 14, or earlier. All stages of the in- breeding process, including the apparent inbreeding equilibrium state, feature an excess of heterozygotes. Thus some force or forces other than mating system affect the relationship between gene and genotypic frequencies. I n the next sec- tion we assume that mating system and selection are the forces responsible for
496 R. W. ALLARD, A. L. KAHLER A N D B. S. WEIR
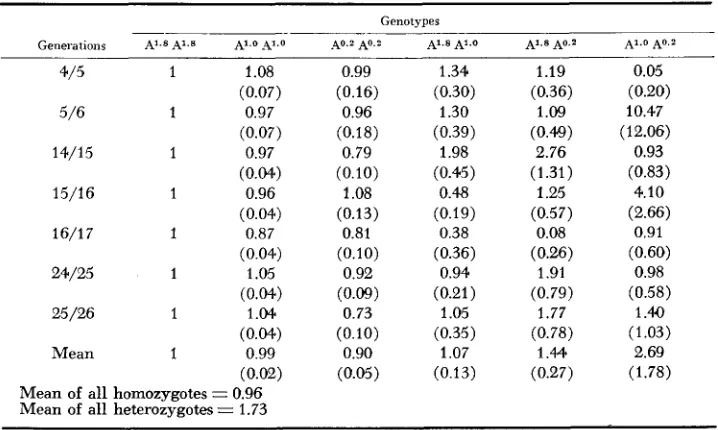
Estimation of selective values: Selective values f o r the individual genotypes were estimated from census data on genotypic frequencies in successive genera- tions using the methods given in Appendix B, which are based on Model I1 of WORKMAN and
JAIN
(1966). This model, which assumes that census data are taken each generation soon after mating and that no selection occurs between mating and scoring, is appropriate because germination was excellent and sur- vival to time of assay was high (about 99% of seeds produced assayable 7-day- old seedlings). Estimates of selective values (relative to the selective value of the most frequent homozygote taken as unity), and their standard errors, are given for the A locus in Table 6. Selective values of the homozygotes tend to be lower than unity (mean = 0.95. range 0.73-1.08); averaged over generations for each genotype, they reflect the increase which occurred in the frequency of A1.*A1.*(b
= 1 ),
the slight decrease in frequency of A1.OA1.O(b
= 0.99) and the larger decrease which occurred for the combined A0.2A0.2, A2.6A2.6 genotypes(h
=0.90). The low frequencies of the heterozygotes led to high standard errors and, as expected, estimates of their selective values were more erratic than those of homozygotes. However, the majority of the estimates exceed unity and their aver- age ( 1.73) indicates substantial net reproductive advantage of heterozygotes over homozygotes. As noted by ANDERSON (1969), estimates of selective values made from successive pairs of generations are not independent since they are based on a common set of observations. This has the effect of causing an extreme value in one interval to be followed by a value at the opposite extreme in the next interval
TABLE 6
Selection estimates and standard deviations for the A locus with 0.57% outcrossing*
Genotypes
Generations AI.8 Al.8 A'.O -4l.O
.
40.2 AO.? A1.S Al.0 AI.8 A0.2 Al.0 A0.24/5 1 1.08 0.99 1.34 1.19 0.05
5/6 1 0.97 0.96 1.30 1.09 10.47
14/15 1 0.97 0.79 1.98 2.76 0.93
15/16 1 0.96 1.08 0.48 1.25 4.10
(0.07) (0.16) (0.30) (0.36) (0.20)
(0.07) (0.18) (0.39) (0.40) (12.06)
(0.04.) (0.10) (0.45) (1.31) (0.83)
(0.04) (0.13) (0.19) (0.57) (2.66)
(0.04) (0.10) (0.36) (0.26) (0.60)
(0.04.) (0.09) (0.21) (0.79) (0.58)
(0.04.) (0.10) (0.35) (0.78) (1.03)
(0.02) (0.05) (0.13) (0.27) (1.78)
16/17 1 0.87 0.81 0.38 0.08 0.91
24/25 1 1.05 0.92 0.94 1.91 0.98
25/26 1 1 .M 0.73 1.05 1.77 1.40
Mean 1 0.99 0.90 1.07 1.44 2.69
Mean of all homozygotes = 0.96 Mean of all heterozygotes = 1.73
S E L E C T I O N IN BARLEY
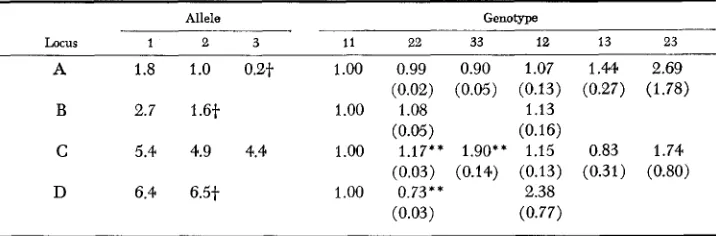
TABLE 7
Average selection estimates and standard deviations (in parentheses) for
Esterase loci A , B, C and D with 0.57% outcrossing
497
Allele Genotype
Locus 1 2 3 11 22 33 12 13 23
A 1.8 1.0 0.2t 1.00 0.99 0.90 1.07 l . M 2.69
B 2.7 1.6t 1.00 1.08 1.13
C 5.4 4.9 4.4 1.00 1.17** 1.90** 1.15 0.83 1.74
D 6.4 6.5t 1.00 0.73** 2.38
(0.02) (0.05) (0.13) (0.27) (1.78)
(0.05) (0.16)
(0.03) (0.14) (0.13) (0.31) (0.80)
(0.03) (0.77)
~~
t
Alleles are combined at the A, B and D loci as follows: AO.2+
A2.6 = allele 3, B1.6f
B3.9 = * * Significant departure from 1 .OO, P<
0.01.allele 2, D6.5 f D6.6
+
D N = allele 2.as, for example, seems to have been the case for genotype Ao.ZA1.o in the transi- tions from generations
4
to5
and5
to 6.Results for loci B, C and D were similar in pattern and consequently only mean selective values are reported for these loci (Table 7). At locus B, the B2.' allele is present in high frequency in all generations. Thus all genotypes other than the E2.7B2.T homozygote are infrequent with the result that estimates of their selective values are subject to large sampling errors and, as expected, quite variable. Nevertheless, averaged over generations, the selective values reflect the decrease which occurred in the B2.7B2.7 homozygote
(6
= 1) and the increase in frequency of the combined B1.6B1.6 and B3.9B3.9 homozygotes( 2
= 1.08). There is also in- dication that, on the average, heterozygotes (& = 1.13) have a selective advan- tage over all homozygotes. For the C locus the most conspicuous features of the results are high average selective values of the C4.4C4.4 homozygote(E
= 1.90) and the C4.4C4.9 heterozygote(6
= 1.74), and the low selective value of the C4."C5." heterozygote(h
= 0.83). In estimating selective values for the D locus the three least frequent alleles (D6.5, D6.6 and D") were combined which, together with inability to distinguish DN heterozygotes, reduced the number of genotypic classes to three: D6.4D6.4 (including also D6,"DN) ; D6.5D6.5 (including also D6.6D6.6, DNDN, D6.5D6.6, D6.5DN, D6.6DN) ; and D6."DG.5 (including also D6.4D6.6). The net effect of misclassification of DN heterozygotes and the reduction i n number of classes is to underestimate the frequency of heterozygotes and hence also their selective values. Despite this bias the excess of heterozygotes was very large for this locus which was reflected in consistently higher selective values of the hetero- zygotes relative to the superior homozygote (D6.4D6.4), and a very high mean selective value ( U , = 2 . 3 8 ) .D I S C U S S I O N
498 R. W. ALLARD, A. L. K A H L E R A N D B. S. WEIR
observed genetic changes in CCV were not due to genetic drift, mutation or mi- gration. Genetic drift can be eliminated on the basis that population size was far too large in all generations for sampling accidents to have had any measureable effect on allelic frequencies over the 25 generation interval involved. Mutation can be eliminated on two counts: first the mutation-rate study mentioned earlier shows that mutation rates at these loci are too low to have affected the short-term dynamics of the population; second, even though these loci are known from studies of worldwide variability in barley to be capable of mutating to many allelic forms, no alleles not present in the parents were found in any generation. Migration can be eliminated on this same basis: no alleles not present originally were found in any generation although such alleles are unlikely to have escaped detection had the isolation in which the population was grown broken down and migration from outside populations of barley taken place. Thus, among the estab- lished evolutionary forces, this leaves selection and mating system as the ones responsible for the changes in gene and genotypic frequencies which occurred
in CCV.
Selection in CCV took two forms. First, the observed change in gene and geno- typic frequencies show that directional selection, i n which certain homozygotes were favored over other homozygotes, took place at all four loci. The selective values indicate that this directional selection was intense. Thus in 10 of the 24
single-generation transitions for which selective values could be calculated the better or best homozygote had a net reproduction advantage of more than 50% over the poorer or poorest homozygote. As expected in a population grown in a temporally heterogeneous environment, the same homozygote was not always favored in different generations. Nevertheless, long-term trends in allelic fre- quencies are discernible and they indicate that the C4.4C4.4 and D6.'D"" homozy- gotes were much superior, and that the A1.8A1.8 and B1.6B1.6 homozygotes were moderately superior, on the average, to the other homozygotes at these loci. The selective values give a quantitative measure of this superiority. Thus the average selective value of the C4.4C4.4 homozygote, averaged over seven single-generation transitions, was 1.90 and that of the next best homozygote ( C4.9C4.9) was 1.1 7, indicating a mean reproductive advantage of 1.90/1.17 = 1.62 o r 62%. Parallel values for the other three loci are: D6.4D6.4 = 1/0.73 = 1.37; B1.6B1.6 = 1.08/1 = 1.08 and A1.8A1.8 = 1/0.99 = 1.01. The reproductive advantages of the best homo- zygote over the poorest homozygote were 11,8,90 and 37%, respectively, for the
A,
B, C and D loci.An important feature of the selective values is that they differ substantially
for the A, B and C loci, indicating that selection operated differentially on these three very tightly linked loci. These loci are ordered B t 0.0023
+
A t 0.0048-+
C. This suggests that the A locus itself (WEIR, ALLARD and KAHLER 1972), and not genes linked to it, affects reproductive capacity: the chromosome segment in- volved is too small to carry many additional genes.The second form of selection which occurred in CCV is balancing selection fea- turing a n excess of heterozygotes over expectations based on considerations of
SELECTION IN BARLEY 499
of single-locus overdominance. However, multilocus analyses of these data show that specific positive and negative epistatic interactions of a type that can lead to excesses of heterozygotes occurred between particular alleles at different loci in CCV (WEIR, ALLARD and KAHLER 1972; CLEGG et
al.
1972). There is also evi- dence from competition studies in CCV that reproductive capacity is often higher when individuals compete with genotypes other than their own and that such competitive interactions can also lead to a balancing type of selection that may produce excess heterozygosity (ALLARD and ADAMS 1969; SCHUTZ andUSANIS
1969). Hence it seems likely that the surplus of heterozygotes observed in
ccv
has multiple and complex causes.
These results lead us to the conclusion that the observed patterns of enzymatic variation in CCV result from balancing selection with strong selection intensities and with the direction of selection different for various alleles. This same hy- pothesis also appears adequate to explain the main features of variation in the barley species as a whole. The high degree of polymorphism found within local populations of barley is consistent with balancing selection of the intensity found
in CCV. The marked differentiation in allelic frequencies between populations from different ecogeographical regions is expected if selection favors particular alleles at some places and other alleles at other places. There can be no doubt that migration takes place frequently between populations of barley, both in- advertently and also through deliberate introductions by man. However, it is well known that even a low rate of migration is sufficient to nearly equalize gene fre- quencies among populations unless selection strongly favors alternative alleles in different populations. Furthermore, migration rates high enough to maintain the high levels of polymorphism observed within populations would almost certainly reduce differences between populations to low levels, even in the face of strong directional selection in different directions in different populations. Thus, ob-
served patterns of variability in the barley species are consistent with the evi- dence from CCV that some combination of directional and balancing selection plays a much more important role than mutation, migration or genetic drift in determining the present-day genetic makeup of the barley species.
No
other hypothesis appears to be in accord with all of the observations. The neutrality hypothesis ( KIMURA 1968) predicts large amounts of genetic variabil- ity within large populations such as CCV, provided many mutational sites are assumed within each gene. However, this hypothesis does not predict the ob- served excesses of heterozygotes in CCV. The existence of extensive polymor- phism within accessions of the world barley collection is also at variance with the neutrality hypothesis. Observed mutation rates are too low t o support more than trivial levels of polymorphism in such small populations. At the same time changes in allelic frequencies which occurred in CCV (a large population) were far too large to be accounted for by mutation and the drift of neutral alleles.500 R. W. ALLARD, A. L. K A H L E R A N D B. S. W E I R
L I T E R A T U R E C I T E D
ALLARD, R. W. and J. ADAMS, 1969 Population studies in predominantly self-pollinated species. XIII. Intergenotypic competition and population structure in barley and wheat. Am.
Naturalist 103: 621-&5.
ANDERSON, WYATT W., 1969 Selection in experimental populations. I. Lethal genes. Genetics
62 : 653-672.
CLEGG, M. T., R. W. ALLARD and A. L. KAHLER, 1972 Is the gene the unit of selection? Evidence from two experimental plant populations. Proc. Nat. Acad. Sci., in press.
KAHLER, A. L. and R. W. ALLARD, 1970 Genetics of isozyme variants in barley. I. Esterases. Crop Science 10: 444418. - , 1972 Worldwide patterns of variation of esterase allozymes in barley (Hordeum uulgare and H . spontaneum) . (In preparation).
Evolutionary rate at the molecular level. Nature 217: 624-626. KIMURA, M., 1968
SCHUTZ, W. M. and S. A. USANIS, 1969 Inter-genotypic interactions in plant populations. 11. Maintenance of allelic polymorphisms with frequency-dependent selection and mixed selfing and random mating. Genetics 61 : 875-891.
SUNESON, C. A., 1956 An evolutionary plant breeding method. Agron. J. 48: 188-191. WEIR, B. S., 1970 Equilibria under inbreeding and selection. Genetics 63: 371-378.
WEIR, B. S., R. W. ALLARD and A. L. KAHLER, 1972 Analysis of complex allozyme polymor- WORKMAN, P. L. and S. K. JAIN, 1966 Zygotic selection under mixed random mating and self-
phisms in a barley population. Genetics 72: 505-523.
fertilization: theory and problems of estimation. Genetics 54: 159-1 71.
APPENDIX A ESTIMATION OF OUTCROSSING
Estimation of t: With k alleles at a locus, suppose that over all families from parents homozy-
gous for the i t h allele, N i individuals are observed. If bi of these are also homozygous f o r the i t h allele, the likelihood function is
where t is the unknown outcrossing rate and qi is one minus the population frequency of the ith
allele.
Differentiating t o obtain the maximum likelihood estimate of t:
so that the estimate 2 satisfies
Equation (3) must in general be solved numerically, and it was in the present case, but if t is small enough for tqi to be negligible, an adequate estimate of t is given by
k k
2 = a = 1 .Z ( N i - b i ) / a=1 ,X biqi
.
(4)Variance of estimates: Standard errors of the estimates of t were obtained from large sample
SELECTION IN BARLEY 501
b, and qi, for which only estimates are available. We write these estimates just as bi and q i .
The bi are independent and binomially distributed:
bi
-
B(Ni,
I-tqi) var ( b i ) = N i tqj (1-tqi) ( 5 )The estimates of q i are obtained from a different sample, of size M , so that q i and bi are inde- pendent but the q i are correlated among themselves. In the sample suppose the relative frequency of the homozygote for the i t h allele is f i r , and the relative frequency of the heterozygote for the
i t h and i t ” alleles is 2fii. Then
var ( f i i ) = f i i (I-fii)/M
cov (fii, 2fij) =
-
2fii f i i / M .The estimate of the frequency of the i t h allele, pi, is thus
k
i=1
pi =
z
f i j andqi
= 1 - p i ,so that
The variance of the estimate of the outcrossing parameter is thus a function of the variances and covariances of the bi and qi. To the order of accuracy of the variances [obtained by substitut- ing estimates of bi and q i into (5) and (S)] we have
CRAM&, H., 1946 Mathematical methods of statistics. Princeton.
APPENDIX B
ESTIMATION O F SELECTIVE VALUES
I Estimation. Denoting the frequency of the homozygote for the i t h among k alleles in gener-
ation n by fnii, the frequency of the heterozygote for the i t h and i t h alleles in generation n by 2fiin, the selective values of homozygotes and heterozygotes by wii and wij, respectively, and the amount of outcrossing in generation n by t, expected genotypic frequencies in generation
n f l are given by the following transition equations:
where dummy suffices m and I range over integers 1 to k. In these transition equations the frequency of each genotype in the n t h generation has been weighted by its selective value w,
and d = wijfnij is the mean fitness for that generation.
502 R. W. ALLARD, A. L . KAHLER A N D B. S. WEIR
For an observed set of genotypic frequencies in generation n, the above equations give the expected genotypic frequencies in generation n+1. By equating these expected values to observed frequencies in generation n+l, a set of equations is obtained which can be solved to give maxi- mum likelihood estimates of the selective values. Because there is one more selective value than independent genotypic frequencies in each generation, we set wll (corresponding to the more frequent homozygote) equal t o one. The maximum likelihood estimates are then:
A
Cl
vi
fTj
Vl wii = ~fYi
Vl i=1,2,...,
k.
2fY1 Uif i,j=1,2
,...,
k.
iZj.Gij 1
where
i=1,2
,...,
k.
i,j=1,2
,...,
k.
i#j.i=
1,2,...,
k.
vi
= 2 f y-
p:+1 (s+2tp9+1)uij
=c;1-
tp;+’p:f’ p;+’ = 3 = 1:
f n f ’ 2 1Note that wij is not estimable when f?. = 0.
Variance of estimutes; As emphasized by LORENZ (1970) the above estimates are functions of three Sets of random variables (genotypic frequencies in generation n and generation n+1, and the outcrossing parameter) for which estimates only are available. The estimates of genotypic frequencies are distributed multinomially. For a sample of size Nn in generation n we write both estimates and true values as f;i, 2p.
$9
$1
v a r ( t , > = f”,i(l-f”ii)/Nn
var(fYj> = 1/4 var (Zf;,) =
fyj
(1-2fTj)/2NnC O V ( ~ ~ ~ ,
f l j )
= 1/2 cov(fyi,
2 e j )= - c i C j / N n
cov(f;j7f & )
= 1/4 cov (2fij7 2f:q) =-cjc,/NnEstimates in generation n are independent of those in generation n f l . An estimate of the out- crossing parameter and its variance is also available (Appendix A). This variance takes proper account of the fact that the estimate of t is not independent of genotypic frequencies in genera- tion n. To the order of accuracy of the estimates of the variances of the genotypic frequencies and the outcrossing parameter, f o r any selection value w;
The sums are over all genotypic frequencies, so that p,q,u,v = 1,2, ..., k. When p=u, g=v (or
p=v, g=u) we have the variance terms. For example, the fiist sum in the two allele case
SELECTION IN BARLEY 503
In applying the above theory to CCV the computations of selective values and their variances were made in three ways: (1) on the basis of the 36 individual single-locus, single-generation estimates of t ; ( 2 ) using the overall estimate of t but ignoring its variance; and (3) using the overall estimate of t and its variance. Since all three sets of selection values and standard errors were the same to two decimal place accuracy, the effect of ignoring the stochastic nature of the outcrossing parameter appears to be trivial in practice.