Structure-Symptom Relationships in
Obsessive-Compulsive Disorder
Tim Jonas Reess
Submitted by
Tim Jonas Reess
Munich, 26 April 2018
Supervisor
Prof. Dr. Kathrin Koch
Institut für Diagnostische und Interventionelle Neuroradiologie
Klinikum rechts der Isar, Technische Universität München
First Reviewer:
Prof. Dr. Kathrin Koch
Second Reviewer:
Dr. Afra Wohlschläger
Date of Submission:
April 26
th, 2018
ABSTRACT
Obsessive-compulsive disorder (OCD) is a highly debilitating psychiatric disorder. While
current accounts of pathophysiological models emphazise the role of
cortico-striato-thalamo-cortical (CSTC) circuitry, there is accumulating evidence indicating other brain
regions to be critically involved in disease mechanisms. Furthermore, first evidence points
towards potential alterations in neurodevelopment to be of importance in OCD. However,
the majority of studies examining structural alterations in OCD have focused on assessing
locally confined measures, effectively disregarding potential network-like relationships
between various brain regions. Though recent evidence indicated hippocampus volume
alterations to be of importance in OCD, a relationship between structure and symptoms
was lacking when assessing symptoms in isolation. In this regard, it appears to be unclear,
whether patients with specific symptom profiles may also present with differential changes
in hippocampus morphology.
With the translation of graph theoretical concepts used in modern network science to
brain research, it is now feasible to model the brain in terms of structural and functional
networks, to assess topological features, and to identify differences between healthy
subjects and psychiatric populations. Against this background, the first two Projects of the
current thesis aimed at assessing differences in structural brain networks between OCD
patients and healthy controls employing network modeling techniques and graph
theoretical analyses methods. More specifically, Project 1 focused on the assessment of
networks derived on the basis of white matter tractography. It was shown that regions
outside the typically described CSTC circuitry appear to be of importance. In this regard,
the left uncinate fasciculus connecting temporo-limbic to frontal areas may be critically
involved. Additionally, various network measures indicated a potentially important role for
amygdala and the temporal pole. Project 2 focused on the examination of networks based
on gyrification covariance patterns, where gyrification was used as a proxy for
neurodevelopment. It was shown that differences in gyrification-based covariance patterns
may potentially be linked to time-locked periods of neurodevelopment, underlining the
proposition of neurodevelopmental changes in OCD. Project 3 applied clustering methods
to group patients according to their entire symptom profiles and subsequently related
cluster status to hippocampus volumes. Results indicated that different symptom profiles
potential usefulness of taking into consideration the interrelation between various
symptoms.
Taken together, the projects underline the necessity to further clarify the role of brain
regions not typically associated with OCD pathophysiology and to incorporate these into
current models. Additionally, the likely involvement of neurodevelopmental factors for the
disease will hopefully spark new research while the consideration of symptom
interrelations may be of use to reveal structure-symptom relationships that were
ABBREVIATIONS
ACC - anterior cingulated cortex
BG - basal ganglia
BOLD - blood-oxygen-level dependent
CBT - cognitive behavioral therapy
CSTC - cortico-striato-thalamo-cortical
CT - computed tomography
DLPFC - dorsolateral prefrontal cortex
DSI - diffusion spectrum imaging
DWI - diffusion weighted imaging
DTI - diffusion tensor imaging
GPe - globus pallidus externa
GPi - globus pallidus interna
GLM - general linear model
lGI - local gyrification index
lOFC - lateral orbitofrontal cortex
mOFC - medial orbitofrontal cortex
MRI - magnetic resonance imaging
NBS - network-based statistic
NOS - number of streamlines
OCD - obsessive-compulsive disorder
OFC - orbitofrontal cortex
PCC - posterior cingulate
SSNRI - selective serotonin-norepinehrine reuptake inhibitor
SSRI - selective serotonin reuptake inhibitor
SMA - supplementary motor area
SNr - substantia niagra
SPECT - single-photon emission computed tomography
TBI - traumatic brain injury
TBSS - tract-based spatial statistics
UF - uncinate fasciculus
VBM - voxel-based morphometry
LIST OF FIGURES
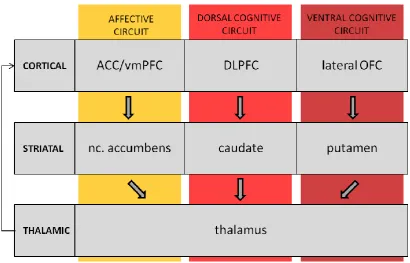
Figure 1. Illustration of components and pathways implicated in circuitry important
for the pathophysiology of obsessive-compulsive disorder 9
Figure 2. Illustration of node derivation 20
TABLE OF CONTENTS
ABSTRACT I
ABBREVIATIONS III
LIST OF FIGURES V
TABLE OF CONTENTS VII
1. General Introduction 1
1.1. Phenomenology of Obsessive-Compulsive Disorder 1
1.1.1. Symptoms 2
1.1.2. Epidemiology, Disease Burden, and Comorbidity 2
1.1.3. Course 3
1.1.4. Treatment Options 4
1.2. Pathogenesis and Neurobiology of OCD 5
1.2.1. Genetic and Environmental Factors 5
1.2.2. A Neurobiological Model of OCD 6
1.2.3. Structure – Symptom Relationship in OCD 11
1.3. Methodological Considerations 13
1.3.1. Classical Approaches to Study Structural Alterations 13
1.3.1.1. Volume and Surface Based Methods 13
1.3.1.2. Commonly Used Statistical Analysis Framework 14
1.3.1.3. Assessing Relationships Between Symptoms and
Morphological Alterations 14
1.3.2. Network-science Inspired Approaches to Study Brain Morphology 15
1.3.2.1. General Framework 16
1.3.2.2. Construction of Brain Networks 16
1.3.2.3. Assessment of Brain Networks 18
1.3.2.4. Clinical Impact of Network-based Studies 19
1.3.3. Methods and Measures used in Current Studies 20
1.4. Aims of the Thesis 23
2. Project 1: Connectomics-based structural network alterations in
3. Project 2: Network-based decoupling of local gyrification in
obsessive-compulsive disorder 45
4. Project 3: Association between hippocampus volume and symptom
profiles in obsessive-compulsive disorder 65
5. General Discussion 79
5.1. Main Findings and Implications Across Projects 79
5.1.1. Beyond Fronto-Striato-Thalamo-Cortical Circuitry 80
5.1.2. Neurodevelopmental Aspects of OCD 81
5.1.3. The Importance of Symptom Profiles in OCD 83
5.1.4. Key Implications Across Projects 84
5.2. Limitations & Methodological Considerations 85
5.2.1. Issues Regarding Sample Heterogeneity 85
5.2.2. Issues Regarding Network-based Approaches 86
5.3. Future Directions 89
5.3.1. Potential for Follow-up Studies in Light of Current findings 89
5.3.2. The Promise of Large-Scale Imaging Initiatives 90
5.3.3. Transdiagnostic Approaches to Psychopathology 91
5.4. Conclusion 92
REFERENCES 93
ACKNOWLEDGEMENTS 111
LIST OF PUBLICATIONS 112
CURRICULUM VITAE 115
EIDESSTATTLICHE VERSICHERUNG / AFFIDAVIT 116
Chapter 1
General Introduction
1.1
Phenomenology of Obsessive-Compulsive Disorder
Consider the following episode:
After drowning the last zip of freshly brewed hot coffee you are getting ready to leave the
apartment. What’s on the agenda for today? 8 o’clock, meeting with your boss; 9 o’clock,
meeting with a client to discuss business strategies for a new start-up; in the afternoon,
team meeting to implement new SOPs etc. As you are pulling out of your driveway it
suddenly hits you. Did I turn of the stove after making coffee? What if I left it on? Maybe
even the moka is still sitting on the stove. Should I go back and check? I’d be running late
though. But if I don’t check and it is still on, god knows what might happen? The whole
place might burn down! The doubt prevails and you go back to check. The stove is turned
off and the moka is safely sitting in the sink. You are sensing a feeling of relief and finally
drive off to work.
The above example or some variant thereof is most likely familiar to many of us. A quick
thought suddenly appearing, causing doubt and anxiety or distress leads us to perform a
certain behavior to reduce the distress. After performing the behavioral act, the distress
disappears and we move on. Something quite similar happens in case of
obsessive-compulsive disorder (OCD), though with a major and important difference. While a healthy
person will most likely be relieved after performing a specific act and be reassured that the
cause of discomfort has been resolved, patients suffering from OCD experience a short
temporary relief, only to find themselves in the same situation over and over again for
extended periods of time. They enter a circle of intrusive thoughts leading to distress and
anxiety which leads to ritualized behavior and temporary relief. The following section will
define the disorder more formally and report basic facts about symptoms, epidemiology,
1.1.1 Symptoms
OCD is a severely debilitating psychiatric disorder formally characterized by obsessions, i.e.
intrusive and unwanted recurrent thoughts, images, or urges, and compulsions, i.e. acts
that are performed in a repetitive manner. The performed acts can be mental and/or
behavioral in nature and normally aim at reducing feelings of anxiety and distress often
induced by obsessions. Furthermore the obsessions are recognized as products of the own
mind (American Psychiatric Association, 2013). While a small percentage of patients may
suffer either from obsessions or compulsions, the majority (>95%) report both symptoms
to co-occur (Shavitt et al., 2014). The disease presents with a broad variety of symptoms
from different symptom dimensions and is thus often considered to be rather
heterogeneous (Leckman et al., 1997; Pauls et al., 2014). Clinically, the most prevalent
symptom dimensions appear to be related to: contamination and cleaning; doubt about
harm and checking; unacceptable thoughts and mental rituals; symmetry and ordering;
cleanliness and washing as well as hoarding (Leckman et al., 1997; Williams et al., 2013).
Importantly, up to 80% of all patients present with more than just one symptom (Ruscio et
al., 2010) and cases of pure subtypes are extraordinarily rare, further highlighting the
disease’s heterogeneity (Mataix-Cols, Rosario-Campos, & Leckman, 2005). Despite the fact
that diagnostics of OCD is typically based solely on the presence of obsessions,
compulsions, and some form of distress or anxiety, a recent study points towards
impairments in various neuropsychological domains that partially predict differential
effects in response to cognitive behavioral therapy (CBT) or pharmacological treatment
(D'Alcante et al., 2012). Meta-analytic aggregation of neuropsychological impairments in
OCD however, revealed only small to medium effect sizes for various domains
(Abramovitch, Abramowitz, & Mittelman, 2013) and the authors generally question the
usefulness of neuropsychological alterations as potential endophenotypes.
1.1.2 Epidemiology, Disease Burden, and Comorbidity
With a one year prevalence of 1.2% among adults and a lifetime prevalence of 2.3%
(Ruscio et al., 2010), OCD is ranked as the fourth most common psychiatric disorder (Veale
& Roberts, 2014), with estimated annual costs in excess of 10 billion dollars in the US alone
(Eaton et al., 2008). Additionally, OCD has a profound impact on patient’s quality of life
which is comparable to the impact reported in schizophrenia and depressive disorders and
2013). First evidence also indicates a differential effect of obsessions and compulsions on
quality of life (Stengler-Wenzke et al., 2007). A recent study highlighted the significantly
increased risk of completed suicide (odds ratio=9.83) as well as attempted suicide (odds
ratio=5.45) in OCD patients compared to healthy controls (Fernandez de la Cruz et al.,
2017). The risk was reduced when adjusting for other psychiatric comorbidities,
nevertheless remained at a substantially high level, pointing to important interaction
effects of comorbidities for the disease. It is estimated that at least 50% of all patients
additionally suffer from one or more psychiatric disorders (Abramowitz, Taylor, & McKay,
2009). The most common comorbid psychiatric disorders among OCD patients are major
depressive disorder (MDD) with over 25%, obsessive-compulsive personality disorder and
various forms of anxiety disorders (Brakoulias et al., 2017). However, accounts of other
comorbid disorders are frequent. For example, reported co-occurrence rates of OCD and
attention deficit/hyperactivity disorder (ADHD) have been rather inconsistent with
estimates ranging between 0-60%, with variations likely due to methodological,
theoretical, and phenomenological differences (Abramovitch et al., 2015). Additionally,
Pallanti et al. (2011) reported a relationship between treatment non-responders and
comorbid disorders while Hasler et al. (2005) provide evidence for a relationship between
comorbid disorder and different symptom dimensions that patient’s are suffering from.
Finally, Hofer et al. (2018) reported that for adolescent and young adults prior OCD is a risk
factor for developing bipolar disorder, bulimia nervosa, and anxiety disorders. Taken
together, OCD can be described as a common psychiatric disorder with high impact on
well-being and functioning that is commonly associated with other comorbid disorders.
1.1.3. Course
Disease onset is typically gradual (Abramowitz et al., 2009), however accounts of patients
developing OCD like symptoms within weeks after traumatic brain injury (TBI) have been
published (Childers et al., 1998). For a general overview of brain injuries associated with
the development of OCD see Rydon-Grange and Coetzer (2015). In the US, the average age
of onset is 19.5 years with more than 25% of all patients reporting an onset as early as 14
years or younger (Ruscio et al., 2010). Results from a large international collaboration
study reported the average onset to be about 18 years (Brakoulias et al., 2017). The
distribution of age of onset typically reveals a bimodal distribution with an early peak in
is an ongoing debate regarding a sensible cut-off to define early and late onset OCD
(Anholt et al., 2014). Interestingly, late onset OCD (age at onset > 35 years) was found to
be rather uncommon with fewer than 15% of all cases (Rasmussen & Eisen, 1992).
Additionally, Grant et al. (2007) provided first evidence of potentially better response to
CBT in late onset OCD. If untreated, OCD has in most cases a chronic course (Abramowitz
et al., 2009). In adults, remission rates without treatment are comparably low, i.e. about
20%, as reported by Skoog and Skoog (1999) in a forty year follow-up study. Similarly, a
further study comprising over 200 patients found a partial recovery in only 22.1% of all
patients over a five-year course without treatment (Eisen et al., 2013).
1.1.4 Treatment Options
The two most common treatment options for OCD are pharmacotherapy and various forms
of psychological treatment. Meta-analytic results of randomized controlled trials provide
evidence for efficacy of selective serotonin reuptake inhibitors (SSRIs) with a mean effect
size of 0.91 (Eddy et al., 2004) and thus SSRIs are recommended as the first line of
pharmacological treatment, though other pharmacological treatment options are
available, e.g. clomipramine and venlafaxin. On the other side of the spectrum, CBT was
identified to be effective (Abramowitz, 2006) with effect sizes of 1.31 for comparisons
between patients treated with CBT and waiting-list patients (Ost et al., 2015).
Nevertheless, Eisen et al. (2013) report relapse rates of 59% for pharmacologically treated,
remitted patients, while rates for patients treated with CBT are found to be lower but still
undesirably high (O'Neill & Feusner, 2015). For an extensive review of both treatment
approaches see Abramowitz et al. (2009). Apart from CBT and pharmacological treatment,
there has been an increased interest in alternative options such as deep-brain stimulation
and surgical intervention for treatment resistant cases as well as prescription of
neuroleptics (Hirschtritt, Bloch, & Mathews, 2017). Furthermore, preliminary evidence
points towards the potential benefit of transcranial direct current stimulation for
1.2. Pathogenesis and Neurobiology of OCD
One of the very first accounts of pharmacological intervention for OCD, using the
mono-amine oxidase inhibitor phenelzine, dates back to the late 1960’s. In a case study, Annesley
(1969) mentions: “The discovery that certain neurotic illnesses will respond specifically to
drugs implies a biochemical basis for some of these disorders”. It took some 20 years until
an article called: “Neurobiology of obsessive compulsive disorder: a possible role for
serotonin” appeared in the Journal of Clinical Psychiatry (Winslow & Insel, 1990), explicitly
using the word “neurobiology” in combination with OCD. More than 25 years later and
mainly driven by the advent of in-vivo neuroimaging methods but also results from other
fields such as pharmacological studies, genetics as well as animal model research etc.,
hundreds of articles have been published, aiming at further illucidating the neurobiological
foundations of OCD by constantly refining disease models. Current accounts of
pathogenesis identify genetic and environmental factors as well as neurobiological
alterations as key factors. The following section will briefly describe aspects of genetics and
environmental factors before providing a more extensive description of the prevailing
neurobiological model, taking into account historical evidence on functional as well as
structural brain alterations. Due to the scope of this manuscript, the descriptions will be
selective and tend towards results based on human neuroimaging studies. Nevertheless,
various lines of evidence derived from multiple methods have certainly influenced the
current conceptualization of circuitry thought to be involved in OCD pathophysiology.
1.2.1 Genetic and Environmental Factors
Due to the fact that SSRIs are considered the first-line pharmacological treatment in OCD
with proven efficacy, there has been a substantial interest in examining serotonin
transporter polymorphisms. A recent meta-analysis of genetic association studies indeed
reported an association of such polymorphisms with OCD as well as a gender specific
polymorphism involving catecholamine modulation with trend significant results for
dopamine- and glutamate-related polymorphisms (Taylor, 2013). However, association of
genes was overall modest. Furthermore, it appears likely that there are substantial
interactions between effects of multiple genes and phenotypic heterogeneity typically
observed in OCD (Sinopoli et al., 2017). Meta-analysis of twin studies indicated that the
effects as well as non-shared environmental factors (Taylor, 2011) pointing towards a
complex interplay of biopsychosocial factors. For an attempt to integrate genetic,
environmental, and neurobiological findings into a comprehensive model, see Pauls et al.
(2014).
1.2.2 A Neurobiological Model of OCD
Several lines of evidence from multiple fields of study were aggregated over the years to
form what is now often referred to as the cortic-striato-thalamo-cortical (CSTC) model of
OCD. As can already be derived from the name, the model implicates several key regions
such as basal ganglia (BG), various cortical regions, and thalamus. Furthermore it
emphasizes the circuit character due to anatomical connections forming a loop.
Historically, the BG were considered to be merely responsible for the “automatic execution
of learned motor plans” (Marsden, 1982) and thus simply labeled a motor control organ. In
line with this interpretation, the idea of a BG involvement in cognitive or even emotional
processing was typically rejected. With a substantial increase in research efforts and the
integration of various anatomical and physiological findings, this traditional view started to
change. A seminal review by Alexander, DeLong, and Strick (1986) eventually shifted the
concept of BG being a system only subserving motor functions towards being a system of
segregated circuits with potentially different functional properties. This change in concept
brought about strong implications also for clinical research. Namely, that damage to
circuits may lead to alterations not only in motor behavior but possibly even cognition.
Furthermore, it was suddenly conceivable that damage within a segregated circuit may
result in a different outcome, i.e. symptom, than damage located within another circuit.
Thus, symptoms were not necessarily limited to the motor domain. Soon after this
conceptual shift, these ideas were absorbed by clinical researchers interested in OCD as
well as other disorders and it was hypothesized that a pathogenetic mechanism of OCD
may be a dysfunction in BG / striatal and thalamocortical circuits, though various authors
favored slightly different structures and functional relationships in their accounts to
describe neurobiological models of OCD (Insel, 1988; Modell et al., 1989; Rapoport & Wise,
1988). Fueling this new focus of research were studies conducted in OCD using various
newly established neuroimgaing methods such as computed tomography (CT) and
magnetic resonance imaging (MRI). While the first CT study conducted in OCD (Insel et al.,
multiple studies reported not only alterations in VBR (Behar et al., 1984) but also
alterations in caudate volume (Luxenberg et al., 1988) and ventricular volume (Stein et al.,
1993). Similarly, MRI-based studies revealed volume alterations mainly in caudate
(Robinson et al., 1995; Scarone et al., 1992) and ACC (Garber et al., 1989). However, some
studies also reported no differences between patients and controls (Aylward et al., 1996;
Kellner et al., 1991). Altogether, MRI and CT studies appeared to confirm alterations in BG
to be present in OCD. In parallel, new imaging methods provided results strongly impacting
the conceptualization of neurobiological models of OCD. While CT as well as MRI only
provided information about structural measures, PET and brain perfusion single-photon
emission computed tomography (SPECT) had the advantage of deriving information about
metabolism, a marker essentially related to brain function. Now it was possible to not only
study structural abnormalities between patient and control groups, but also derive
information about functional differences as well as observe functional changes in response
to therapy or symptom provocation. A seminal study conducted using positron emission
tomography (PET) reported increased metabolic rates in orbital gyrus and caudate (Baxter
et al., 1987). The finding of increased ortbital gyrus metabolisms has since been replicated
multiple times (Baxter et al., 1988; Nordahl et al., 1989; Sawle et al., 1991) with some
studies also indicating alterations in various other regions such as the anterior cingulated
cortex (ACC) (Perani et al., 1995; Swedo et al., 1989). Furthermore pre-/post-treatment
PET studies found activity in orbitofrontal cortex (OFC) to decrease with pharmacological
intervention. For a comprehensive review of PET and SPECT studies as well as early
structural MRI studies, see Saxena et al. (1998). Several studies additionally found
decreased metabolism in caudate (Benkelfat et al., 1990; Mindus & Nyman, 1991; Saxena
et al., 1999) and loss of pathological correlations between key regions, i.e. OFC, thalamus
and caudate (Baxter et al., 1992; Schwartz et al., 1996). Taken together, multiple
independent studies found increased orbitofrontal metabolism in comparison to healthy
subjects while there was evidence for increased caudate metabolism as well as
involvement of thalamus.
As a general framework, fronto-striatal-thalamic circuits are considered to possess a direct
and an indirect pathway (Saxena & Rauch, 2000). Originating within the frontal cortex,
extensive projections excite striatal regions. Subsequently, a direct, inhibiting pathway
projects to the globus pallidus interna (GPi) and substantia niagra (SNr) that in turn has an
inhibiting effect on medial dorsal thalamus. Thus striatal inhibition of the inhibitory GPi
pathway is based on inhibiting striatal projections to globus pallidus externa (GPe) and
subthalamic nucleus that in turn send inhibiting projections directly to GPi and SNr and
thus enhance the inhibiting effect on medial dorsal thalamus, effectively inhibiting
feedback to cortex. Additionally, Saxena and Rauch (2000) propose that different
sub-regions of frontal cortex project to separate striatal target sub-regions, with projections from
supplementary motor area (SMA) targeting putamen, dorsolateral prefrontal cortex
(DLPFC) targeting the dorsolateral head of caudate nucleus, OFC targeting the
ventromedial head of caudate, and ACC, posterior cingulate (PCC), and parahippocampal
gyrus projecting to nucleus accumbens. Translating these basic features of
fronto-striatal-thalamic circuitry to OCD pathophysiology, Saxena and Rauch (2000) proposed a response
bias towards various stimuli in OCD that is mediated by frontal-subcortical circuits. In
healthy condition the processing of stimuli is assumed to be mediated via the direct
pathway with a counter balancing influence of the inhibiting, indirect pathway. In OCD
patients, the authors suggest the existence of an imbalance between direct and indirect
pathways in favor of the direct excitatory pathway. As a result, stimuli draw attention to
themselves resulting in the inability to switch to other forms of behavior while also
resulting in performing behaviors in a ritualistic manner. This mechanism is supposed to be
responsible for the production of findings of hyperactive circuitry typically reported in
neuroimaging studies. About a decade later, the framework of CSTC circuitry involvement
is still considered the main foundation of neurobiological models of OCD. In a seminal
paper, Milad and Rauch (2012) summarized the state of the art regarding the subsystems
assumed to be involved in the pathophysiology of OCD. Additionally, they discuss the role
of various regions outside the classical CSTC circuits regarding disease mechanisms and
argue for a much needed extension of the classical framework (for a graphical
representation of their model, see Figure 1). In this conceptualization, there are three
explicitly separated circuits, each related to specific functions: the affective circuit linked to
affect and reward processing; the dorsal cognitive circuit linked to working memory and
executive functions; the ventral cognitive circuit linked to motor and response inhibition.
However, Milad and Rauch (2012) claim the CSTC model to be insufficient and suggest
other regions to be of importance. One critique involves the assumption of segregated
fronto-striatal circuits. Especially in case of the reward circuitry, this assumption was
shown to be flawed and connections are indeed more integrated than previously assumed
Figure 1. Illustration of components and pathways implicated in circuitry important for the
pathophysiology of obsessive-compulsive disorder. Abbreviations: ACC, anterior cingulate
cortex. DLPFC, dosrolateral prefrontal cortex. nc. accumbens, nucleus accumbens. OFC,
orbitofrontal cortex. vmPFC, ventromedial prefrontal cotex. Modified from Milad & Rauch
(2012).
One main aspect highlighted by Milad and Rauch (2012) refers to apparently differential
functional aspects of OFC. Even though findings are somewhat contradictory regarding the
directionality of activity alterations, i.e. hyper- vs. hypoactivity, the authors nevertheless
posit, that lateral OFC (lOFC) and medial OFC (mOFC) are most likely involved in different
functional impairments in OCD. Additionally, the ACC has been described as a region
important for error monitoring (Bush et al., 2002; van Veen & Carter, 2002) and conflict
detection (Gehring, Himle, & Nisenson, 2000). In OCD patients, a hyperactivity has been
described during tasks assessing interference processing indicating abnormal error
processing capabilities that may mediate decision making (Schlosser et al., 2010).
Furthermore, the ACC has been implicated in fear conditioning processes, i.e. activity in
dorsal ACC was reported to correlate with galvanic skin response during fear conditioning.
Here, galvanic skin response is taken as a physiologic proxy for fear learning (Linnman et
al., 2011; Milad et al., 2007). Finally, Milad and Rauch (2012) suggest to further clarify the
support by a meta-analysis evaluating emotional processing in OCD (Thorsen et al., 2018).
Here, the authors identified fMRI- as well as PET-based studies assessing differences in
responses between emotionally valenced and neutral stimulation. Compared with healthy
controls, in OCD patients, an increase in activity was reported for bilateral amygdala, with
stronger activation in unmedicated patients. Furthermore, activation in OFC, ACC and
precuneus was related to symptom severity while comorbidity with mood and anxiety
disorders was related to higher activation in amygdala, putamen, as well as insula and
decreased activation in left amygdala and right ventro-medial prefrontal cortex (vmPFC).
Taken together, while there is no doubt regarding the general involvement of CSTC circuits
in the pathophysiology of OCD, different accounts that emphasize slightly varying
structures and functional relationships have been put forward over the years (Aouizerate
et al., 2004; Baxter et al., 1996; Del Casale et al., 2011; Huey et al., 2008; Insel, 1988; Kwon
et al., 2009; Menzies et al., 2008; Milad & Rauch, 2012; Modell et al., 1989; Rapoport &
Wise, 1988; Saxena, Bota, & Brody, 2001; Saxena et al., 1998; Saxena & Rauch, 2000). The
current trend appears to facilitate research efforts aiming at elucidating the role of brain
regions outside the classical CSTC circuits. This is for example reflected in a recent proposal
of a neurobiological model for compulsive behavior put forward by van den Heuvel et al.
(2016). Here a total of five circuits are proposed. Three of them are in accordance with the
model proposed by Milad and Rauch (2012), namely the dorsal and ventral cognitive circuit
as well as the affective circuit. As an extension, van den Heuvel et al. (2016) incorporate
two additional circuits, i.e. a sensorimotor circuit connecting SMA, putamen and thalamus
that is supposed to subserve stimulus-response based habitual behavior and a
fronto-limbic circuit incorporating the amygdala and connections to vmPFC and thalamus,
assumed to be important for processes of extinction.
In the past, OCD has also been discussed as a disorder featuring a neurodevelopmental
component (Huyser et al., 2009; Rosenberg & Keshavan, 1998). As the development of
gyrification has been shown to occur largely between the last two trimesters of gestation
until about one year of age (Armstrong et al., 1995), measures thereof appear to be
potentially useful markers of neurodevelopment. In line with this assumption, several
studies provided evidence of alterations of gyrification in disorders associated with a
neurodevelopmental component such as autism spectrum disorder (Ecker et al., 2016) and
schizophrenia (Palaniyappan & Liddle, 2012; Palaniyappan et al., 2016; Palaniyappan et al.,
with many studies reporting hypogyrification (Rus et al., 2017; Shim et al., 2009; Wobrock
et al., 2010) while others report hypergyrification (Fan et al., 2013).
1.2.3 Structure – Symptom Relationship in OCD
There is now accumulating evidence for structural brain alterations in OCD. For reviews
and meta-analyses on white matter alterations see Fontenelle et al. (2009), Piras et al.
(2013), Koch et al. (2014); for reviews on gray matter alterations see Radua and
Mataix-Cols (2009), Boedhoe, Schmaal, Abe, Alonso, et al. (2017), Boedhoe, Schmaal, Abe, Ameis,
et al. (2017), Hu et al. (2017); for a combined review of GM and WM alterations based on
VBM studies see Piras et al. (2015). Besides descriptive findings of structural alterations,
various studies assessed whether these alterations are going along with clinical measures
such as symptom severity or specific symptoms. Meta-analytic results by Rotge et al.
(2009) reveled a relationship between symptom severity and thalamic volumes. Alvarenga
et al. (2012) report the symptom dimension “aggression” to positively correlate with GM
volumes of left parietal cortex, while volumes of left insula, putamen and inferior OFC
were negatively correlated. Scores for the “sexual/religious” dimension positively
correlated with right lateral OFC as well as DLPFC and negatively correlated with ACC.
Finally, hoarding scores positively correlated with left OFC while a negative correlation
with parahippocampal gyrus was reported. Using a different instrument as well as
approach to compute scores, van den Heuvel et al. (2009) similarly describe a relationship
between different symptom dimensions and distinct brain regions. Here, GM volumes in
caudate as well as WM volumes in parietal regions correlated with contamination/washing
symptoms. Harm/checking symptoms correlated negatively, with GM and WM volumes in
the temporal pole. Additionally symmetry/ordering symptoms correlated negatively with
GM volume in right motor cortex, insula and parietal cortex, while a positive correlation
with temporal GM and WM was found. Finally, symmetry/ordering symptoms were
reported to correlate with overall GM and WM volumes. Gilbert et al. (2008) provide
evidence for a negative correlation between washing symptoms and Brodman area 6, i.e.
frontal cortex. Clearly, studies use different measures to assess symptoms and report
various brain regions to be associated with different symptoms and additionally in
sometimes contradicting directions. Also, while several studies do report such correlations
(Fontenelle et al., 2011; Ha et al., 2009; Lochner et al., 2012) others do not (Nakamae et
differences in OCD patients conducted to date reported alterations to be found in the
hippocampus as well as pallidum (Boedhoe, Schmaal, Abe, Ameis, et al., 2017) while other
subcortical regions typically assumed to play a major role in OCD were not found to display
altered volumes. Additionally, no relationships between volumetric alterations and
symptoms were described. In general, answering the question whether and how structural
alterations are related to symptoms may be useful to identify and differentiate between
state and trait markers for the disease. Trait markers are typically defined as a
characteristic that allows diagnosing a disease while state markers refer to characteristics
that are related to a process of a disease and reflect current severity (Davis et al., 2015). In
summary, the currently available data does not allow to draw definitive conclusions on
state or trait markers in OCD, nevertheless it appears promising to conduct further
research, taking into consideration different approaches in order to disentangle potential
1.3 Methodological Considerations
Neuroimaging methods such as CT, MRI, and diffusion weighted imaging (DWI) are
representatives of only one class of methods available to study brain morphology. Their
main strength clearly stems from the human in-vivo applicability. However, in its current
form, these methods are only able to provide information on the macro- and mesoscopic
level of brain structure with rather limited capabilities to indirectly infer regionally specific
information on microstructure (Lerch et al., 2017). Thus, this limitation should be
considered when interpreting data and drawing conclusions. Apart from issues regarding
the acquisition and meaning of measured signals, a major component of studying brain
morphology involves complex analyses techniques, e.g. reconstruction algorithms as well
as statistical concepts. The following section addresses three aspects: firstly, it will provide
a brief overview of selected measures and analysis strategies typically employed to study
brain morphology. Secondly, it introduces recent advances in studying brain morphometry
in the framework of network science and graph theoretical concepts. For the following
sections, the focus will be mainly on data derived from in-vivo human MR-imaging. Thirdly,
a brief overview of the measures and methods used to study brain morphometry in the
current studies will be presented.
1.3.1 Classical Approaches to Study Brain Morphology
1.3.1.1 Volume and Surface Based Methods
To date, the most prevalent approaches to examine MRI-based morphology and
alterations thereof can be differentiated into volume and surface based methods (Clarkson
et al., 2011). Brain data derived from MRI is typically stored in three dimensional matrices.
Each element of such a matrix is considered a voxel, i.e. the three dimensional analog to a
pixel, that represents information about some anatomically relevant parameter.
Voxel-based methods directly operate on the elements of this matrix. Though transformations
(linear as well as nonlinear) are common, the “units” being analyzed will always remain
voxels. As an example, in the framework of voxel-based morphometry (VBM), images are
spatially normalized into a common space using linear and nonlinear transformations,
segmented into various tissue classes and spatially smoothed before computing statistics
on the voxel level (Ashburner & Friston, 2000; Whitwell, 2009). Similarly, when working
deriving brain morphological parameters in three dimensional space (Dale, Fischl, &
Sereno, 1999; Fischl, Sereno, & Dale, 1999). Instead of voxels, the “units” being analyzed
are vertices. Nevertheless, analyses will typically be conducted on individual data points
reflecting an anatomical property. Examples of surface based morphometry can be found
in studies of cortical thickness (Fischl & Dale, 2000), a measure that is computed
vertex-wise from the distance between two surfaces, i.e. gray / white matter boundary and gray
matter / cerebrospinal fluid boundary.
1.3.1.2 Commonly Used Statistical Analysis Framework
The most prevalent statistical framework used to assess and compare morphological
properties, derived either from volume or surface based methods, is the GLM, i.e. general
linear model (Christensen, 2011). This statistical approach yields information about local
morphological properties only, since one linear regression model is fitted to every single
voxel or vertex, thus resulting in statistical maps with parameters / p-values for each voxel
within a volume, or vertex for each surface. For both, volume as well as surface based
approaches, the interrelation between measures from different voxels or vertices is not
specifically considered. While these approaches are entirely valid in its own right and have
provided many new insights into structural brain alterations associated with OCD (Piras et
al., 2013; Piras et al., 2015) as well as other disorders (Whitwell, 2009), they nevertheless
do not allow to draw inferences about the interplay between various anatomical regions.
Especially in light of neurobiological models of OCD pathopyhsiology that emphasize a
circuit character with interdependent anatomical regions, a framework that has the
capacity to explicitly model such interdependencies could potentially be very fruitful and
informative.
1.3.1.3 Assessing Relationships Between Symptoms and Morphological Alterations
The majority of studies conducted in OCD aimed at establishing a relationship between
structural alterations and different symptoms and/or symptom severity. In general, various
measures, e.g. cortical thickness, volume etc., are typically correlated with scores from
questionnaires aiming at identifying significant correlations. Two slightly different
approaches are commonly used in this regard. One possibility is correlating the severity on
each symptom is treated as an independent quantity and the interrelation between
various symptom types is not further addressed (Carmona et al., 2007; Matsumoto et al.,
2010; Park & Jeong, 2015; Tang et al., 2015; Zarei et al., 2011). Another way is to use
information either from questionnaires that specifically aim at deriving information about
symptom dimensions (Rosario-Campos et al., 2006) such as contamination, aggression or
symmetry, or to combine information from various subscales into symptom dimensions,
for example symmetry/ordering or harm/checking (Mataix-Cols et al., 1999; Okada et al.,
2015; van den Heuvel et al., 2009). In both cases, the focus is on individual symptoms or
symptom dimensions. However, it is conceivable that the entire symptom profile of a
patient may be related to morphological alterations. Hence, taking into consideration
interrelations between the various symptoms/symptom dimensions might be of value.
1.3.2 Network-science Inspired Approaches to Study Brain Morphology
In 2005, several researchers independently proposed to use the term ‘connectome’ to
refer to a comprehensive map of all structural elements and their connections, together
forming the human brain (Hagmann, 2005; Sporns, Tononi, & Kotter, 2005). This
conceptualization as an underlying foundational principle sparked tremendous research
interest eventually leading to the field of connectomics. As mentioned above, frameworks
that have the capacity to model networks of anatomical (and functional) relationships are
highly desirable. With rapid progress in the field of complex network analysis and the
impact of network science as a transdisciplinary theory (Boccaletti et al., 2006; Newman,
2010), translation of principles and practices to the study of brain networks are appearing
rapidly while constantly increasing in scope and size (Bullmore & Sporns, 2009). The
translation of concepts was dramatically simplified by conceptualizing human brain
networks in terms of connectivity matrices1, therefore allowing to directly apply concepts
that were developed in the mathematical framework of graph theory and largely based on
working with matrices. The main workhorse for network-based analyses of brain data is
therefore the mathematical framework of graph theory, which is briefly introduced below.
Additionally, general approaches to graph definition and assessment of brain networks are
addressed and the clinical impact of network-based studies is outlined.
1
Here, a connectivity matrix is a square matrix in which each element Aij indicates the presence or
1.3.2.1 General Framework
Conceptualizing the brain as a network and applying graph theoretical concepts for
analyses requires the definition of graphs, i.e. a set of nodes and edges. Nodes are the
basic building blocks of the network, while edges represent some form of connection
between the nodes, together resulting in an abstract representation of the network in
question using matrix notation. This framework is rather flexible as the definition of nodes
can range all the way from single cells, or even smaller, up to macroscopically defined
anatomical regions such as gyri. Likewise, the definition of edges can be based for example
on synaptic connectivity derived from tracing studies, measures of structural association
derived from DWI-based fiber tracking, or even correlation between blood-oxygen-level
dependent (BOLD) signals indicating a statistical association of functional coupling
between nodes (for a thorough introduction to the framework as well as applications to
brain network analyses see Sporns (2012); for a comprehensive and more technical
introduction see Fornito, Zalesky, and Bullmore (2016).
1.3.2.2 Construction of Brain Networks
In light of the explosion of research conducted on brain function and the ever increasing
applications of network-based analyses to functional networks, it nevertheless remains
vital to also study structural brain networks spanning all levels from molecular to the
macro scale. In the end “structural connectivity provides an obligatory foundational model
for understanding functional localization at molecular, cellular, systems, and behavioral
organization levels” (Swanson & Bota, 2010). In case of MR-derived structural networks,
multiple approaches are commonly used for graph construction (Griffa et al., 2013). Nodes
are typically defined on the basis of parcellated high resolution anatomical imaging data
according to predefined atlas-based regions of interest. Atlases in turn are commonly
based on either anatomical landmarks such as sulci and gyri, or cytoarchitectonic maps.
Recent developments aim at parcellating the brain based not only on anatomical
landmarks or cytoarchitecture, but to provide a multi-modal parcellation scheme
incorporating landmarks and cytoarchitecture, as well as prior knowledge of function and
connectivity (Glasser et al., 2016). The way in which an edge is defined, in turn determines
what kind of graph is constructed and thus what type of analyses methods and algorithms
can be applied. The most commonly defined graphs are either undirected or directed and
example, edges defined as synaptic connections, i.e. at the microscopic level, inherently
carry information about the directionality of a connection, whereas edges defined on the
basis of tractography only carry undirected information. Similarly, a graph can contain
information about the connection strength, e.g. number and type of synapses, rendering it
to be weighted, or can simply indicate whether a connection is present or not, rendering it
binary. The definition of edges, measuring some form of connectivity, can be broadly
separated into two approaches, though other approaches exist. Firstly, it is possible to
derive measures of connectivity on the basis of the concept of structural covariance
(Alexander-Bloch et al., 2013). Structural covariance refers to the observation that in
populations, quantification of specific morphological properties within one brain region
typically covaries with the same property in other brain regions, e.g. cortical thickness
values measured in Broca’s area across subjects covary with cortical thickness values in
Wernicke’s area (Lerch et al., 2006). Secondly, structural connectivity can be inferred from
DWI by applying tractography algorithms for example to model a tensor (as is done in DTI,
see Mori and Zhang (2006)) that yields information on the directionality of diffusion within
a specific voxel, thus allowing the reconstruction of main fiber bundles in the brain (Soares
et al., 2013). In order to derive a proxy for structural connectivity between two brain
regions, a fiber tracking algorithm may be initiated from a parcellated brain region, i.e.
node of the graph, following the principle diffusion direction indicated by the tensor in
each voxel. If there is a continuous connection between the initial node and some other
node in question, the two regions are assumed to be connected (Lazar, 2010). Repeating
this approach for every possible combination of nodes allows to reconstruct a
macroanatomical whole brain connectivity matrix (Guye et al., 2010). The resolution is
directly related to the parcellation scheme, i.e. a fine-grained parcellation increases the
resolution while a gross parcellation scheme decreases resolution. The major difference
between networks based on structural covariance and those based on diffusion weighted
imaging, is the fact that structural covariance can be only measured across a group of
subjects, while diffusion weighted imaging allows to infer connectivity within a single
subject. This limits the possibility to use structural covariance to derive subject-specific,
1.3.2.3 Assessment of Brain Networks
Historically, two seemingly opposing concepts regarding the functional principles of the
brain have been widely discussed. On the one hand, proponents of localizationism
emphasize that in the brain, specific functions are localized in specific modules, e.g. Broca’s
region is functionally specialized for speech production. On the other hand, the standpoint
of holisms, conceptualizes the brain as a system that in its entirety is important for
producing behavior and in which a function cannot be assigned exclusively to one region
alone (Kanwisher, 2010; Northoff, 2014). Interestingly, these approaches can be related to
organizational properties that are simultaneously found in the brain, namely functional
segregation, and functional integration (Sporns et al., 2005; Tononi, Sporns, & Edelman,
1994). Following these two fundamental organizational principles, a wide array of
measures has been developed to quantitatively assess brain network topology in terms of
functional segregation and integration. Measures of segregation are aiming at the
quantification of groups or modules that are densely interconnected, thus allowing for a
high degree of specialization, for example the clustering coefficient that can be computed
for nodes as well as for an entire network. Measures of integration are typically based on
finding shortest paths, i.e. the shortest number of steps needed to traverse between two
specific nodes (Rubinov & Sporns, 2010). Relating both measures in terms of a ratio yields
a global metric called small-worldness, a concept that was introduced by Watts and
Strogatz (1998). In their seminal work they described a graph to possess the attribute of
small-worldness if many nodes are not direct neighbors but rather cluster together, i.e.
average clustering is rather high, while at the same time, every node can be reached via
few steps, in other words the path length is rather low. The principle of small-worldness
was shown to apply to a myriad of networks (Newman, 2010) including the brain (Bassett
& Bullmore, 2006). Taken together, the brain is an organ inherently combining two
fundamental organization principles, namely functional segregation as well as functional
integration in order to allow for flexibility in cognition as well as behavior (Deco et al.,
2015). A vast number of measures have been used to characterize various properties of
segregation and integration capabilities of brain networks (Rubinov & Sporns, 2010;
1.3.2.4 Clinical Impact of Network-based Studies
In general, the assessment of structural brain networks can be conducted in healthy brains
in order to infer patterns of connectivity and also inform underlying relationships with
patterns of brain dynamics (Sporns, 2013a). Furthermore, the same methods can be
applied to examine psychiatric populations or patients suffering from neurological
disorders. Traditionally, studies examining structural as well as functional brain imaging
data in psychiatric populations often report changes in a multitude of different, discrete
brain regions. However, interpreting focal changes in isolation may ignore important and
relevant relationships between regions, especially in light of the massive
interconnectedness of brain regions resulting in complex circuitry (Hulshoff Pol &
Bullmore, 2013). In this regard, network-based approaches allow us to draw conclusions
about brain organization and pathological mechanisms that extend beyond treating
regions in isolation with the potential to derive new theories about aetiopathology (Fornito
& Bullmore, 2015). An ever increasing body of literature suggests that brain disorders
indeed go along with alterations in structural as well as functional large-scale brain
networks (Fornito, Zalesky, & Breakspear, 2015; Griffa et al., 2013; Wen, He, & Sachdev,
2011). Consequently, recent endeavors led to the foundation of pathoconnectomics, i.e.
the mapping of abnormal brain networks, under the assumption that psychiatric disorders
are in fact disorders that manifest on the level of networks and therefore require an
examination of network level organization (Rubinov & Bullmore, 2013). In order to better
understand the underlying pathogenetic principles and meachnisms of psychiatric
disorders, different perspectives can be utilized to examine networks. More precisely,
networks can be interrogated at the circuit level, on the level of topology or by employing
hypothesis-free, data-driven approaches on a connectome-wide basis (Fornito & Bullmore,
2015). As an example of the circuit level perspective, Seeley et al. (2009) could show that
specific dementia syndromes differentially target functional connectivity networks.
Regarding network topology, interesting results regarding the importance of hubs and
their implication in a broad range of different brain disorders were provided by (van den
Heuvel & Sporns, 2013), while the data-driven approach taken in connectome-wide studies
allows for unbiased assessment of global network characteristics. As an example, Zalesky
et al. (2011) could show that white matter network efficiency in schizophrenia was not
associated with performance regarding intellectual ability while it was associated in
1.3.3 Methods and Measures used in Current Studies
The following section briefly describes the methods used to construct the brain graphs
analyzed in Project 1 and 2 as well as the measure used in project 3. Of note, the
descriptions are conceptual and several intermediate steps are not explicitly mentioned.
All three projects described in this thesis strongly draw on Freesurfer, a software suite
designed to allow processing and analysis of brain imaging data (Dale et al., 1999; Fischl et
al., 1999). In short, a high resolution structural T1-weighted image (Figure 2A) was used to
identify gray/white matter (Figure 2B, colored in red) as well as gray matter/pial
boundaries (Figure 2B, colored in green). Based on these boundaries, two corresponding
surfaces were reconstructed for each subject (Figure 2C). Subsequently the brain was
parcellated according to an atlas into discrete cortical and subcortical brain regions (Figure
2D). In case of Project 3, hippocampus volumes were computed for each subject based on
subcortical volumetric data (lower part of Figure 2D). For Project 1 and 2, the parcellated
brain regions were defined as the nodes thus allowing the derivation of connectivity
matrices (Figure 2E). Figure 3 illustrates the derivation of the connectivity measure used
within Project 1 and 2. In both cases, the resulting connectivity matrices were depicting
For Project 1, the edge weights were defined on the basis of fiber tracking algorithms that
derive information about white matter tracts on the basis of DWI data. More specifically,
for every possible combination of nodes, an algorithm is initiated that follows the principle
diffusion direction derived by fitting a tensor to each voxel’s FA data and tracking is
stopped in accordance with various termination criteria (Figure 3A). For Project 2, the edge
weights were defined on the basis of local gyrification indices (lGI). The index is computed
by dividing the pial surface area under a ROI that is adjacent to the pial surface by the size
of the ROI itself (Schaer et al., 2008). Thus, a large index indicates that the surface area
below the ROI is large when compared to the ROI itself, pointing towards stronger cortical
convolution, i.e. gyrification (Figure 3B). lGIs were computed for evenly spaced vertices
(white dots in top row of Figure 3B) over the cortical surface, and subsequently averaged
within nodes. After acquiring the lGIs and adjusting their values for the effects of various
covariates, a correlation between every possible pair of nodes was computed and
1.4 Aims of the Thesis
The overall goal was two-fold. Firstly, to employ innovative brain network modeling and
analyses techniques to examine how alterations in MRI-derived structural brain networks
may inform pathophysiological models of OCD as well as aiming at generating new
hypotheses that can potentially be examined using other morphological techniques. To this
end, connectome-wide anatomical networks were constructed based on parcellations of
high resolution T1-weighted MRI sequences and two different measures of structural
connectivity. In the first project, connectivity networks were derived from DTI tractography
allowing to draw inferences about macroanatomical, white matter structural connectivity
differences as well as topological properties. In the second project, the framework of
structural covariance was applied using a network based approach in conjunction with
local gyrification indices as a measure related to neurodevelopmental aspects. Probing
whether alterations in gyrification based networks exist can potentially inform
neurobiological models of OCD in this regard. Secondly, in light of recent findings regarding
hippocampal volume alterations in OCD (see section 1.2.3) it was examined whether the
consideration of symptom profiles allowed to identify relationships between hipopcampal
volumes and symptom related parameters that extend beyond simple associations found
Chapter 2
Project 1: “Connectomics-based
structural network alterations in
obsessive-compulsive disorder”
The current chapter includes the research article “Connectomics-based structural network
alterations in obsessive-compulsive disorder”. This article provides evidence for an
involvement of mainly temporo-limbic regions in OCD that are typically associated with
emotion processing by analyzing brain networks derived from structural T1-weighted MRI
data in conjunction with (DTI). It thus provides further support of the need to revise the
classical model of pathophysiology. The article was published in Translational Psychiatry in
2016.
Contributions:
Authors: Tim Jonas Reess, Oana Georgiana Rus, Ruben Schmidt, Marcel A. de Reus, Michael
Zaudig, Gerd Wagner, Claus Zimmer, Martijn P. van den Heuvel, Kathrin Koch
The author of this thesis is the first author of the manuscript. T.J.R., K.K., O.G.R., with the
help of M.Z., C.Z., and G.W. conceived the experiment. T.J.R. and O.G.R. recruited
participants and conducted data acquisition. T.J.R., R.S., M.A.D.R, M.P.v.d.H performed
analyses and contributed analytic tools. T.J.R. wrote the manuscript in consultation with
O.G.R., R.S., M.A.d.R., M.Z., G.W., C.Z., M.P.v.d.H., K.K. All authors discussed the results
Chapter 3
Project 2: “Network-based
decoupling of local gyrification in
obsessive-compulsive disorder”
The current chapter includes the research article “Network-based decoupling of local
gyrification in obsessive-compulsive disorder”. This article, for the first time, aimed at
analyzing gyrification-based structural covariance networks in OCD. Results indicated
widespread alterations in OCD that are potentially related to time-locked
neurodevelop-mental periods. The manuscript was published in Human Brain Mapping in 2018.
Contributions:
Authors: Tim Jonas Reess, Oana Georgiana Rus, Deniz A. Gürsel, Benita Schmitz-Koep, Gerd
Wagner, Götz Berberich, Kathrin Koch
The author of this thesis is the first author of the manuscript. T.J.R. and K.K. with the help
of G.W. and G.B. conceived the experiment. T.J.R., O.G.R., B.S.K., and D.A.G recruited
participants and conducted the data acquisition. G.W. contributed data. T.J.R. performed
analyses. T.J.R. wrote the manuscript in consultation with O.G.R., G.W., and K.K. All
Chapter 4
Project 3: “Association between
hippocampus volume and symptom
profiles in obsessive-compulsive
disorder”
The current chapter includes the research article “Association between hippocampus
volume and symptom profiles in obsessive-compulsive disorder”. This article aimed at
exploring potential relationships between symptom profiles and hippocampus volume in
OCD. Employing a clustering algorithm allowed to derive symptom profile groups that were
differentially associated with hippocampus volume alterations. The article was published in
Neuroimaging: Clinical in 2018.
Contributions
Authors: Tim Jonas Reess, Oana Georgiana Rus, Deniz A. Gürsel, Benita Schmitz-Koep, Gerd
Wagner, Götz Berberich, Kathrin Koch
The author of this thesis is the first author of the manuscript. T.J.R., K.K., and O.G.R.
together with G.W. and G.B. conceived the experiment. T.J.R., O.G.R., D.A.G., and B.S.K.
recruited participants and acquired data. G.W. contributed data and analytic tools. T.J.R.
performed analyses. T.J.R. and K.K. wrote the manuscript in consultation with O.G.R.,