Population Studies on an Endemic Troglobitic Beetle: Geographical Patterns
of
Genetic Variation, Gene Flow and Genetic Structure Compared With
Morphometric Data
Brigitte Crouau-Roy
Laboratoire Souterrain d u Centre National de la Recherche Scientijque, Moulis, 09200 Saint-Girons, France Manuscript received June 22, 1988
Accepted for publication November 28, 1988
ABSTRACT
Highly specialized obligatory cave beetles endemic to the French Pyrenees offer an opportunity to investigate the relative importance of environmental conditions and ecological characteristics on the organization of genetic variability, to describe the genetic structure of populations, and to assess the extent of gene flow between local populations in relation to geologic structure. Twenty-three geographically close populations of the beetle Speonomus hydrophilus occurring both in caves (reduced fluctuations in many abiotic parameters) and under the deepest layer of soil in mountains (more exposed to climatic variations) were studied. Significant genetic differentiation at 17 allozyme loci was found among populations in close proximity, as well as among those from distant parts of range. On a larger scale, genetic differences among populations appear to result from low dispersal rates between populations. The spatial patterning observed suggests that allozyme frequencies are not responding to environmentally controlled selection. Substantial genetic divergence (Fsr = 0.1 12) occurred throughout the range, with important variation in levels of genetic variability (i?: 0.065- 0.184) among populations. A significant level of substructuring has occurred among the populations with four major geographic areas of similarity indicated. T h e substructuring of the species into regions suggests an influence of paleoclimatic gradient and paleoenvironment on the population’s genetic structure. Also, founder effect and reduced gene flow appear to have influenced populations
.,
in the southeastern portion of the range.
M
ANY authors have emphasized the importance of geographical patterns of genetic variation in understanding the population genetic processes that have shaped them (MITTER and FUTUYMA 1979; NEVO, BEILES and BEN-SHLOMO 1984; ARCHIE, SIMON and WARTENBERG 1985; EASTEL 1985; SOKAL, ODEN and BARKER 1987). Patterns of geographic variation in allele frequencies within a species may provide valuable information on past and current evolutionary forces affecting the evolution of the species. Further- more, population structure is one aspect of the genetic organization of a species often cited to play a key role in the speciation process (WRIGHT 1955; CARSON 1975; TEMPLETON 1980; FLEISCHER 1983; MORT and WOLF 1986).Troglobitic ( i e . , obligate cave dwelling) organisms have long been of special interest to biologists for understanding ecological and evolutionary processes (BARR 1968; POULSON and WHITE 1969; SBORDONI
1982; CULVER 1982; KANE and RICHARDSON 1985; POULSON 1985). These organisms, which have expe- rienced food scarcity (HOWARTH 1983) and have been subject to strong directional selection for metabolic economy (for review see HUPPOP 1985), and for in- creased longevity and low fecundity (smaller total number of eggs produced, and larger eggs) (CULVER
Genetics 121: 571-582 (March, 1989)
1982; PECK 1986), present features that are com- monly associated with K-selection. The bathysciinae beetles contain about 600 species, most of them are cavernicolous and occurring in Europe (VANDEL
1965; LANEYRIE 1967). Among the many species of troglobitic Coleopterae beetles in the Pyrenees, Speon-
ornus hydrophilus, which presents a high degree of specialization to underground life (life cycle of one larval stage, with suppression of larval feeding) (DE- LEURANCE-GLACON 1963), is the subject of this study. This endemic species is distributed (see Figure 1) in the massif Arize of the French central Pyrenees (30 X 40 km), east of the Salat River. This massif is crossed by a crest line which rises up progressively from west to east (1 600 m). The southern extent of this massif is composed of metamorphic rocks. The northern part of the massif contains some sedimentary paleozoic rocks and includes a narrow calcareous belt in which caves are numerous. The northern extent of the mas- sif is delimited by a layer of colmated pelites which are geological barriers to underground colonization by cave fauna.
ice age: the eastern part has been in direct contact with the Arikge valley glacier and its tributaries. T h e southeastern part is close to the glaciers descending from the massif of Trois Seigneurs.
For most studies of the genetic structure of popu- lations, the specific mechanisms of genetic differentia-
tion have not been identified. S. hydrophilus offers a
unique opportunity to study the causes producing
patterns of genetic variation. It is possible to study
populations in close proximity (23 m) occurring in
different situations in the biogeographic range: e.g.,
altitudinal (430-1440 m), geologic (nature of the par-
ent-rock and degree of fracturing), climatic (temper-
ature and humidity fluctuation). Furthermore, this
species occurs not only in caves where the environ- ment shows reduced fluctuations in many abiotic pa- rameters, but also in the "milieu souterrain superfi-
ciel" (MSS) ( JUBERTHIE, DELAY and BOUILLON 1980):
this consists of cracks and fissures in the superficial part of the rock and of interconnecting spaces in scree and talus. T h e latter populations are more exposed to
climatic variations (e.g., temperature 3-14' and hu-
midity) than are cave populations (8-1 0'). Biogeo-
graphic and ecological data for this species are avail-
able ( JUBERTHIE et al. 198 1; CROUAU-ROY 1987). T h e
discovery of the MSS as habitat for troglobitic S.
hydrophilus extended the range of this species in the
South into regions of schists. T h e geologically and
climatically disjunct pattern of distribution of popu-
lations (cave and MSS populations) provide an oppor-
tunity to investigate the relative importance of envi-
ronmental structure and ecological characteristics on
the organization of genetic variability. Moreover,
these habitats (caves and MSS) may be interconnected
and thus the geologic structure is of great importance
to the genetic structure because it can act as a dispersal
barrier or limit gene flow. Adult Speonomus move freely but with limited powers of dispersal. Genetic
differentiation of populations is opposed by gene flow
which is caused by the movement of individuals prior
to reproduction.
In a previous paper (CROUAU-ROY 1986), I have
reported substantial local intraspecific differentiation between geographically proximate populations. T h e
purpose of this study is: 1) to describe and analyze the
overall pattern of geographical variation and the ma- jor factors promoting and maintaining the different
patterns of genetic variability observed in conspecific
populations; 2) to describe the genetic structure of
populations from the patterns of gene frequency; and
3) to assess the extent of gene flow between geograph-
ically close populations and to examine the role of the
gene flow in maintaining homogeneous allele frequen-
cies and in its effect on morphological characters.
MATERIALS AND METHODS
Troglobitic beetles were collected from 23 localities in the northern mountains of Arize (Pyrenees) (Figure 1). The
altitudes range between 430 and 690 m for cave stations and between 610 and 1440 m for MSS stations (see Table 3). These localities supported large populations which per- mitted collections of significant samples.
Allozymic analysis: Beetles were maintained alive at 7 O
or frozen at -50" prior to electrophoresis. The homogenate of each animal was analyzed for electrophoretic variation in 13 enzyme systems coded by 17 scorable loci. Enzymes were assayed at 4" by either starch or acrylamide gel electropho- resis. Horizontal starch gels were used to assay for alkaline phosphatase (locus Aph), leucine aminopeptidase (Lup-I), malic enzyme (Me), hexokinase (Hk-3, Hk-4), esterase (Est- 6 ) , phosphohexose isomerase (Phi-I, Phi-2) and a-glycero- phosphate dehydrogenase (a-Gpdh). Vertical polyacrylamide slab gels were used to examine electrophoretic variation in acid phosphatase (Puc-I, PUG-P), fumarase (Fum), hydroxy- butyrate dehydrogenase (Hbdh-l, Hbdh-3), malate dehydro- genase (Mdh), aldehyde oxidase (Ao) and lactate dehydro- genase (Ldh). Electrophoretic procedures used are those previously reported (CROUAU-ROY 1988a).
The following parameters were used to estimate genetic variability: expected and observed mean heterozygosity per locus and per population (Hexp; Hob,) (NEI 1975); proportion of polymorphic loci, according to the 1 % criterion (P); and mean number of alleles per locus (A) (KIMURA and CROW
1964). Genetic differentiation among and within the popu- lations was analyzed by using WRIGHT'S (1 965) F-statistics as modified by NEI (1977, 1986). In this analysis, total gene diversity ( H T ) is subdivided into gene diversity within pop-
ulations (Hs) and gene diversity among populations. HT is calculated by obtaining the weighted average allele frequen- cies over all populations (HT = 1
-
x$).
Hs is equal to the weighted average of the values over all loci of the values (Hs = 1-
Ex:) for each population. Differentiation among populations is calculated as FST = (HT-
HS)/HT. Significance of heterogeneity in gene frequencies among populations was tested for each locus by the x' test (WORKMAN and NISWAN-DER 1970). Genetic distances between each pair of popula-
tions were calculated according to Nei (1972) (standard distance). The relationships among populations were sum- marized in the form of dendrogram derived from the UPGMA clustering method (SNEATH and SOKAL 1973).
Morphometric analyses: Sixteen characters were meas- ured on 30 male beetles in each population: length (L) and width (W) of 7 antennal segments (5th, 6th, 7th, 8th, 9 t h 10th and length only of 1 1 th), length of the tibia of the 3rd pair of legs (LT), length of the elytra (LE) and width of the pronotum (WP). Because of significant correlations between values for the sexes, the measurements were made only on males. A principal component analysis (PCA) was performed on the mean values for 30 adults for the different characters. Discriminant function analyses were used to determine whether populations from the various regions differed sig- nificantly and to identify the characters contributing most to the discrimination. Analyses of variance were used to compare individually the characters contributing most to the discrimination of the group. Only 18 of 23 local popu- lations were examined morphologically.
RESULTS
Allozyme variability within populations: All 23
populations were monomorphic for the same allele at
10 loci: Aph, Ldh, Hbdh-1, Hbdh-3, Fum, Pac-2, Mdh,
Phi-2, a-Gpdh and Ao. N o loci were observed to be fixed for alternative alleles in different populations.
"
" -
""
" -
" -
.
IzI
Limestone Granodioritea
Schist. "
analysis computed on the basis of allozymic frequencies.
. .
populations polymorphic for two or more alleles (Ta- ble l , MSS, and Table 2, cave populations). T h e polymorphic loci can be divided into two categories
based on the extent of their allelic variation: 4 slightly
polymorphic loci are variable in at most four popula- tions (in particular in outlying populations); the re-
maining 3 loci Est-6, Lap-I and Phi-1 are highly poly-
morphic. These 3 loci are the most useful for outlining
patterns of geographic variation. Three polymorphic
loci exhibit a marked spatial variation of allele fre-
quencies (Figure 2), sometimes over short distances,
and this variation differs according to the locus. In
some cases (e.g., Est-6100), the variation may be gradual
and continuous on a local scale, whereas in other cases
(e.g., Est-6104) variation may be very abrupt on a local scale (Figure 2). These polymorphic loci showed sig-
nificant heterogeneity ( P
<
0.00 1) in allele frequenciesamong populations. If we consider all polymorphic
loci, some proximate populations do not exhibit sig- nificant differences in allelic frequencies. T h e gene frequencies for the Est-6 locus exhibit, for the most
common allele, an east-west and altitudinal (1 350 +
480 m) cline with fixation of this allele in the eastern-
most population (Andronne, No. 1). On a more re-
duced scale (the eastern region), alleles at the Est-6
(allele 100) and Lap-1 loci show clinal variation while
the patterns at other loci are less clearly defined.
However, over the entire range the Lap-I and Phi-I
loci show apparently random patterns of variation.
For populations in similar geological situations (e.g.,
cave populations which occur in continuous limestone
outcrops) and in a geographic region with a uniform climatic regime, variability in allozyme frequencies
still occurs among populations. For example, the fre-
quencies of the most common allele at Est-6 (allele
100) are very different for the cave population Est-
anque (No. 18) and the other cave populations ( P I 0 0
= 0.642 and 0.245, respectively). These populations
occur in more similar environmental conditions than
does the MSS population Cascade (No. 14), which
does not differ in allozyme frequency (0.619) from
the cave population Estanque (No. 18). Since nearby
populations or populations in the same environment are not always similar, it would appear that gene frequencies are not solely, if at all, a response to local environmental conditions.
Genetic variability in local populations of S. hydro-
philus is given in Table 3. T h e average MSS popula-
tions (No. 1-16) are polymorphic at approximately
22% of their loci and the average frequency of het-
erozygous loci per individual is 0.098 (Table 3). Cave
populations have somewhat higher values than MSS
populations (P = 26%; Hexp = 0.128). Average heter-
ozygosity is not homogeneous within this species and
ranges from a low of 0.065 to a maximum of 0.184
with an unweighted mean for all populations exam-
ined of 0.107 & 0.029 (Table 3). This value of H
approaches values typically reported for many surface
invertebrates (SELANDER 1976; NEVO 1978). T h e
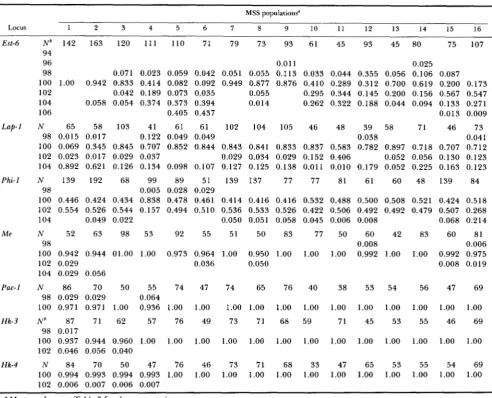
TABLE 1
Gene frequencies for 16 MSS populations of S. hydrophilus
MSS populations"
Est-6
Lap-1
Phi-1
M e
Pac- I
Hk-3
Hk-4
Locus 1 2 3 4 5 6 I 8 9 10 1 1 12 13 14 15 16
N b 142 163 120 111 110 71 79 73 93 61 45 93 45 80 75 107
94
96 0.01 1
98
0.025 0.071 0.023 0.059 0.042 0.051 0.055 0.113 0.033 0.044 0.355 0.056 0.106 0.087
100 1.00 0.942 0.833 0.414 0.082 0.092 0.949 0.877 0.876 0.410 0.289 0.312 0.700 0.619 0.200 0.173
104 0.058 0.054 0.374 0.373 0.394 0.014 0.262 0.322 0.188 0.044 0.094 0.133 0.271
106 0.405 0.437 0.013 0.009
N 65 58 103 41 61 61 102 104 105 46 48 39 58 71 46 73 98 0.015 0.017 0.122 0.049 0.049 0.038 0.041 100 0.069 0.345 0.845 0.707 0.852 0.844 0.843 0.841 0.833 0.837 0.583 0.782 0.897 0.718 0.707 0.712 102 0.023 0.017 0.029 0.037 0.029 0.034 0.029 0.152 0.406 0.052 0.056 0.130 0.123 104 0.892 0.621 0.126 0.134 0.098 0.107 0.127 0.125 0.138 0.011 0,010 0.179 0.052 0.225 0.163 0.123
N 139 192 68 99 89 51 139 137 77 77 81 61 60 48 139 84
100 0.446 0.424 0.434 0.838 0.478 0.461 0.414 0.416 0.416 0.532 0.488 0.500 0.508 0.521 0.424 0.518 102 0.554 0.526 0.544 0.157 0.494 0.510 0.536 0.533 0.526 0.422 0.506 0.492 0.492 0.479 0.507 0.268 104 0.049 0.022 0.050 0.051 0.058 0.045 0.006 0.008 0.068 0.214
N 52 63 98 53 92 55 51 50 83 77 50 60 42 83 60 81
98 0.008 0.006
100 0.942 0.944 01.00 1.00 0.973 0.964 1.00 0.950 1.00 1.00 1.00 0.992 1.00 1.00 0.992 0.975
104 0.029 0.056
N 86 70 50 55 74 47 74 65 76 40 38 53 54 56 47 69
100 0.971 0.971 1.00 0.936 1.00 1.00 1.00 1.00 1.00 1.00 1.00 1.00 1.00 1.00 1.00 1.00
N b 87 71 62 57 76 49 73 71 68 59 71 45 53 55 46 69
100 0.937 0.944 0.960 1.00 1.00 1.00 1.00 1.00 1.00 1.00 1.00 1.00 1.00 1.00 1.00 1.00 102 0.046 0.056 0.040
102 0.042 0.189 0.073 0.035 0.055 0.295 0.344 0.145 0.200 0.156 0.567 0.547
98 0.005 0.028 0.029
102 0.029 0.036 0.050 0.008 0.019
98 0.029 0.029 0.064
98 0.017
N 84 70 50 47 76 46 73 71 68 33 47 65 53 55 54 69 100 0.994 0.993 0.994 0.993 1.00 1.00 1.00 1.00 1.00 1.00 1.00 1.00 1.00 1.00 1.00 1.00 102 0.006 0.007 0.006 0.007
~
a Map number: see Table 3 for the name stations.
~~
N = sample size.
erozygosities occur at all loci for all populations. Rel- atively high levels of inbreeding and/or further sub-
division within the populations is likely (CROUAU-ROY
1988b).
Genetic structure: NEI'S (1 972) estimate of genetic
distance was used for pairwise comparisons of the 23
populations (Table 4). Genetic identities are all
greater than 0.90. These distance values were sum- marized in a UPGMA clustering procedure (Figure
3). Animals from MSS localities 1 and 2 are most
divergent from the other populations. There is no
discrimination between cave and MSS populations ( I
= 0.956 & 0.03) and no clear geographical trends are
apparent from patterns of genetic similarity.
A useful measure of population differentiation is
also provided by the standardized variance of allele
frequencies (FsT values) (WRIGHT 1978; NEI 1977,
1986) with a
x 2
contingency analysis of heterogeneity.T h e results of this analysis indicate significant genetic differentiation occurs among all populations as indi- cated by the standardized variance of allele frequen-
cies (Table 5). T h e differentiation of allele frequencies
was significant for all variable loci. T h e Est-6 and Lup-
I polymorphic loci show highly statistically significant
variation. T h e Phi-I locus, equally highly polymorphic
(HT = 0.576), is more homogeneous in allelic frequen-
cies among all populations (FsT = 0.08). Fsr is not
correlated with average heterozygosity. Overall ge-
netic differentiation (FsT over the
7
loci) indicates that11.2% of the total variance of allele frequencies was
due to genetic differences between populations of S.
hydrophilus.
I
have studied differentiation for the7
polymorphicloci in the 23 local populations of S. hydrophilus and
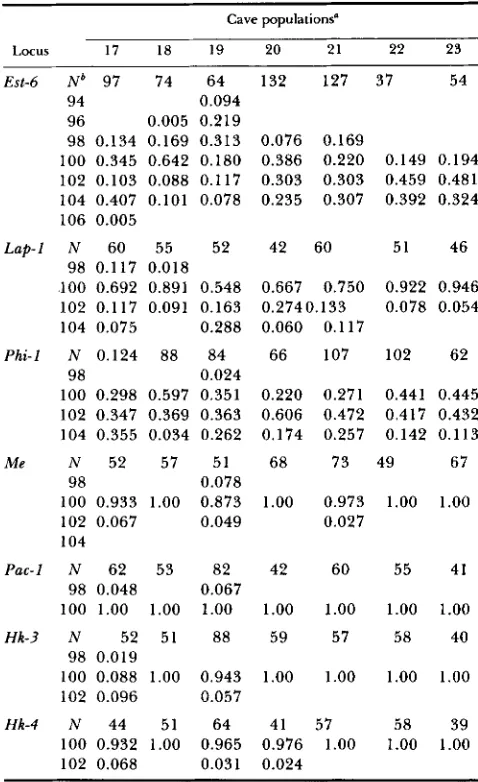
TABLE 2
Gene frequencies for 7 cave populations of S. hydrophilus
Cave populations”
Locus 17 18 19 20 21 22 23
Est-6 N b 97 74 64 132 127 37 54
94 0.094
96 0.005 0.219
98 0.134 0.169 0.313 0.076 0.169 100 0.345 0.642 0.180 0.386 0.220 0.149 0.194 102 0.103 0.088 0.117 0.303 0.303 0.459 0.481 104 0.407 0.101 0.078 0.235 0.307 0.392 0.324 106 0.005
L a p 1 N 60 55 52 42 60 51 46
98 0.117 0.018
100 0.692 0.891 0.548 0.667 0.750 0.922 0.946 102 0.117 0.091 0.163 0.2740.133 0.078 0.054
104 0.075 0.288 0.060 0.1 17
Phi-I N 0.124 88 84 66 107 102 62
98 0.024
100 0.298 0.597 0.351 0.220 0.271 0.441 0.445 102 0.347 0.369 0.363 0.606 0.472 0.417 0.432 104 0.355 0.034 0.262 0.174 0.257 0.142 0.1 13
Me N 52 57 51 68 73 49 67
100 0.933 1.00 0.873 1.00 0.973 1.00 1.00 102 0.067 0.049 0.027
104 98 0.078
Pac-I N 62 53 82 42 60 55 41
100 1.00 1.00 1.00 1.00 1.00 1.00 1.00
Hk-3 N 52 51 88 59 57 58 40
100 0.088 1.00 0.943 1.00 1.00 1.00 1.00 102 0.096 0.057
98 0.048 0.067
98 0.019
Hk-4 N 44 51 64 41 57 58 39
100 0.932 1.00 0.965 0.976 1.00 1.00 1.00 102 0.068 0.031 0.024
a Map number; see Table 3 for the name stations. * N = sample size.
cies (factorial analysis of correspondence). Several
zones may be defined according to an altitudinal east-
west axis: A (A1
+
A2), B1, Bl’, B’ (B2+
B3+
B4)(Figure 1). In particular factor 1 of the analysis distin- guishes the altitudinal south-eastern populations (zone
A) from the others (zone B). T h e overall differentia-
tion of allele frequencies among populations within the same region is small as indicated by the standard- ized variances of allele frequencies (Table 6).
Gene flow: Gene flow was estimated using the qual-
itative and quantitative approaches suggested by
SLATKIN (198 1, 1985). SLATKIN (1 985) asserted that the estimate does not depend on whether an island, stepping-stone, or hierarchical model of gene flow is used. Empirical studies using these methods have been
published with estimated gene flow consistent with
expectations based on ecological and life-history data
(CACCONE 1985; CACCONE and SBORDONI 1987). These procedures show a strong dependence between
the allele’s average frequency among local populations
conditioned (“conditional average allele frequency”
P(i,) on the number of local populations in which it
occurs (z/d), the overall level of gene flow, and effec-
tive population size (Ne), where d is the number of
demes sampled and i the number of demes in which
the allele occurs. T h e quantitative approach estimates the amount of gene flow using the average frequency
of alleles found in a single deme (“private alleles” P(1)).
T h e values can be used to estimate the absolute num- ber of migrants exchanged among populations each
generation (Nm).
Very high gene-flow level (Figure 4) characterizes S. hydrophilus: alleles which occur in half of the local
populations (i/d = 0.5) are the same and present
similar and low frequencies. Quantitative estimates of
gene flow (SLATKIN 1985) for S. hydrophilus (23 pop-
ulations) and for different subsets of populations (Ta-
ble
7)
show that the average number of migrantsexchanged between local populations (corrected N m
value, Nm*) is greater than 1 (Nm* = 12.53) despite
some heterogeneity in gene frequencies among these
populations (Tables 5 and 6). This value consistent
with the qualitative pattern shown in Figure 4, seems unexpectedly high. This analysis can also be per-
formed on the clusters defined by the factorial analysis
by removing groups of populations and recalculating
Nm*. Clusters B1’ and B’ (B2
+
B3+
B4) seem themore isolated groups of populations.
Morphological variation: Relationships between
populations of S. hydroPhilus based on 16 morpholog-
ical characters were considered. Several variables are
highly correlated, in particular the width of the
7
antennal segments and the length of the 6th, 7th, 8th,
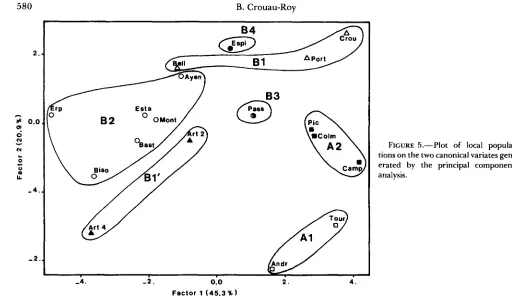
9th and 10th antennal segments. Nevertheless these correlated characters do not contribute in the same way to the discrimination of the genetic clusters. Six characters discriminate between the different clusters of populations: W7 on the first factor F1 (31.3% of the total variance), L9 and L7 on F2, L5 and W5 on F3 and WP on F4. The marked dissimilarity of the different regions and in particular of altitudinal and southeastern populations (region A) is distinctly illus- trated in a plot of all local populations on the two canonical variates generated by the principal compo-
nent analysis. Figure 5 shows only the center of gravity
of every population. T h e two populations of Artillac
(region Bl’: Nos. 5-6) distant by 500 m, which are
identical electrophoretically, display significant differ-
ences for several characters (Student’s test with d.f. =
58; WP: 6.26; LE: 4.16; LT: 7.46; L6: 4.33; L5: 2.9).
For each variable character the animals on south-
facing exposures are smaller and those on north- facing slopes are the largest.
DISCUSSION
T h e results of the present study indicate that (1)
B. Crouau-Roy
0 1 2 k m
I
Locus Lap-1. .
0 1 2 k m
Locus Phi- 7 20- km
FIGURE 2.--Est-6, Lap-1 and Phi-I allele frequencies in the 23 S. hydrophilus populations. Numbers refer to populations as indicated in
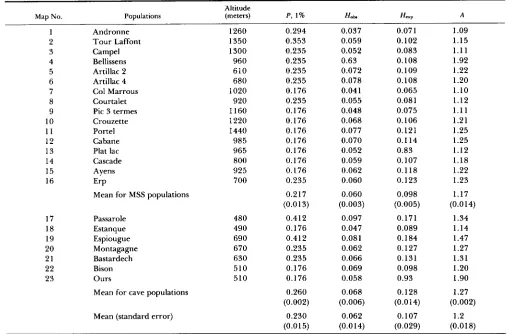
TABLE 3
Genetic variability in local populations of S. hydrophilus (19 loci scored)
Altitude
Map No. Populations (meters) P, 1 % HObl H e x p A
1 2 3 4 5 6 7 8 9 10 11 12 13 14 15 16 17 18 19 20 21 22 23 Andronne Tour Laffont Campel Bellissens Artillac 2 Artillac 4 Col Marrous Courtalet Pic 3 termes Crouzette Portel Cabane Plat lac Cascade Ayens ErP
Mean for MSS populations
Passarole Estanque Espiougue Montagagne Bastardech Bison Ours
Mean for cave populations
Mean (standard error)
1260 1350 1300 960 610 680 1020 920 1160 1220 1440 985 965 800 925 700 480 490 690 670 630 510 510 0.294 0.353 0.235 0.235 0.235 0.235 0.176 0.235 0.176 0.176 0.176 0.176 0.176 0.176 0.176 0.235 0.217 (0.0 13)
0.412 0.176 0.412 0.235 0.235 0.176 0.176 0.260 (0.002) 0.230 (0.015) 0.037 0.059 0.052 0.63 0.072 0.078 0.041 0.055 0.048 0.068 0.077 0.070 0.052 0.059 0.062 0.060 0.060 (0.003) 0.097 0.047 0.081 0.062 0.066 0.069 0.058 0.068 (0.006) 0.062 (0.014) 0.071 0.102 0.083 0.108 0.109 0.108 0.065 0.081 0.075 0.106 0.121 0.1 14 0.83 0.107 0.118 0.123 0.098 (0.005) 0.171 0.089 0.184 0.127 0.131 0.098 0.93 0.128 (0.014) 0.107 (0.029) 1.09 1.15 1.11 1.92 1.22 1.20 1.10 1.12 1.11 1.21 1.25 1.25 1.12 1.18 1.22 1.23 1.17 (0.014) 1.34 1.14 1.47 1.27 1.31 1.20 1.90 1.27 (0.002) 1.2 (0.018)
P = frequency of polymorphic loci (frequency of the rarest allele 21%). H o b s = average observed heterozygosity; Hcxp = average heterozygosity under Hardy-Weinberg equilibrium; A = mean number of alleles per locus.
TABLE 4
NEI’S (1972) genetic identity ( I ) and distance (0) for comparisons of MSS and cave populations of S. hydrophilus
Populations
Genetic MSS Caves MSS
+
cavesstructure (1-16) (17-23) MSS/Caves (1-23)
I 0.952 0.981 0.956 0.965 (0.029) (0.009) (0.030) (0.021) D 0.049 0.019 0.045 0.035
(0.005) (0.001) (0.004) (0.001) Values in parentheses are standard error.
occurred among proximate populations of the en-
demic troglobitic beetle
S.
hydrophilus with the aver-age differentiation among populations approximately 1 1 % (FST = 0.1 12; Table 5 ) ; (2) there is no distinction
between cave and MSS populations; (3) the pattern of
allele frequency variation differs among loci (Figure
2); (4) the populations also show variation in the level
of genetic variability (Table 3) over the geographic
range of S. hydrophilus; and (5) S. hydrophilus may be
qualitatively described as a species in which gene flow
rl”
7I I I I 9
L-I.
Q’:!
4L
1219 17 15 16 10 22 23 21 11 2 0
.05 .O 4 .O 3 .o 2 .01 0
FIGURE 3.-Dendrogram of genetic relatedness of the popula- tions samples based on NEI’S estimator of genetic distance. Cluster- ing of populations was by the unweighted pair group method of
SNEATH and SOKAL (1 973).
is high (SLATKIN 1981) (Figure 4). There are several
possible ways in which this particular pattern of vari-
ation may have arisen. In determining genetic struc-
ture one must consider the relative importance of
578 B. Crouau-Roy
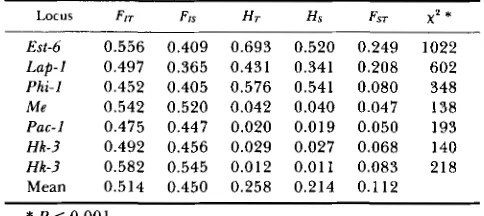
TABLE 5
Results of the analysis of F statistics and heterogeneity x'
among populations for each variable locus of S. hydrophilus
LOCUS FIT FIS H r Hs FST x' *
Est-6 0.556 0.409 0.693 0.520 0.249 1022
Lap-! 0.497 0.365 0.431 0.341 0.208 602
Phi-1 0.452 0.405 0.576 0.541 0.080 348
M e 0.542 0.520 0.042 0.040 0.047 138
Pac-1 0.475 0.447 0.020 0.019 0.050 193
Hk-3 0.492 0.456 0.029 0.027 0.068 140
Hk-3 0.582 0.545 0.012 0.011 0.083 218
Mean 0.514 0.450 0.258 0.214 0.112
* P < 0.001.
interconnecting passages), the response of populations
to selection, the breeding structure of populations and
the prevalence of historical differences among popu- lations.
The possibility that natural selection has played
some part in producing the patterns of genetic varia- tion observed seem unlikely. T h e cave populations do not display the same patterns of genetic variation and the same levels of heterozygosity even though these populations occur in similar environments. T h e sig-
nificant amount of genetic variation among MSS pop-
ulations which are geographically proximate would indicate that allozyme frequencies for the loci exam- ined are not a response to local environmental condi- tions; similar allele frequencies among more distant populations are found. T h e patterns of genetic simi- larity among populations do not show any clear major geographical differentiation.
T h e pronounced spatial heterogeneity and lack of association between genetic and geographic distances are in agreement with the expectations of a model of
differentiation by founder effect (MAYR 1963), mu-
tation and genetic drift (FUERST, CHAKRABORTY and
NEI 1977; CHAKRABORTY, FUERST and NEI 1978). A
probable example of founder effect and genetic drift
is provided by beetles from MSS populations An-
dronne (No. 1) and Tour Laffont (No. 2) which are
situated at high altitude (1200 and 1350 m, respec- tively) and in the southeastern portion of the range. T h e great divergence of these populations (Fig. 3) is
primarily due to the fixation (No. 1) or the near
fixation (No. 2) of the highly variable allele 100 of the
locus Est-6. T h e high frequency of the rare Lap-I 104
allele within these populations also contributes to their low genetic identity with other populations. Founder
effect or genetic drift occurring during a range ex-
pansion could explain why the alleles with high fre- quency in all populations are fixed in these popula-
tions and why the level of heterozygosity is low (0.072
and 0.102). It could also be simply a bottleneck effect
on the edge of the range with reduced gene flow.
However, reduction in heterozygosity can be minimal
even following an extreme bottleneck; on the con-
trary, average number of alleles per locus is drastically
reduced by bottlenecks: the loss of alleles rather than
reduction in heterozygosity can be a primary result
following the large population size reductions implicit
in founder events (NEI, MARUYAMA and CHAKRA-
BORTY 1975; TEMPLETON 1980). T h e easternmost
population (No. 1) displays a low average number of
alleles per locus. These high altitude populations have either remained in situ during the climatic shifts of the ice ages with range extension during the intergla- cials, or migrated toward the low altitudes with re- colonization of the higher altitudes during the inter- glacials. It can be hypothesized that the founder effect,
and a reduction in gene flow, reduced the genetic
variability of these peripheral populations. Passarole
(No. 17) and Espiougue (No. 19) are well differen-
tiated from other populations by a high level of het- erozygosity (0.17 1 and 0.184) which accounts for an increased average number of alleles per locus. Passa-
role is separated from the others by a schistous tertiary
outcrop which acts as an impediment to gene flow. In
the same way, Est-696 and 98 alleles were only ob-
served for beetles from Espiougue population (B4).
This population is separated from the nearest popu- lations by the presence of shaly sandstone elements. T h e allele frequency differences in these populations which display the highest number of rare variants (5
variants with a frequency -5%), may have resulted
from genetic drift occurring since they were separated
from the other populations by inhospitable habitat
(presence of colmated zone with few cracks and fis- sures allowing migration).
T h e genetic distance estimates are insufficiently precise to rule out other possible patterns of related-
ness: the patterns shown in Figure 3 do not corre-
spond with the geographical positions of the popula-
tions and are at variance with the patterns of similarity
and differences indicated by the allele frequency var- iance analysis. Some of the clusters exhibit significant genetic variation between populations. T h e genetic
differentiation found in S. hydrophilus populations
indicates (by factorial analysis of correspondence) that the different allozymes do not distribute at random.
Rather the associations among the 23 local popula-
tions suggest a division into 4 major regions, A (A1
+
A2), B1, B1
',
B' (B2+
B3+
B4) along an altitudinalsouth-east, north-west axis. This separation seems more relevant than that achieved from dendrogram, for it takes count of all the components of the diver- gence: structure at fine scale, every individual, redun- dancy between variables. T h e massif of Arize has undergone some diverse climatic changes during the
past 60-70,000 yr. Further, the altitude and the as-
pect of exposure ( k , north- us. south-facing slopes)
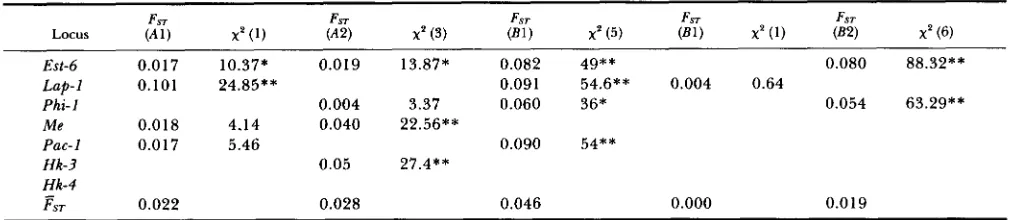
TABLE 6
Standardized variances of allele frequencies (Fn) within regions (as described in Figure 1) and heterogeneity x* analyses for various allozyme loci in S. hydrophilus
FST
Locus ('41) x p (1) ('42) FST x p (3) (E1 FST ) x p (5) (El) x p (1) (82) x' ( 6)
FST FST
Est-6 0.017 10.37* 0.019 13.87* 0.082 49** 0.080 88.32**
Lap-1 0.101 24.85** 0.091 54.6** 0.004 0.64
Phi-1 0.004 3.37 0.060 36* 0.054 63.29**
M e 0.0 18 4.14 0.040 22.56**
Pac- I 0.0 17 5.46 0.090 54**
Hk-3 0.05 27.4**
Hk-4
&:ST 0.022 0.028 0.046 0.000 0.0 19
* P < 0.01;
**
CO.001. Regions B3 and B4 are formed by only one population.0.7. 0.6. 0 . 5 .
0.4.
0 . 3 .
0 . 2 .
0.1
l+-*/+\+
-
/+,*J
+ i/d0.1 0.2 0 . 3 0.4 0.5 0.6 0.7 0.8 0.9 1
l+-*/+\+
-
/+,*J
+ i/d0.1 0.2 0 . 3 0.4 0.5 0.6 0.7 0.8 0.9 1
FIGURE 4,"Qualitative estimates of gene flow in S. hydrophilus (SLATKIN 1981).
though the geographic distance between the popula- tions studied is considerably low and its structuring suggests an influence of paleoclimatic gradient and paleoenvironment.
The observed range of genetic variability is great
in local populations of S. hydrophilus ( H : 0.065-0.184)
and the average level of heterozygosity
(R:
0.107)cannot depend on the degree of specialization of the
species in the hypogean environment as BARR (1 968)
suggested. These data suggest that cave adaptation does not necessarily result in a reduction in genetic variation. For the troglobitic beetles the interpreta- tion of genetic variability is a subject of discussion (for
review see CULVER 1982; SBORDONI 1982). Many
factors may influence the heterozygosity of a local
population and/or the variability of a whole species. The population size in caves and the MSS is generally large and we observe no relation between local pop- ulation size and mean heterozygosities (CROUAU-ROY 1987). The caves are interconnected with cracks and
other voids such as spaces in scree and talus. This
habitat may play an important part in the colonization of the subterranean compartment for two reasons:
TABLE 7
Average frequencies of private alleles, # (1) and estimates of
Nm* obtained for species S. hydrophilus (all populations) and for different subsets of populations or regions defined in
Figure 1
Clusters Sample
excluded size B ( 1 ) ma*
All populations present 70 0.042 12.53
A1 60 0.105 1.65
A1
+
A2 55 0.166 0.61 B4 6 3 0.118 1.37 B1' 71 0.095 2.39 B' (B2+
B3+
B4) 57 0.086 2.36 B2+
B3 62 0.164 0.71*
Corrected Nm values.first, it is in contact with the endogenous compart-
ment; second, it occurs in karst and nonkarst regions. The subterranean environment, composed of fissures in the rock and colluvium, is not a stable compartment
in time. Thus, in a single species, local populations
can exhibit very different levels of heterozygosity without relation with the species' degree of speciali- zation to the subterranean environment, but with relation to the age of the population in the same place or to the time since a portion of the population was isolated. Therefore, it is virtually impossible to estab-
lish a relationship between heterozygosity and the
degree of specialization to subterranean life; the past history of the population as well as other factors (e.g., environmental variation to which the population is
exposed) may act on heterozygosity individually or in
synergy.
The use of the patterns and degrees of allelic dif-
ferentiation within and between populations to ex- plain the evolution of species is criticized by some
authors. They contest the role of gene flow as an
essential factor in the cohesion of species and there- fore in the maintenance of genetic continuity (MAY-
NARD-SMITH 1966; EHRLICH and RAVEN 1969; EN-
Crouau-Roy
2 .
-
9 0.0
0
-
N N0
0
9
IJ.
h
-
- 4 .
- 2
FIGURE 5.-Plot of local popula- tions on the two canonical variates gen- erated by the principal component analysis.
-4. - 2 . 0:o
Factor 1 (45,3 96)
ROTH and WAKE 1983; LARSON, WAKE and YANEV 1984). T h e qualitative and quantitative approaches
suggested by SLATKIN (1981, 1985) are presumably
independent of the mechanisms of selection and mu- tation, which determine an allele’s average frequency in the deme of origin of a migrant. T h e accuracy of
Nm* estimates depends on several assumptions (SLAT-
KIN 1985), including that populations are in genetic
and demographic equilibrium and that the number of
private alleles is large: particularly for high gene-flow
species; otherwise Nm* estimates may be subject to a
large stochastic variance (WAPLES 1987). T h e overall
estimation of the gene flow (Nm* = 12.53) is here
questionable because we are dealing with a species highly subdivided into groups of populations, where gene flow is much higher within groups than between
groups so that it lowers the number of private alleles.
T h e geographic distances among the populations of S. hydrophilus are very small and SLATKIN (1985)
suggested that estimation of gene flow may be influ- enced by the proximity of the populations sampled.
Moreover, this value (Nm* = 12.53) is outside the
range of reliability of the method (SLATKIN 1985).
Nevertheless, this analysis performed on different sub-
sets of the total populations sampled provides several pieces of information which help in understanding population structure and patterns of gene flow. How-
ever the different values of Nm* given in Table
7
canonly be compared with each other to determine the degree of isolation of populations or groups of popu-
lations. Clusters B1’ and B’ seem the more isolated.
This is consistent with the presence of a colmated
2 . 4.
zone which separates them from the other populations
and also with the geographic pattern of allele fre- quency variations.
Troglobites in general have lower gene flow values
than troglophiles or trogloxenes (CACCONE 1985).
However, for this troglobitic beetle with limited dis- persal capability, overall estimate of gene flow based on the frequency of private alleles was not as strongly
correlated with dispersal capability as were FST and
D
values. A more detailed population-structure analysis associated with the geology of the area and the geo- graphic distance among the populations is also impor- tant in determining the gene-flow levels. Dispersion and accordingly gene flow are functions of intrinsic species factors (active movement and reproductive strategy) and extrinsic species factors (physical and biotic features of the cave systems and the surround- ing environment). T h e structure of the subterranean environment is such that there may exist spatial and temporal variations in access due to blocking or open- ing of cracks and by physical weathering and frost
effect. T h e evolution of the subterranean habitat is a
function of the nature of the rock and of the tectonic and paleoclimatic history of the region.
preted as more likely reflecting the history of the populations whereas the morphology responds more
directly to environmentally mediated regimes (differ-
ences in growth rates).
I would particularly like to thank T. C. KANE for helpful discus- sions and his valuable criticals of the manuscript. I am grateful to D. D’HULST and D. DEBOUZIE for the computer program of the genetic analysis, to C. JUBERTHIE and B. DELAY for valuable discus- sions throughout the study and assistance in the field collecting and
to C. FERRE for technical assistance.
LITERATURE CITED
ARCHIE, J., C. SIMON and D. WARTENBERG, 1985 Geographical patterns and population structure in periodical cicadas based on spatial analysis of allozyme frequencies. Evolution 3 9 1261- 1274.
BARR, T . C., 1968 Cave ecology and the evolution of Troglobites.
CACCONE, A,, 1985 Gene flow in cave arthropods: a qualitative and quantitative approach. Evolution 3 9 1223-1234.
CACCONE, A., and V. SBORDONI, 1987 Molecular evolutionary divergence among north american cave crickets. I. Allozyme variation. Evolution 41: 1198-1214.
CARSON, H. L., 1975 The genetics of speciation at the diploid level. Am. Nat. 109: 73-92.
CHAKRABORTY, R., P. A. FUERST and M. NEI, 1978 Statistical studies on protein polymorphism in natural populations. 11.
Gene differentiation between populations. Genetics 88: 367- 390.
CROUAU-ROY, B., 1986 Population studies on Pyrenean Troglob- itic beetles. I. Local genetic differentiation and microgeo- graphic variations in natural populations. Biochem. Syst. Ecol.
CROUAU-ROY, B., 1987 Structure ginitique des populations et des especes chez des ColioptPres Troglobies (Speonomus). Contribution i I’itude des micanismes de la spiciation. Mem. Biospeol. 1 4 1-300.
CROUAU-ROY, B., 1988a Genetic variability and differentiation in a species complex of troglobitic beetles based on isozyme data. Biochem. Syst. Ecol. 16: 303-310.
CROUAU-ROY, B., 1988b Genetic structure of cave-dwelling bee- tles populations: significant deficiencies of heterozygotes. He- redity 6 0 321-327.
CULVER, D. C., 1982 Cave Lge: Evolution and Ecology. Harvard University Press, Cambridge, Mass.
DELEURANCE-GLA~N, S., 1963 Contribution i I’itude des Co- liopteres cavernicoles de la sous-famille des Trechinae. Ann. Speleol. 18: 1-172.
EASTEAL, S., 1985 The ecological genetics of introduced popula- tions of the giant toad, Eufo marinus. 111. Geographical patterns of variation. Evolution 3 9 1065-1075.
EHRLICH, P. R., and P. H. RAVEN, 1969 Differentiation of popu- lations. Science 165: 1228-1232.
ENDLER, J. A., 1973 Gene flow and population differentiation. Science 1 7 9 243-250.
ENDLER, J. A., 1977 Geographic Variation, Speciation, and Clines.
Princeton University Press, Princeton, N.J.
FLEISCHER, R. C., 1983 A comparison of theoretical and electro- phoretic assessments of genetic structure in populations of the house sparrow (Passer domesticus). Evolution 37: 1001-1 009.
FUERST, P. A., R. CHAKRABORTY and M. NEI, 1977 Statistical studies on protein polymorphism in natural population. I.
Distributions of single locus heterozygosity. Genetics 8 6 455-
HOWARTH, F. G . , 1983 Ecology of cave arthropods. Annu. Rev. EvoI. Biol. 2: 35-102.
1 4 521-526.
483.
Entomol. 28: 365-389.
HUPPOP, K., 1985 The role of metabolism in the evolution of cave animals. NSS Bull. 47: 136-146.
JUBERTHIE, C., B. DELAY and M. BOUILLON, 1980 Sur I’existence d’un milieu souterrain superficiel en zone non calcaire. C. R. Acad. Sci. 2 9 0 49-52.
JUBERTHIE, C., B. DELAY, J. DURAND, L. JUBERTHIE-JUPEAU, M.
BOUILLON and G . RUFFAT, 198 1 Etude icologique, morpho- logique, biomitrique et biologique de Speonomus rophosinus
(Colioptkes Bathysciinae). Mem. Biospeol. 1 0 369-376. KANE, T. C., and R. C. RICHARDSON, 1985 Regressive evolution:
an historical perspective. NSS Bull. 47: 71-77.
KIMURA, M., and F. CROW, 1964 The number of alleles that can be maintained in a finite population. Genetics 49: 725-738.
LANEYRIE, R., 1967 Nouvelle classification des Bathysciinae (Co- IioptPres, Catopidae). Ann. Speleol. 22: 587-645.
LARSON, A,, D. B. WAKE and K. Y. YANEV, 1984 Measuring gene flow among populations having high levels of genetic fragmen- tation. Genetics 106: 293-308.
MAYNARDSMITH, J. M., 1966 Sympatric speciation. Am. Nat.
MAYR, E., 1963 Animal Species and Evolution. Harvard University Press, Cambridge, Mass.
MITTER, C., and D. J. FUTUYMA, 1979 Population genetic conse- quences of feeding habits in some forest Lepidoptera. Genetics
MORT, M. A,, and H. G . WOLF, 1986 The genetic structure of
NEI, M., 1972 Genetic distance between populations. Am. Nat.
NEI, M., 1975 Molecular Population, Genetics and Evolution. North- Holland, New York.
NEI, M., 1977 F statistics and analysis of gene diversity in subdi- vided populations. Ann. Hum. Genet. 41: 225-233.
NEI, M., 1986 Definition and estimation of fixation indices. Evo- lution 4 0 643-645.
NEI, M., T. MARUYAMA and R. CHAKRABORTY, 1975 The bottle- neck effect and genetic variability in populations. Evolution 29: 1-10,
NEVO, E., 1978 Genetic variation in natural populations, patterns and theory. Theor. Popul. Biol. 13: 121-177.
NEVO, E., A. BEILFS and R. BEN-SHLOMO, 1984 The evolutionary significance of genetic diversity: ecological, demographic and life history correlates, pp. 13-2 13 in Evolutionary Dynamics of
Genetic Diversity (Lecture Notes in Biomathematics, Vol. 53),
edited by G. S. MANI. Springer-Verlag, Berlin.
PECK, S. B., 1986 Evolution of adult morphology and life-history characters in cavernicolous Ptomaphagus beetles. Evolution 40:
POULSON, T. L., 1985 Evolutionary reduction by neutral muta- tions plausibility arguments and data from Amblyopsid and Linyphiid spiders. NSS Bull. 47: 109-1 17.
POULSON, T. L., and W. B. WHITE, 1969 The cave environment. Science 165: 971-981.
SBORDONI, V. 1982 Advances in speciation of cave animals, pp.
219-240 in Mechanism of Speciation, edited by C. BARIGOZZI. Alan R. Liss, New York.
SELANDER, R. K . , 1976 Genetic variation in natural populations, pp. 21-45 in Molecular Evolution, edited by J. AYALA. Sinauer Associates, Sunderland, Mass.
SLATKIN, M . , 1981 Estimating levels of gene flow in natural pop- ulations. Genetics 9 9 323-335.
SLATKIN, M., 1985 Rare allele and gene flow. Evolution 39: 53- 65.
SNEATH, P. H. A,, and R. R. SOKAL, 1973 Numerical Taxonomy.
W. H. Freeman, San Francisco.
SOKAL, R. R., N. ODEN and J. S. F. BARKER, 1987 Spatial structure in Drosophila buzzatu populations. Simple and directional spa- tial autocorrelation. Am. Nat. 1 2 9 122-142.
1 0 0 637-650.
92: 1005-1 02 1 .
large-lake Daphnia populations. Evolution 40: 756-766.
1 0 6 283-292.
TAUBER, C. A., and M. J. TAUBER, 1977 Sympatric speciation based on allelic changes at three loci: evidence from natural populations in two habitats. Science 197: 1298-1299.
TEMPLETON, A. R., 1980 The theory of speciation via the founder principle. Genetics 9 4 101 1-1038.
VANDEL, A., 1965 Eiospeleology. Pergamon, Oxford, U.K.
WAKE, D. B., G. ROTH and M. H. WAKE, 1983 On the problem of stasis in organismal evolution. J. Theor. Biol. 11: 21 1-224.
WAPLES, R. S., 1987 A multispecies approach to the analysis of gene-flow in marine shore fishes. Evolution 41: 385-400.
WORKMAN, P. L., and J. D. NISWANDER, 1970 Population studies
on southwestern indian tribes. 11. Local genetic differentiation in the Papago. Am. J. Hum. Genet. 2: 24-49.
WRIGHT, S., 1955 Classification of the factors of evolution. Cold Spring Harbor Symp. Quant Biol. 2 0 16-24.
WRIGHT, S., 1965 The interpretation of population structure by
F. statistics with special regard to systems of mating. Evolution
WRIGHT, S., 1978 Evolution and the Genetics of Populations, Vol. 4. Variability within and among Natural Populations. University of Chicago Press, Chicago.
19: 395-420.