GHASEMI, MASOUD. Structure-Function relation in Organic Solar Cells: Importance of the Molecular Interaction and Vitrification. (Under the direction of Dr. Harald Ade).
Organic solar cells (OSCs) with their unique properties such as flexibility, easy tuneability, and cheap processing conditions have attracted a huge amount of interests for both the academic and industrial purposes. Bulk heterojunction (BHJ), the most efficient organic photovoltaic layer till date, is the blend of a donor and an acceptor semiconducting organic materials. The most common type of BHJ devices are blends of polymer donor and small molecule acceptors (SMA). Achieving a high power conversion efficiency (PCE) over a large device area with a long device lifetime are the ultimate research goals for realizing commercialized BHJ OCSs. These goals can mainly be achieved through the understanding of this BHJ morphology by using novel characterization techniques, and through constructing structure-function relations, providing useful insights for chemical tailoring of new materials with novel structures. Controlling the molecular mixing between the organic components in a blend is crucial for obtaining and maintaining a favorable morphology which leads to higher device performance and longer lifetime. The morphology of BHJ OSC, during the film formation and device operation, is governed by the kinetic and thermodynamic properties of the donor and acceptor materials. This thesis aims to understand the role of morphology on device performance and lifetime by exploring the kinetic and thermodynamic factors. Morphological characterization tools such as secondary ion mass spectrometry (SIMS) and differential scanning calorimetry (DSC) provide insights into thermodynamic drivers which control the final achievable morphology.
ideal morphology and subsequently a low PCE. To control the destructive degree of mixing in these blends, a novel sequentially casting method (SeCaT) was developed which suppresses the mixing of the polymers. As a result, an increase in the device PCE is observed when this SeCaT method is employed. Furthermore, the temperature-dependent amorphous-amorphous interaction parameter, χaa(T), was determined by mapping out the phase diagram of a polymer:fullerene material system. Then, the χaa(T) extracted from the SIMS results was used to establish a quantitative “constant-kink-saturation” relation between χaa and performance (i.e., fill factor) in
OCSs.
Vitrification
by
Masoud Ghasemi
A dissertation submitted to the Graduate Faculty of North Carolina State University
in partial fulfillment of the requirements for the degree of
Doctor of Philosophy
Physics
Raleigh, North Carolina 2018
APPROVED BY:
_______________________________ _______________________________ Harald Ade Brendan O’Connor
Committee Chair
_______________________________ _______________________________ Maurice Balik Kenan Gundogdu
ii DEDICATION
iii BIOGRAPHY
Masoud Ghasemi was born on September 21st, 1988, in Mazandaran, Iran. He received his Bachelor of Science degree from Department of Physics from Tabriz University in 2010. In the next academic year, he joined Ezatollah Arzi’s group at Tehran University and obtained his Master
iv ACKNOWLEDGMENTS
First of all, I would like to express my sincere gratitude to my advisor Prof. Harald Ade for his continuous support. I must admit that without his unconditional motivation and immense knowledge in this area and beyond, this journey could easily find a different ending. Also, I admire his tremendous patience in many occasions: I am sure that I tested that many times. Beyond this PhD research and academic work, I would also thank Prof. Ade very much for his precious advice and suggestions, and for always inspiring me to look at the broad pictures; this invaluable lifetime lessons will be with me forever.
I thank all the current and former members of Ade group’s for their great support and
collaboration throughout my Ph.D.
I would like to thank my committee: Prof. Maurice Balik, Dr. Brendan O’Connor, Dr. Kenan Gundogdu, and Dr. Abay Dinku. In particular, I am grateful to Dr. Abay Dinku who guided me through the first year of my research.
I would also thank all the supporting staff in the Department of Physics, particularly, Rhonda Bennett for her kind and timely support.
I also would like to acknowledge my family: my parents and my brother and sisters for supporting me throughout my life.
v TABLE OF CONTENTS
LIST OF TABLES ... vii
LIST OF FIGURES ... viii
Chapter 1: Introduction ... 1
1.1 Thermodynamic of a binary blend ... 1
1.2 Entropy of mixing ... 1
1.3 Energetic interaction of mixing and interaction parameter ... 3
1.4 Determination of Flory-Huggins interaction parameter ... 7
1.4.1 Differential scanning calorimetry ... 7
1.4.2 The solubility parameter approach... 10
1.4.3 UV-Vis method ... 11
1.4.4 Secondary Ion Mass Spectrometry (SIMS) ... 12
REFERENCES ... 15
Chapter 2: Structure-function relation of organic solar cells ... 16
2.1 Bulk heterojunction organic solar cells ... 16
2.2 Device characteristics and their correlation with the active layer morphology ... 17
2.3 Morphological stability of OCS ... 20
2.3.1 Amorphous-amorphous phase separation ... 20
2.3.2 Small molecule crystallization ... 21
REFERENCES ... 22
Chapter 3: Panchromatic Sequentially-Cast Ternary Polymer Solar Cells ... 24
3.1 Preface ... 24
3.2 Introduction ... 25
3.3 Results and Discussion ... 28
3.3.1 OCS characterization ... 28
3.3.2 Active layer morphology ... 31
3.3.3 Depth profilometry... 32
3.3.4 Thermodynamic of the blend ... 24
3.4 Conclusion ... 42
3.5 Methods... 43
REFERENCES ... 48
Chapter 4: Quantitative interaction-miscibility-function relations in organic solar cells . 51 4.1 Preface ... 51
4.2 Introduction ... 52
4.3 Results and Discussion ... 55
4.3.1 Determination of Phase Diagram and χaa(T) in a model amorphous reference system ... 55
4.3.2 Quantitative link of χaa(T) to device performance and morphology ... 60
4.3.3 A quantitative interaction-function model with constant-kink-saturation signature .... 65
4.3.4 Simulations of phase behaviors of model systems ... 66
4.3.5 χaa-ISI and χaa-FF relations in many systems comprising semi-crystalline donors ... 68
4.4 Discussion ... 75
4.5 Conclusion ... 79
4.6 Methods... 80
vi Chapter 5: Thermodynamic and Kinetic Factors of Demixing and Crystallization
Instabilities in Non-Fullerene Organic Solar Cells ... 87
5.1 Preface ... 87
5.2 Introduction ... 88
5.3 Results and Discussion ... 93
5.3.1 OCSs characterization ... 93
5.3.2 Shelf stability and morphology characterization ... 95
5.3.3 Thermal properties of the blends ... 98
5.3.4 Phase behavior of the blends... 101
5.3.5 Diffusion coefficient extraction ... 105
5.4 Conclusion ... 108
5.5 Methods... 110
References ... 114
Chapter 6: Mechanical structure-function relations of nonfullerene solar cells ... 117
6.1 Preface ... 117
6.2 Introduction ... 118
6.3 Thermodynamic and kinetic characterization of polymer:NF-SMA blends ... 122
6.4 Shelf and Thermal stabilities ... 128
6.5 Mechanicalproperties ... 133
6.6 Discussion ... 136
6.7 Conclusion ... 139
6.8 Methods... 140
References ... 143
vii LIST OF TABLES
Table 3.1 Device performance of the binary, conventional ternary, and SeCaT PSCs ... 31 Table 4.1 Results of fitting the binodals with in Figure 4.1c with different MWs. Here a
fit to χaa(T)=A+B/T was applied ... 60
Table 4.2 Photovoltaic parameters, χ(Tm) parameters, and ISIs of the polymer:SMA pairs ... 70 Table 4.3 Estimation of χaa(Tm) of 15 OSC active layers from the DSC data measured
in this work ... 74 Table 4.4 Photovoltaic parameters of 15 OSC systems ... 75 Table 5.1 Photovoltaic parameters of OSCs measured after fabrication (Fresh) ... 93 Table 5.2 Photovoltaic parameters of OSCs measured after aged in glove box for 30 days
viii LIST OF FIGURES
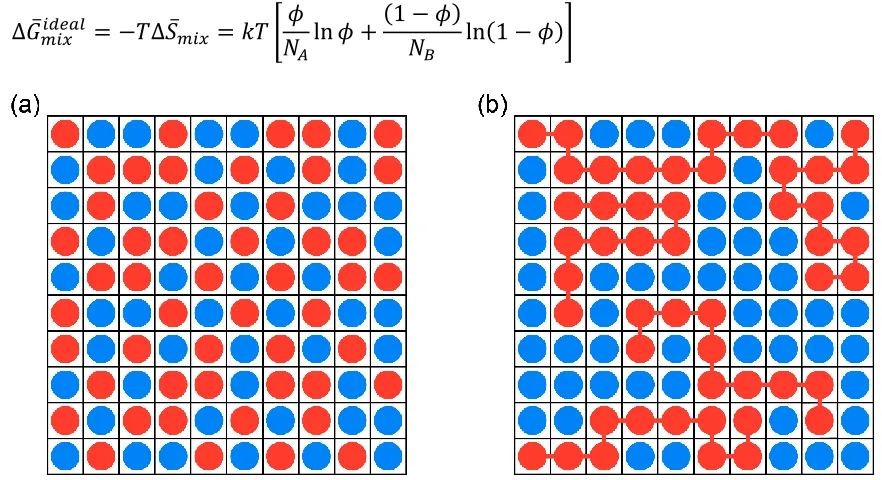
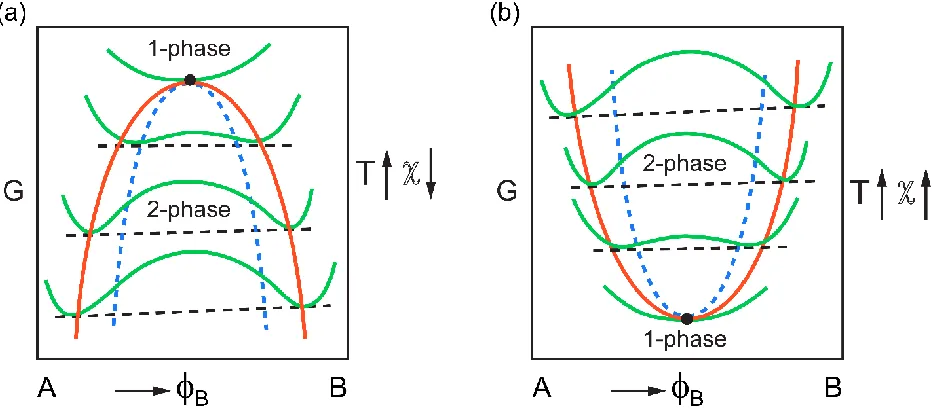
Figure 1.1 Schematic representation of a lattice, (a) a mixture of two small molecules with similar size, (b) a polymer:SMA mixture with NB=10, in which polymer segments have similar size with small molecule ... 3 Figure 1.2 Schematic of phase diagrams of (a) an UCST, and (b) an LCST system. The
green, black dashed, blue dashed, and orange lines represent Gibbs free energy at different temperatures, common tangent, spinodal phase diagram, and binodal phase diagram, respectively. The polymer:polymer blend was used to build the phase diagrams for clarity. In case of polymer:SMA the phase diagram is more asymmetric. ... 6 Figure 1.3 DSC thermograms of blends of P3HT:EH-IDTBR with different D/A ratio. (a)
Data collected from first heat and (b) themorgrams collected from first cool cycle. Heating and cooling rate of 10 °C/min was used for all the samples ... 9 Figure 1.4 Phase diagram of the P3HT:EH-IDTBR system at different D/A ratio. P3HT
and EH-IDTBR are assumed to have the similar molar density ... 9 Figure 1.5 Simplified schematic of ToF-SIMS, and (b) bilayer samples used for SIMS
measurements prior to thermal annealing ... 13 Figure 1.6 SIMS profiles of PCDTBT/PC71BM bilayer annealed at different
temperatures ... 14 Figure 2.1 (a) Schematic of the an OSC with inverted structure. (b) Typical current
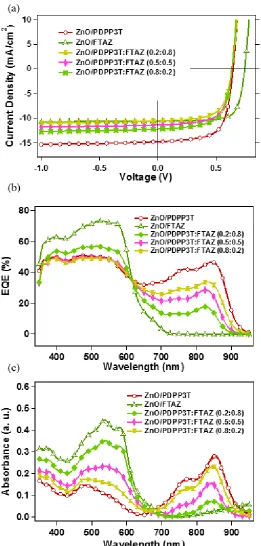
density-voltage and power-voltage curves ... 20 Figure 3.1 Figure 3.1. (a) J-V curves, and (b) External Quantum Efficiency (EQE) curve,
and (c) UV-Vis absorption spectra of conventional ternary and binary PSCs. The legends show the donor materials in the film. All the donor materials were mixed with PC71BM ... 27 Figure 3.2 (a) Schematic of conventional ternary and SeCaT solar cells with ZnO as
electron and MoO3 as hole transport layers, creating an inverted device architecture. Schematic of energy levels of (b) conventional ternary, and (c) SeCaT with vertically segregated morphology, which provides suitable pathways for electron and, more importantly, hole charge transport. (d) The chemical structures of donor polymers and the fullerene acceptor ... 28 Figure 3.3 (a) J-V curves, (b) UV-Vis absorption spectra of SeCaT and binary PSCs, and
ix PC71BM, FTAZ: PC71BM/ PDPP3T: PC71BM, (PDPP3T:FTAZ=0.2:0.8):
PC71BM, and (PDPP3T:FTAZ=0.8:0.2): PC71BM films, at 284.2 eV ... 30 Figure 3.4 DSIMS depth profile of (a) SeCaT devices comprising PDPP3T:PC71BM
bottom layer and FTAZ:PC71BM top layer, and (b) conventional ternary with 0.5:0.5 wt% of PDPP3T:FTAZ. Top surface at t = 0 s ... 33 Figure 3.5 .2D GI-WAXS patterns of (a) FTAZ: PC71BM binary, (b) PDPP3T:
PC71BM/ FTAZ: PC71BM SeCaT, (c) FTAZ: PC71BM/ PDPP3T: PC71BM SeCaT, (d) PDPP3T: FTAZ (0.2:0.8): PC71BM conventional ternary, (e) PDPP3T: FTAZ (0.5:0.5): PC71BM conventional ternary, (f) PDPP3T: FTAZ (0.8:0.2): PC71BM conventional ternary, and (g) PDPP3T: PC71BM binary films ... 33 Figure 3.6 (a) The DSC traces (10 °C/min) of the first run of PDPP3T:FTAZ blends, (b)
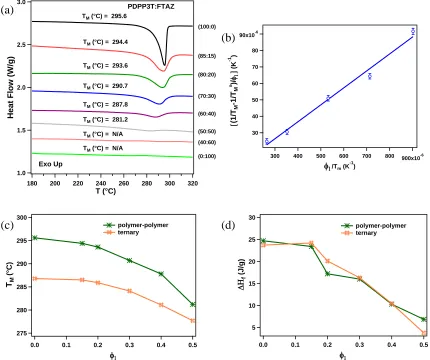
(1 𝑇⁄ 𝑚− 1 𝑇⁄ 𝑚0)/𝜙1 against 𝜙1⁄𝑇𝑚 for PDPP3T:FTAZ blends, (c) melting point, and (d) melting enthalpy of PDPP3T in ternary and polymer-polymer blend as a function of volume fraction of FTAZ (𝜙1) ... 35 Figure 3.7 Hole mobility of polymer-polymer blends as a function of FTAZ volume
fraction ... 36 Figure 3.8 (a) J-V curves, (b) EQE curves, and (c) UV-Vis absorption spectra of
ZnO/FTAZ:PC71BM/PDPP3T:PC71BM SeCaT and binary PSCs. The legends show the donor materials in the films. All the donor materials were mixed with PC71BM ... 39 Figure 3.9 DSIMS depth profile of (a) ZnO/FTAZ:PC71BM/PDPP3T:PC71BM SeCaT,
(b-c) conventional ternaries PDPP3T:FTAZ (0.8:0.2):PC71BM, and PDPP3T:FTAZ (0.2:0.8):PC71BM, (d) FTAZ:PC71BM binary, and (e) PDPP3T:PC71BM binary films ... 40 Figure 4.1 (a) Chemical structure and OSC device configuration of the model system
x the overall composition, i.e. the D/A ratio, in our blend. Here a weight ratio of
1:2 is used for device fabrication, and this corresponds to an initial ϕ0 of 0.36. ϕ1 and ϕ2 are the fullerene-rich and polymer-rich compositions of the binodal for a given χaa. We note that devices processed to have binodal domain composition are metastable (at a given temperature) in the sense that PCBM crystallization is only suppressed but not eliminated and coarsening can occur but is very slow. ... 58 Figure 4.2 (a) Mass and yield normalized SIMS profile of PCDTBT (Batch 2)/PC71BM
bilayers as a function of annealing temperature. TA represents thermal annealing; (b) Device relevant phase diagram of the PCDTBT:PC71BM blend established from the SIMS average composition of the polymer-rich layer. Solid lines indicate binodal/metastable miscibility gap that has been parameterized using FH theory. Bilayer samples were annealed at different temperatures for 5 minutes ... 58 Figure 4.3 (a-b) Typical J-V curves of the PCDTBT (Batch 1):PC71BM and PCDTBT
(Batch 2):PC71BM films annealed at different temperatures under illumination with AM 1.5G solar simulated light (100 mW/cm2); (c) device Jsc and (d) Voc of PCDTBT:PC71BM films as a function of χaa. Red and blue spheres represent Batch 1 and Batch 2, respectively. It is obvious that both Jsc and Voc are less sensitive to χaa compared with device FF ... 61 Figure 4.4 Material contrast of the PCDTBT:PC71BM blend as a function of photon
energy. Maximum material over vacuum contrast can be obtained at ~284 eV ... 63 Figure 4.5 (a) device FF of PCDTBT:PC71BM films cast at room temperature from the
fast-drying solvent chloroform, subsequently annealed for a constant time (10 minutes) as a function of annealing temperature as indicated. b, Device FF of PCDTBT:PC71BM films as a function of χaa. Red and blue spheres represent Batch 1 and Batch 2, respectively. The solid curved lines are directly derived from a [FF=k√(ϕ0 − ϕ1)(ϕ2− ϕ0)+const] model that is based on the binodal ϕ1 and ϕ2 encoded by χaa. c, Lorentz-corrected R-SoXS profiles of PCDTBT:PC71BM films with χ=1.19 (annealed at 90 oC) and χ=0.54 (annealed at 200 oC), i.e. in the two-phase and one-phase region, respectively. The area under the curve is the integrated scattering intensity (ISI). d, Plot of relative ISI acquired from R-SoXS against χaa for PCDTBT (Batch 1):PC71BM films. ISI of the film processed at 20 oC is set to 1. The solid red curved line is directly derived from a quantitative model with ∆ISI =
xi granularity. The red, blue and black dashed arrows indicate the respective χt
for high, medium and low MW polymer at a given blend ratio. ... 64 Figure 4.6 (a) Initial simulation model for the PCDTBT:PC71BM blend. Here, 40
PCDTBT chains (each consisting of 8 repeat units) and 436 PC71BM molecules were used to prepare a 1:2 w/w PCDTBT: PC71BM mixture. (b), ΔHmix/T and ΔH/T from atomistic MD simulations as a function of T derived from conditions that mimic quenching and annealing processes, respectively. The grey band represents variations of the transition points ... 67 Figure 4.7 Heat-only DSC thermograms of pure PffBT-T3 polymer and PffBT-T3:SMA
blends (polymer mass basis). ... 69 Figure 4.8 Thickness/absorption normalized and Lorentz corrected R-SoXS profiles of
the six polymer:SMA systems acquired at 283.4 eV. We note that PffBT-T3:TPE-PDI4 behaved rather differently. It is the only system that does not converge with the others at high q. We believe this is due to a decreased volume fraction of polymer crystals in the thin film due to the low χ of this system. ... 70 Figure 4.9 (a) Chemical structures of all the donor polymers and SMAs used for devices
and systems analyzed by DSC. (b), Plots of ISI as a function of χaa(Tm) of six representative polymer:SMA pairs. Error bars of ISIs for system 1-4 are based on averages from three different synchrotron experimental runs. (c), χaa(Tm) parameters estimated from DSC and its relation to device FFs for 15 pairs of polymer:SMA or polymer:fullerene systems as indicated. FFs from polymer:SMA devices discussed in detail below with films ~ 100 nm thick. FFs from fullerene devices are from recent literature on high-performance fullerene devices, ~200 nm thick. For the conceptual constant FF at low χaa, we have used the FF average of systems 2, 3, 4, and 9. The materials systems with blue numbers correspond to the systems shown in Figure 4.7b. The red solid lines in both (b) and (c) are directly derived from the phase diagram assuming linear FF-ISI1/2 relation for (c). The dashed lines are conceptual and guided by the constant-kink-saturation model expectations. ... 72 Figure 5.1 Schematic illustration of the phase diagrams and selected schematic and
xii system generally proceeds from point A to point C during casting and aging,
although initially, the presence of the solvent alters the phase diagram. Processing conditions are typically chosen to reach the vicinity of point P, were an optimal trade-off between charge creation, charge extraction and charge recombination is achieved if the domain size can be sufficiently controlled ... 92 Figure 5.2 (a) Device architecture of organic solar cells fabricated in this work, (b)
Chemical structures of P3HT and FTAZ as electron donors and ITIC and EH-IDTBR as electron acceptors, (c) representative current density-voltage (J-V) characteristics of optimized fresh devices based on FTAZ:EH-IDTBR, P3HT:EH-IDTBR and FTAZ:ITIC solar cells under 100 mW/cm2 simulated solar light. ... 94 Figure 5.3 (a), (d), (g) Normalized PCE of NF-SMA based solar cells after long-term
storage Dashed lines represent fitted linear or exponential decays. (b, (e), (g) 2D GIWAXS patterns of as-cast films of FTAZ:EH-IDTBR, P3HT:EH-IDTBR and FTAZ:ITIC, respectively. (c), (f), (i) 2D GIWAXS patterns of samples annealed for 10 minutes at 120 °C for FTAZ:EH-IDTBR and P3HT:EH-IDTBR and 180 °C for FTAZ:ITIC and stored for five days. Insets are optical micrographs of the respective samples, except the samples were annealed for 24 hours to enhance the growth of crystals so they can be observed by optical microscopy. ... 96 Figure 5.4. Differential scanning calorimetry data of a) EH-IDTBR, FTAZ, and
FTAZ:EH-IDTBR, b) EH-FTAZ:EH-IDTBR, P3HT, and P3HT:EH-FTAZ:EH-IDTBR, and c) ITIC, FTAZ, and FTAZ:ITIC collected from first heat cycle with 10 °C/min heating rate. All the DSC samples are drop cast form CB solution with 15 mg/mL total concentration ... 99 Figure 5.5 (a) Normalized SIMS profiles of P3HT/EH-IDTBR annealed at different
temperatures, (b) corresponding miscibility gap extracted from temperature-dependent interaction parameter χ(T), after being normalized by degree of crystallinity of P3HT (25%), and (c), (d), and (e) VLM images of FTAZ:EH-IDTBR with 85:15 D/A, P3HT:EH-FTAZ:EH-IDTBR with 90:10 D/A, and FTAZ:ITIC with 85:15 D/A, after being thermally annealed at 160 °C for 24h ... 102 Figure 5.6 Temperature dependence UV-Vis of a) FTAZ:EH-IDTBR with 70:30 D/A
ratio, (b) P3HT:EH-IDTBR with 9:1 D/A ratio, and (c) FTAZ:ITIC with 70:30 D/A ratio. The D/A ratios were chosen in a way that annealed films show the low density of SMA crystals. A high density of the crystals can affect the reliability of the miscibility data due to high scattering of visible light from the crystals ... 103 Figure 5.7 UV-Vis miscibility measurements of different polymer:NF-SMAs.
xiii and FTAZ:ITIC which is consistent with high burn-in of devices made of this
blend. The error in each volume fraction is typically smaller than symbol size .... 104 Figure 5.8 Resonant soft X-ray scattering (R-SoXS) data of (a) FTAZ:EH-IDTBR as cast
film, and (b) P3HT:EH-IDTBR as cast film. By using the peak position as the mode of the domain spacing, the domain spacing of 52 nm and 118 nm was calculated for FTAZ:EH-IDTBR and P3HT:EH-IDTBR, respectively. X-ray energy of 283.4 eV was selected to enhance the material contrast between polymer-rich domains and SMA-rich domains and avoid damage and fluorescence background. Domain size divided by half was assumed to be the average distance that an EH-IDTBR molecule diffuses to reach the pure SMA domain. As a result, 26 nm and 59 nm were used to calculate the diffusion constants of FTAZ:EH-IDTBR and P3HT:EH-IDTBR, respectively. The difference in full width at half maximum (FWHM) in FTAZ:EH-IDTBR, and P3HT:EH-IDTBR can be related to the difference in magnitude of diffusion EH-IDTBR into polymer matrix at room temperature ... 107 Figure 5.9 First-heat and first-cool cycles DSC data of neat P3HT, P3HT:EH-IDTBR
with (0.8:0.2) wt%, and P3HT:O-IDTBR with (0.8:0.2) wt%. The 8:2 D/A ratio was chosen for comparison of melting and crystallization to reduce the effect of eutectic phase formation on melting depression. As can be seen in the first-heat cycle there are two features observable. The lower peak is attributed to EH-IDTBR and OIDTBR crystals melting while the higher temperature peak is from the melting of P3HT crystals. However, in the cool cycle there is only one crystallization peak observable that corresponds to P3HT recrystallization. Due to the absence of SMA recrystallization peak in the cool cycle, the P3HT recrystallization peak temperature is a better scale to compare the temperature depression in these two systems. Recrystallization temperatures of P3HT, in neat P3HT, P3HT:EH-IDTBR, and P3HT:O-IDTBR are 200, 193, and 189 °C, respectively. The DSC data are collected from at 10 °C/min heating and cooling rate. All the DSC samples are drop cast form CB solution with 15 mg/mL total concentration ... 108 Figure 6.1 (a), chemical structures of the polymers and the SMAs used in this study. (b)
xiv dashed lines in phase diagram represent the metastable miscibility gap. And,
the dotted lines represent miscibility gap and liquidus in a highly vitrified system. These states can be reached only through a solid state transition ... 121 Figure 6.2 (a) DSC thermograms of the neat SMAs and polymers collected from the first
heat with 3 and 10 °C/min heating rate. The slower heating rate for neat SMA was used to increase the temperature resolution while faster heating rate in polymer systems was used to increase the sensitivity of the DSC measurement. (b) Normalized SIMS profile of different bilayers annealed at different temperatures, all profiles were shifted horizontally to match the D/A interface for all systems. The annealing temperatures and time are as follows: P3HT:EH-IDTBR at 150 °C for 1 minute, PTB7-Th:EH-IDTBR at 150 °C for 10 minutes, PTB7-Th:di-PDI at 145 °C for 12 hours, PTB7-Th:IT-M at 205 °C for 3 minutes, PTB7-Th:IEICO-4F at 225 °C for 10 minutes, PBDB-T:EH-IDTBR at 140 °C for 5 minutes, PBDB-T:di-PDI at 225 °C for 30 minutes, PBDB-T:IT-M at 225 °C for 3 minutes, and PBDB-T:IEICO-4F at 225 °C for 10 minutes. (c) temperature dependent diffusion of different systems fitted by Arrhenius relation. (d) activation energies extracted from temperature dependent diffusion profiles and Arrhenius relation vs. amorphous-amorphous interaction parameter χaa. ... 124
Figure 6.3 Temperature dependence diffusion coefficient of PC61BM, and IEICO-4F molecules into the polymers with different ductility. ... 127 Figure 6.4 (a) Shelf stability of polymer:SMA devices consisting of polymer and
NF-SMA with different backbone flexibly stored under dark condition in nitrogen filled glovebox. (b), Thermal stability results of three polymers with different ductility each mixed with a planar or flexible NF-SMA ... 129 Figure 6.5 DSC thermograms collected from first heat cycle with 10 °C/min heating rate
of neat EH-IDTBR, P3HT, PTB7-Th, and PBDB-T and the blends of polymer:EH-IDTBR with (8:2) D/A weight ratio. Despite of having the same D/A ratio the melting peak at 218 °C is not observable in PTB7-Th:EH-IDTBR and PBDB-T:EH-IDTBR systems while a clear melting peak can be seen in P3HT:EH-IDTBR system. The absence of EH-IDTBR melting peak in PTB7-Th and PBDB-T system is due to the vitrified NF-SMA crystallization in these systems ... 131 Figure 6.6 2D-GIWAXS patterns of (a) and (d) P3HT:EH-IDTBR as-cast and thermally
xv Figure 6.7 2D-GIWAXS patterns of as-cast and thermally annealed a-d, FTAZ:ITIC and
e-h, PBDB-T:ITIC films. The thermal annealed samples were annealed at elevated temperatures for 10 minutes ... 132 Figure 6.8 (a), COS measurements performed on the neat polymers and their binary
1
Chapter 1
Introduction
1.1 Thermodynamic of a binary blend
Organic solar cells’ active layers usually are a mixture of two (binary) or three (ternary) materials. The degree of mixing in organic solar cells and in general any blends is mainly governed by thermodynamic drivers[1, 2]. If components of blends are uniformly mixed on a molecular scale, the mixture is called homogeneous. A good example of the homogeneous system is a solution of salt in water. Otherwise, if the blend consists of different phases with different composition of materials in each phase the blend is called heterogeneous, or a phase separated system. An example of a heterogeneous system is oil and water. Miscibility and in general thermodynamic of a blend have a profound impact on the morphology of a system. Mixing of two materials is governed by
two factors; entropy ∆𝑆̅𝑚𝑖𝑥 and energetic interaction of the two different components (∆𝐻𝑚
enthalpy of mixing) which will be discussed in details in the following sections[3, 4].
1.2 Entropy of mixing
2 the nature of the bonds between monomer units, which ultimately decides polymer conformation and hence entropy of mixing. The link between different monomers in a polymer suppresses the randomness of the choosing a lattice site in a blend which decreases the number of ways that the blend can be arranged. Figure 1.1 shows the schematic of a small molecule:small molecule, and polymer:small molecule mixture in a 2D lattice. The entropy of mixing per lattice site is an intrinsic thermodynamic quantity which is defined as[3]:
∆𝑆̅𝑚𝑖𝑥 = −𝑘 [ 𝜙𝐴
𝑁𝐴ln 𝜙𝐴+ 𝜙𝐵
𝑁𝐵ln 𝜙𝐵] (1.1)
Where k is the Boltzmann constant, NA, and NB are the number of lattice sites occupied by each
respective molecule, and A, and B are the volume fraction of the two components in the binary
mixture. Since A, and B are less than one and the ∆𝑆̅𝑚𝑖𝑥 is always positive, the entropy of the
blend always favors mixing. Ideal solutions are the mixtures where the different components have an ideal segment size and there is no difference between the energetic interactions of the components. The latter condition means the energetic interactions of “like” and “unlike” are the same which leads to the athermal mixing (∆𝐻𝑚 = 0). Ideal solution always leads to a homogenous mixture as the entropy interaction is the only part which defines the change in the Gibbs free energy of the system. One of the main assumption in entropy of mixing calculation is that there is no volume change upon mixing. However, the polymer blends have shown to have small volume change upon mixing. Also, this entropy of mixing does not include other types of entropy such as rotational, and vibrational entropies. For an ideal solution, the Gibbs free energy of mixing is given by:
∆𝐺̅𝑚𝑖𝑥𝑖𝑑𝑒𝑎𝑙 = −𝑇∆𝑆̅
𝑚𝑖𝑥 = 𝑘𝑇 [ 𝜙𝐴
𝑁𝐴ln 𝜙𝐴+ 𝜙𝐵
3 If we define
A as
and
B as (1-
)then we will get:∆𝐺̅𝑚𝑖𝑥𝑖𝑑𝑒𝑎𝑙 = −𝑇∆𝑆̅
𝑚𝑖𝑥 = 𝑘𝑇 [ 𝜙
𝑁𝐴ln 𝜙 +
(1 − 𝜙)
𝑁𝐵 ln(1 − 𝜙)] (1.3)
Figure 1.1. Schematic representation of a lattice, (a) a mixture of two small molecules with similar size, (b) a polymer:SMA mixture with NB=10, in which polymer segments have similar size with small molecule.
1.3 Energetic interaction of mixing and interaction parameter
The energy of mixing per lattice site is defined as[3]
Δ𝐻̅𝑚𝑖𝑥 = 𝑧
2𝜙(1 − 𝜙)(2𝑢𝐴𝐵− 𝑢𝐴𝐴− 𝑢𝐵𝐵) (1.4)
Where z is the number of nearest neighbors in the lattice or coordination number, is the volume
fraction of component A, uAA, uBB, and uAB are the pairwise interaction energies between “like” and
4 For an ideal solution with a homogenous mixture, uAA = uBB = uAB as previously discussed. The
coordination number z and the lattice Gibbs free energy changes are not easily accessible, so they are eliminated by introducing Flory-Huggins interaction parameter commonly known as χ (Equation 1.5). The Flory-Huggins interaction parameter as a function of temperature essentially has all the information one needs to know about the phase behavior of an amorphous-amorphous blend.
𝜒 = 𝑧 2
(2𝑢𝐴𝐵− 𝑢𝐴𝐴− 𝑢𝐵𝐵)
𝑘𝑇 (1.5)
As a result, the Gibbs free energy of mixing can be written as:
∆𝐺̅𝑚𝑖𝑥𝑖𝑑𝑒𝑎𝑙 = Δ𝐻̅
𝑚𝑖𝑥− 𝑇∆𝑆̅𝑚𝑖𝑥 = 𝑘𝑇 [ 𝜙
𝑁𝐴ln 𝜙 +
(1 − 𝜙)
𝑁𝐵 ln(1 − 𝜙) + 𝜒𝜙(1 − 𝜙)] (1.6)
A blend with negative interaction parameter χ<0 is a homogenous mixture, χ=0 leads to the ideal solution and χ>0 can lead to phase separation depending on the entropy contribution of the system. In a polymer:polymer blend, the small contribution of the entropy of mixing (small positive χ) leads to phase separation of the two polymers. Once the systems in hand are polymer:small molecule, phase separation only takes place at larger χ compared to polymer:polymer system due to a larger contribution of entropy which favors the mixing. χ is usually expressed in the form of the sum of two factors (Equation 1.7), but this format of χ can be considered an oversimplification as it does not consider the dependence on composition and chain length in case of polymer blends.
𝜒 = 𝐴 + 𝐵 𝑇⁄ (1.7)
5 the entropic changes due to the interaction between the components which was not considered in mixing entropy. In general, if B>0, increasing T leads to the decrease in the interaction parameter magnitude and subsequently more degree of mixing in a blend: such systems are called upper critical solution temperature (UCST) systems (Figure 1.2). On the other hand, if B<0, an increase in temperature leads to more phase separation, and these systems are known as lower critical solution temperature (LCST). Real systems can have both the USCT and LSCT behavior in different part of the phase diagram.
The contribution of the entropic term in Gibbes free energy reduces with lowering the temperature, and as a result, in lower temperatures the energetic interaction plays a more important role in determining the phase behavior of a system. Therefore, at low temperature, for a system with B>0, there is a higher probability for the homogenous mixture to phase separate into two phases separated states. The transition from the homogenous mixture to phase separated states depends on the curvature of the change in the Gibbes free energy at a certain temperature. A system
with the initial volume fraction of
is unstable and phase separate if the second derivative ofGibbes free energy with respect to volume fraction is negative. Subsequently, a system can be stable if the second derivative of Gibbes free energy is positive. That means the curvature of the Gibbs free energy (concave or convex) determines that stability of the system.
6 phase separates into two different phases. These compositions at inflection points are known as spinodal compositions. Spinodal compositions are not the compositions with lowest free energy. To reach the lowest free energy system can further phase separate. These phases have two criteria, first; they must have lower free energy compared to spinodal composition, and second; the chemical potentials of these two phases must be equal. The latter criterion is the common tangent rule in thermodynamic as the chemical potential can be defined as a partial molar of Gibbs free energy. These points are known as binodal composition. The main step in understanding the phase behavior of a system is measuring the temperature-dependence interaction parameter which essentially has all the information needed to predict the phase behavior.
7
1.4 Determination of Flory-Huggins interaction parameter
In this section, we present an overview of some of the measurement techniques used for extraction of Flory-Huggins interaction parameter. Each of these methods has some pros and cons which will be discussed in details.
1.4.1 Differential scanning calorimetry
Measurement of the melting point temperature (Tm) depression of blends for the first time was
used by Nishi and Wang to determine the Flory-Huggins interaction parameter χ of polymers in the melt state[5]. The smaller the value of χ the greater the polymer-polymer interaction and the larger the melting point depression. The difference between the chemical potential per mole of crystallizable polymer 𝜇2𝑢1 units in the mixture and in its pure liquid state 𝜇2𝑢0 can be defined as:
𝜇2𝑢1− 𝜇2𝑢0 = − 𝑅𝑇𝑣2
𝑣1 [ 𝑙𝑛 𝜙2
𝑚2 + ( 1 𝑚2−
1
𝑚1) × (1 − 𝜙2) + 𝜒(1 − 𝜙2)
2] (1.8)
where subscript 1 is identified with an amorphous polymer or small molecule and 2 with the semi-crystalline polymer, 𝑅 the ideal gas constant, 𝑣 is the monomer molar volume of the polymer or small molecule, 𝜙 the volume fraction, and m the degree of polymerization. The difference in the chemical potential between crystalline polymer unit and the same unit in the pure liquid state can be written as:
𝜇2𝑢𝑐 − 𝜇
2𝑢0 = −(Δ𝐻𝑓− 𝑇Δ𝑆2𝑢) = −Δ𝐻𝑓(1 − 𝑇 𝑇⁄ 𝑚,20) (1.9)
8
1 𝑇𝑚,2−
1
𝑇𝑚,20 = − 𝑅 𝛥𝐻𝑓
𝑣2 𝑣1[
𝑙𝑛 𝜙2 𝑚2 + (
1 𝑚2−
1
𝑚1) × (1 − 𝜙2) + 𝜒(1 − 𝜙2)
2] (1.10)
Where 𝑇𝑚 is the melting point of the mixture, 𝑇𝑚0the melting point of pure semi-crystalline
polymer, 𝛥𝐻𝑓 the melting enthalpy of pure semi-crystalline polymer. In the case of the
polymer:polymer blend, since 𝑚1 and 𝑚2 are infinitely greater than 1, equation 1.9 reduces to:
1 𝑇𝑚,2−
1
𝑇𝑚,20 = − 𝑅 𝛥𝐻𝑓
𝑣2
𝑣1𝜒(1 − 𝜙2)2 (1.11)
While in the case of polymer:small molecule blend, with m1=1 and m2 >>1, equation 1.9 reduces
to
1 𝑇𝑚,2−
1 𝑇𝑚,20 = −
𝑅 ∆𝐻𝑓
𝑣2
𝑣1[−(1 − 𝜙2) + 𝜒(1 − 𝜙2)2] (1.12)
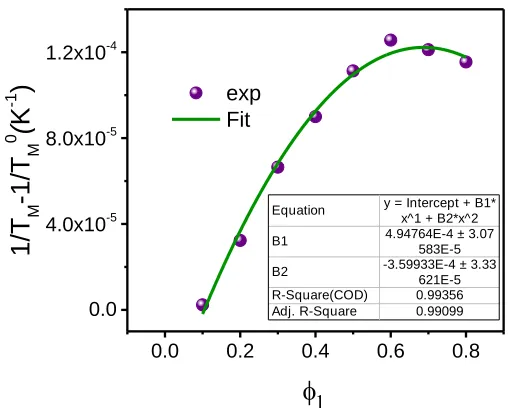
Figure 1.4 shows one example where equation 1.11 was used to fit the crystallization temperature depression of P3HT which is a semi-crystalline polymer mixed with a non-fullerene small molecule acceptor (NF-SMA), namely EH-IDTBR. Since EH-IDTBR is a crystalline SMA, the cool cycle was used instead of heating as the backbone crystallization of the EH-IDTBR was suppressed during the cool cycle (see Figure 1.3). χ = 0.71 was extracted for the blend of P3HT:EH-IDTBR at the P3HT melting point of 241 °C. To fit the crystallization depression data, the following equation was used.
1 𝑇𝑚,2−
1 𝑇𝑚,20 = −
𝑅 ∆𝐻2
𝑣2
𝑣1[−𝜙1+ 𝜒𝜙12] = 1 𝑇𝑚,2−
1
𝑇𝑚,20 = 𝑎𝜙1+ 𝑏𝜙12 (1.13)
𝜒 =−𝑏
9 Figure 1.3. DSC thermograms of blends of P3HT:EH-IDTBR with different D/A ratio. (a) Data collected from first heat and (b) themorgrams collected from first cool cycle. Heating and cooling rate of 10 °C/min was used for all the samples.
Figure 1.4. Phase diagram of the P3HT:IDTBR system at different D/A ratio. P3HT and EH-IDTBR are assumed to have similar molar density.
The advantage of using DSC to extract the amorphous-amorphous interaction parameter is the wide accessibility of the DSC instruments. However, there are some limitations associated with the DSC method. DSC only provides χ close to the melting point of the crystalline component, not
0.0 0.2 0.4 0.6 0.8
0.0 4.0x10⁻⁵ 8.0x10⁻⁵ 1.2x10⁻⁴
exp Fit
1/T
M
-1/T
M
0
(
K
-1)
Equation y = Intercept + B1* x^1 + B2*x^2
B1 4.94764E-4 ± 3.07
583E-5
B2 -3.59933E-4 ± 3.33
10 the temperature-dependence χ(T). It also does not work for the systems consisting of two amorphous components, especially the organic semiconductors which usually do not show a strong glass transition as well.
1.4.2 The solubility parameter approach
The square root of the energy of vaporization per unit volume is known as cohesive energy density in the pure state of a molecule A. The interaction energy per site in the pure A state is zuAA/2
which is related to the cohesive energy density and subsequently solubility parameter as:
−𝑧𝑢𝐴𝐴 2 = 𝑣0
Δ𝐸𝐴
𝑣𝐴 = 𝑣0𝛿𝐴2 𝑎𝑛𝑑 − 𝑧𝑢𝐵𝐵
2 = 𝑣0 Δ𝐸𝐵
𝑣𝐵 = 𝑣0𝛿𝐵2 (1.15)
Where v0 is the volume per site, E is the energy of vaporization and v is the volume of the
molecule. Subscripts A and B identify the molecules A and B, respectively.
By using geometric mean approximation, one can estimate the cohesive energy interaction between component A and B which can be written as:
−𝑧𝑢𝐴𝐵
2 = 𝑣0𝛿𝐴𝛿𝐵 (1.16)
Equation 1.14 and 1.15 allow us to write the Flory-Huggins interaction parameter as:
𝜒 ≈ 𝑣0[𝛿𝐴2+ 𝛿𝐵2−2𝛿𝐴𝛿𝐵]
𝑘𝑇 =
𝑣0
𝑘𝑇(𝛿𝐴 − 𝛿𝐵)2 (1.17)
11 guide to compatibility is needed, i.e. choosing a good solvent for a specific material, etc. There are also some methods which calculate an estimation of δ based on the knowledge of the repeat unit structure and density[4, 6].
1.4.3 UV-Vis method
The recently introduced UV-Vis method by H. Ade et al. can be used to monitor the relative thermodynamic behavior of polymer:small molecule blends[7]. In this approach, the temperature dependent miscibility in the presence of the small molecule crystals can be characterized by a combination of visible light microscopy (VLM) and conventional UV-Vis absorption spectroscopy. In the UV-Vis experiment, optical density (O.D.) is evaluated by measuring the transmission intensity with the active layer (I) and without the active layer (I0) and calculated as
O.D. = -log(I/I0). Subsequently, the UV-Vis absorption spectra of the neat films and thermally
12 the amorphous-amorphous interaction parameter. Despite the easy accessibility of the UV-Vis method and its usefulness to measure the effect of both amorphous and amorphous-crystal interaction, this method works mainly for the system consisting of a amorphous-crystallizable small molecule and cannot provide reliable information for a system with composing entirely amorphous materials. In addition, due to slow crystal growth in polymer system, which makes these systems to be far from equilibrium, the UV-Vis method might not be able to provide reliable information regarding the miscibility of the all-polymer system.
1.4.4 Secondary Ion Mass Spectrometry (SIMS)
13 small molecule into polymer continues until the composition of the small molecule in the polymer matrix reaches to the equilibrium composition at each temperature. In the next step, the equilibrium compositions at different temperatures can be converted to amorphous-amorphous interaction parameter using the Flory-Huggins theory of mixing. The SIMS profiles of PCDTBT/PC71BM bilayer samples annealed at different temperatures to the equilibrium composition is depicted in Figure 1.6. The advantage of SIMS compared to other methods such as UV-Vis and DSC is that SIMS does not require crystallinity of any of the component, which means it can be used even for a system that consists of an amorphous polymer and a small molecule. However, the SIMS method, due to the low diffusion of polymers, cannot be used to monitor the thermodynamic behavior of an all polymer blend.
14 Figure 1.6. SIMS profiles of PCDTBT/PC71BM bilayer annealed at different temperatures.
0 100 200 300
0.00 0.25 0.50 0.75 1.00
Ref 150 °C 160 °C 170 °C 180 °C
PCDTBT volume fract
ion
15
REFRENCES
[1] S. Günes, H. Neugebauer, N. S. Sariciftci, Chemical Reviews 2007, 107, 1324.
[2] L. Lu, T. Zheng, Q. Wu, A. M. Schneider, D. Zhao, L. Yu, Chemical Reviews 2015, 115, 12666.
[3] P. J. Flory, Principles of polymer chemistry, Ithaca : Cornell University Press, 1953., 1953. [4] M. Rubinstein, R. H. Colby, Polymer Physics, Oxford University Press, 2003.
[5] T. Nishi, T. T. Wang, Macromolecules 1975, 8, 909.
[6] H. Bin, Y. Yang, Z.-G. Zhang, L. Ye, M. Ghasemi, S. Chen, Y. Zhang, C. Zhang, C. Sun, L. Xue, C. Yang, H. Ade, Y. Li, Journal of the American Chemical Society 2017, 139, 5085. [7] Z. Peng, X. Jiao, L. Ye, S. Li, J. J. Rech, W. You, J. Hou, H. Ade, Chemistry of Materials
2018, 30, 3943.
[8] L. Ye, H. Hu, M. Ghasemi, T. Wang, B. A. Collins, J.-H. Kim, K. Jiang, J. H. Carpenter, H. Li, Z. Li, T. McAfee, J. Zhao, X. Chen, J. L. Y. Lai, T. Ma, J.-L. Bredas, H. Yan, H. Ade,
Nature Materials 2018, 17, 253.
16
Chapter 2
Structure-function relation of organic solar cells
2.1 Bulk heterojunction organic solar cells
Due to the low dielectric constant of organic materials (3-5) the probability of exciton dissociation in the absence of an internal field is small, while the strong intermolecular interaction in inorganic crystalline materials leads to delocalization of photo-generated excitons and their dissociation at room temperature[1,2]. Subsequently, to create the internal filed that is essential for exciton dissociation in organic systems heterojunction donor-acceptor structure was proposed by Chiang Tang in 1986. Chiang’s cell which employed a planar heterojunction (PHJ) structure showed about %1 power conversion efficiency (PCE)[3]. The next breakthrough in OCS technology was achieved after a bulk heterojunction (BHJ) structure was utilized. BHJ is a mixed layer of donor and acceptor materials[4]. The main advantage of BHJ compared to PHJ is the larger areas of donor/acceptor interfaces which lead to higher exciton dissociation rate. Besides the increase in efficiency, the solution cast BHJ also simplify the manufacturing process as both the donor and acceptor materials in the active layer can be cast simultaneously from a common solvent. The phase structure of the donor-acceptor active layer defines its morphology. The morphology of the active layer should meet two important criteria to be able to function as an efficient active layer. First, it needs to provide enough interface for dissociation of photo-generated excitons which can be achieved by proper amount of mixing, and second, it should provide the closed percolation paths for electrons and holes to be collected at electrodes.
17 morphology of BHJ solar cells, during the film formation and device operation, is governed by both the kinetic and thermodynamic properties of the donor and acceptor materials. Unfortunately, due to weak non-covalent interaction between the donor and acceptor materials and the disorder nature of the organic materials used in BHJ solar cells, the prediction of the precise outcome morphology is more complicated compared to their inorganic crystalline counterparts. The most common type of BHJ solar cell is the polymer:SMA blend which is consisting of the a semiconducting polymer donor mixed with a semiconducting small molecule acceptor. In the BHJ solar cell, the actual morphology typically comprises multiple phases depending on the materials used[8, 9]. For an amorphous polymer donor and with suppression of the crystallization of the SMA, the phase diagram is asymmetric and there are only the acceptor-rich small molecule domain that is almost pure in sufficiently immiscible systems and the donor-rich mixed amorphous domain. In addition to these two domains, a semi-crystalline donor has an additional pure polymer domain[10].
2.2 Device characteristics and their correlation with the active layer
morphology
Power conversion efficiency of an OSC is the product of short circuit current (JSC), open
circuit voltage (VOC), and fill factor (FF) normalized with the incident power density. Each of these
18 dissociation mainly takes place at the D/A interface, increasing the effective D/A interface leads to an increase in free charges that potentially can increase the JSC. L. Ye et.al. showed that purity
of the mixed domains in a polymer:SMA system is linearly correlated to the JSC[13]. This finding
shows that besides the D/A interface, which governs the exciton dissociation rate, the purity of the polymer:SMA domains, which governs the charge transport and recombination (loss mechanism) rate, also affect the JSC. The next step in conversion of solar energy to electricity is the extraction
of the free charges. Unlike inorganic crystalline semiconductor where the wave function of the electron and hole are sufficiently extended to mimic a wave packet and subsequently a band-like charge transport, in organic materials the charge transport takes place through hopping between energetically and spatially disordered sites. As a result, organic semiconductors used in OSCs are usually characterized with electron and hole mobility that are orders of magnitude smaller than those obtained in their inorganic counterparts. The longer time charges remain in the active layer, the higher is the probability of the bimolecular and trap associated recombination. The unbalanced electron and hole mobility in an active layer was also shown to be detrimental for device performance due to the buildup of electrons or holes in the active layer which leads to bimolecular recombination[14].
On the other hand, FF is the parameter that mainly reflects the competition between the recombination and extraction in OCSs and has shown to be quantitatively related to phase behavior of the mixed amorphous phase of the polymer:SMA[10, 15]. The higher purity of these mixed phases facilities an easier charge transport in the active layer which results in higher FF. However, devices with very high purity of the mixed domains can also experience efficiency loss due to losing the closed percolation path in the domains. The VOC of an OCS has shown to be mainly dominated by
19 morphological changes caused by processing conditions. K. Vandewal and co-workers showed that even in the blends with similar ECT state the change in the effective D/A area affects VOC.[16] Although enough D/A ratio is needed for efficient charge dissociation, the ratio should be low enough to ensure longer life-time of free electrons and holes. Furthermore, efficacy of ternary organic solar cells is also found to be closely related to the morphology of the blend. Compared to the binary blends, ternary blends have a more complicated phase behavior due to the presence of the third material. However, most of the high performance organic materials lack the ability to absorb a wide range of photon energies. In line with the requirement of panchromatic absorption for high current generation (high JSC) ternary blends have been employed to address the optical
20 Figure 2.1. (a) Schematic of the an OSC with inverted structure. (b) Typical current density-voltage and power-density-voltage curves.
2.3. Morphological stability of OCS
2.3.1 Amorphous-amorphous phase separation
21 over-purification can lead to a composition below the percolation threshold and subsequently an increase in bimolecular and trap recombination rates in the device. To achieve an OSC with a stable amorphous-amorphous mixed phase, one needs to either use a system with a percolation threshold composition close to miscibility gap or the transition from optimum composition to miscibility gap needs to be suppressed via a vitrified morphology.
2.3.2 Small molecule crystallization
22
REFRENCES
[1] L. Lu, T. Zheng, Q. Wu, A. M. Schneider, D. Zhao, L. Yu, Chemical Reviews 2015, 115, 12666.
[2] S. Günes, H. Neugebauer, N. S. Sariciftci, Chemical Reviews 2007, 107, 1324. [3] C. W. Tang, Applied Physics Letters 1986, 48, 183.
[4] G. Yu, J. Gao, J. C. Hummelen, F. Wudl, A. J. Heeger, Science 1995, 270, 1789.
[5] Y. Liu, J. Zhao, Z. Li, C. Mu, W. Ma, H. Hu, K. Jiang, H. Lin, H. Ade, H. Yan, Nature Communications 2014, 5, 5293.
[6] J. Zhao, Y. Li, G. Yang, K. Jiang, H. Lin, H. Ade, W. Ma, H. Yan, Nature Energy 2016, 1, 15027.
[7] A. C. Stuart, J. R. Tumbleston, H. Zhou, W. Li, S. Liu, H. Ade, W. You, Journal of the American Chemical Society 2013, 135, 1806.
[8] M. Subhrangsu, J. Xuechen, A. Harald, Advanced Energy Materials 2016, 6, 1600699. [9] N. Gasparini, X. Jiao, T. Heumueller, D. Baran, G. J. Matt, S. Fladischer, E. Spiecker, H.
Ade, C. J. Brabec, T. Ameri, Nature Energy 2016, 1, 16118.
[10] L. Ye, H. Hu, M. Ghasemi, T. Wang, B. A. Collins, J.-H. Kim, K. Jiang, J. H. Carpenter, H. Li, Z. Li, T. McAfee, J. Zhao, X. Chen, J. L. Y. Lai, T. Ma, J.-L. Bredas, H. Yan, H. Ade, Nature Materials 2018, 17, 253.
[11] K. Vandewal, K. Tvingstedt, A. Gadisa, O. Inganäs, J. V. Manca, Nature Materials 2009, 8, 904.
[12] V. Koen, G. Abay, O. W. D., B. Sabine, B. Fateme, V. S. Ineke, L. Laurence, C. T. J., V. Dirk, M. J. V., Advanced Functional Materials 2008, 18, 2064.
[13] Y. Long, J. Xuechen, Z. Shaoqing, Y. Huifeng, Q. Yunpeng, A. Harald, H. Jianhui, Advanced Energy Materials 2017, 7, 1601138.
[14] W. Li, S. Albrecht, L. Yang, S. Roland, J. R. Tumbleston, T. McAfee, L. Yan, M. A. Kelly, H. Ade, D. Neher, W. You, Journal of the American Chemical Society 2014, 136, 15566. [15] D. Bartesaghi, I. d. C. Pérez, J. Kniepert, S. Roland, M. Turbiez, D. Neher, L. J. A. Koster,
Nature Communications 2015, 6, 7083.
[16] V. Koen, W. Johannes, H. Thomas, B. C. J., M. M. D., L. Karl, R. Moritz, S. Alberto, Advanced Materials 2014, 26, 3839.
[17] G. Masoud, Y. Long, Z. Qianqian, Y. Liang, K. Joo-Hyun, A. Omar, Y. Wei, G. Abay, A. Harald, Advanced Materials 2017, 29, 1604603.
[18] M. W. R., M. M. D., Advanced Materials 2017, 29, 1603940.
[19] N. Li, J. D. Perea, T. Kassar, M. Richter, T. Heumueller, G. J. Matt, Y. Hou, N. S. Güldal, H. Chen, S. Chen, S. Langner, M. Berlinghof, T. Unruh, C. J. Brabec, Nature Communications 2017, 8, 14541.
23 [21] S. Li, L. Ye, W. Zhao, H. Yan, B. Yang, D. Liu, W. Li, H. Ade, J. Hou, Journal of the
American Chemical Society 2018, 140, 7159.
[22] C. Yen-Ju, H. Chao-Hsiang, L. Pei-Jung, H. Chain-Shu, Advanced Functional Materials 2011, 21, 1723.
[23] N. D. Treat, T. E. Mates, C. J. Hawker, E. J. Kramer, M. L. Chabinyc, Macromolecules 2013, 46, 1002.
24
Chapter 3
Panchromatic Sequentially-Cast
Ternary Polymer Solar Cells
3.1 Preface
Due to complexity of materials interactions (e.g., miscibility/alloying) in ternary systems, morphology control is one of the key strategies in optimizing the performance of ternary polymer solar cells (PSCs). Respectively, introducing a new method to overcome morphological complexities in ternary systems presents a significant challenge that requires understanding the underline physics, which governs the materials interactions in these systems. In this work, we utilized two donor polymers that have shown excellent photovoltaic performance in binary systems with fullerene, have ideal complementary absorption properties, but fail as a conventional ternary device due to polymer-polymer alloying on account of a negative Flory–Huggins interaction parameter (χ) between these two polymers. We demonstrated a unique sequential deposition
strategy that circumvents the detrimental morphological outcomes associated with the traditional ternary blends. The sequential casting approach has improved device performance by preventing the alloy formation of donor polymers and developing stratified bulk heterojunction solar cells by deliberately selecting a difficult-to-dissolve binary bulk heterojunction with a crystalline donor as the bottom layer.
Harald Ade and Abay Dinku conceived the general idea of the work. I made the OSC devices and also performed the thermal analyses of the work. This work was published in
25
3.2 Introduction
Most recent improvements in the power conversion efficiency (PCE) of polymer solar cells (PSCs) have been attained through better understanding of material structure‒property relationships that resulted in the synthesis of well-designed polymers and molecules with enhanced structural and electronic properties.[1–5] However, most of these high performance organic materials lack the ability to absorb a wide range of photon energies. In line with the requirement of panchromatic absorption for high current generation, low bandgap materials,[4,6,7] ternary blends[8–10] and tandem[11–13] device structures have been employed to address the optical limitations of current state-of-the art materials. Of these, ternary PSCs that consist of two donor and one acceptor (or two acceptors and one donor) have been considered the simplest strategy to broaden the optical absorption range in PSCs,[14–16] if the selected donors and acceptors have complementary absorption. Unfortunately, even though a few breakthroughs were achieved,[8,17,18] many of the ternary devices are limited by low fill factor (FF) and/or low short circuit current (JSC) after adding more than ~15-20% of the third component[19–23]. Many systems with excellent optical and electronic matches often fail to deliver their promises.[24,25] Due to the complexity of material interactions (e.g., miscibility/alloying) in ternary systems and the lack of appropriate tools to accurately study or predict these interactions, the most common practice for investigating ternary systems has largely been based on trial and error. In general, achieving favorable morphology is the limiting factor even in binary systems,[26–28] and the complex and often unfavorable morphology of the ternary device only exacerbates the issue of morphology optimization.
26 Huggins interaction parameter (χ) between these two polymers. This is the first time that a polymer-polymer χ has been accurately measured for PSC materials.[25] We demonstrate a unique sequential deposition strategy that circumvents these detrimental morphological outcomes associated with the traditional ternary blend. Our method gives rise to a favorable geometry and is simpler than lamination, but yields similar layered structures. While sequential casting has previously been used for the fabrication of binary PSCs,[29–34] it has never been utilized for casting stacks of different binary bulk heterojunction (BHJ) films, let alone for materials that form alloys. Our sequential casting approach has prevented alloying and improved device performance by deliberately selecting a difficult-to-dissolve binary BHJ with a crystalline donor as the bottom layer.
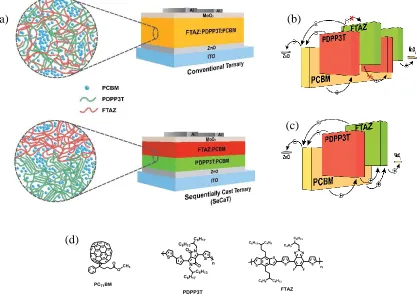
28 Figure 3.2. (a) Schematic of conventional ternary and SeCaT solar cells with ZnO as electron and MoO3 as hole transport layers, creating an inverted device architecture. Schematic of energy levels of (b) conventional ternary, and (c) SeCaT with vertically segregated morphology, which provides suitable pathways for electron and, more importantly, hole charge transport. (d) The chemical structures of donor polymers and the fullerene acceptor.
3.3 Results and Discussion
3.3.1 OCS characterization
Taking advantage of the hard-to-dissolve, stable aggregation behavior of PDPP3T, we successfully fabricated SeCaT devices with a vertical phase segregated morphology. Specifically, the semicrystalline PDPP3T:PC71BM BHJ blend was first spin-cast on top of a conducting substrate from warm solution (100-110 °C). It provided a stable (i.e., solvent-resistant) bottom layer onto which the FTAZ:PC71BM blend is cast from room temperature solution without the
(d)
(c)
29 need for an orthogonal solvent. Since holes move slightly better from PDPP3T to FTAZ than in the other direction as shown via transport measurements in bilayer, hole-only diodes an inverted device architecture is used.
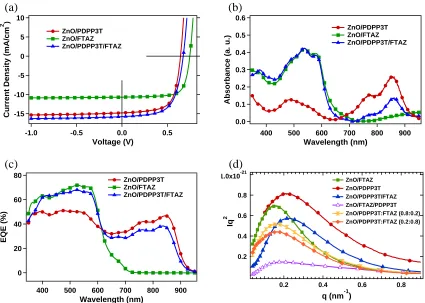
Current density-voltage (J-V) characteristics of the SeCaT, conventional ternary, and corresponding binary single layer PSCs are shown in Figure 3.3a, and the respective photovoltaics parameters and thicknesses are summarized in Table 3.1. To assure a fair and simple comparison and keeping the extracting field relatively similar by having similar overall thicknesses, the SeCaT films were fabricated in such a way that the high performance top, medium-bandgap FTAZ layer has the same absorption coefficient as its corresponding binary blend film (Figure 3.3b) with the thin film of PDPP3T:PC71BM added for extra absorption. Indeed, the SeCaT devices (ZnO/PDPP3T:PC71BM/FTAZ:PC71BM) show significantly improved performance over the FTAZ reference cell and better overall performance compared to either binary counterparts. This is primarily due to excellent contributions of both donors to the short-circuit current (JSC), as shown
in the external quantum efficiency (EQE) spectra (Figure 3.3b), moderated by an open-circuit voltage (VOC) that is equivalent to the average VOC of the binary single layer devices. The EQE
30 Figure 3.3. (a) J-V curves, (b) UV-Vis absorption spectra of SeCaT and binary PSCs, and (c) External Quantum Efficiency (EQE) (d) Lorentz-corrected and thickness normalized circular averaged resonant soft X-ray scattering (R-SoXS) profiles of ZnO/FTAZ:PC71BM, PDPP3T: PC71BM, PDPP3T: PC71BM/ FTAZ: PC71BM, FTAZ: PC71BM/ PDPP3T: PC71BM, (PDPP3T:FTAZ=0.2:0.8): PC71BM, and (PDPP3T:FTAZ=0.8:0.2): PC71BMfilms, at 284.2 eV.
(b) (a) -15 -10 -5 0 5 10 Current Dens it y ( mA/cm 2 )
-1.0 -0.5 0.0 0.5
Voltage (V) ZnO/PDPP3T ZnO/FTAZ ZnO/PDPP3T/FTAZ 0.6 0.5 0.4 0.3 0.2 0.1 0.0 Abs orbanc e ( a. u.) 900 800 700 600 500 400 Wavelength (nm) ZnO/PDPP3T ZnO/FTAZ ZnO/PDPP3T/FTAZ (d) (c) 80 60 40 20 0 EQE (% ) 900 800 700 600 500 400 Wavelength (nm) ZnO/PDPP3T ZnO/FTAZ ZnO/PDPP3T/FTAZ 1.0x10⁻²¹ 0.8 0.6 0.4 0.2 Iq 2 0.8 0.6 0.4 0.2
q (nm-1)
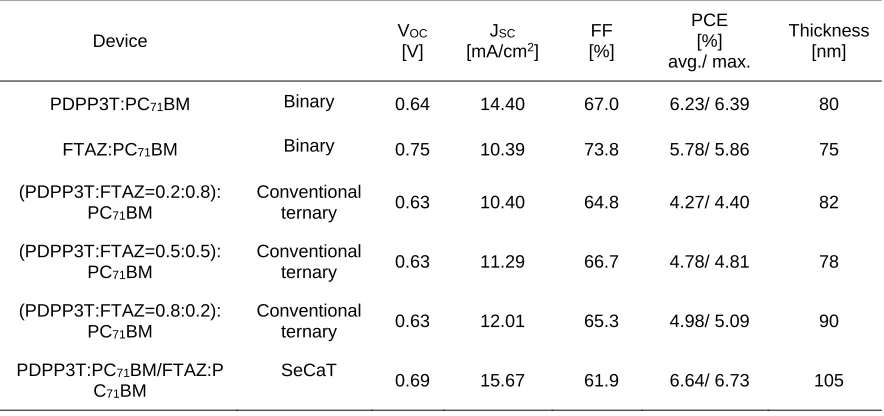
31 Table 3.1. Device performance of the binary, conventional ternary, and SeCaT PSCs.
Device VOC
[V]
JSC
[mA/cm2]
FF [%] PCE [%] avg./ max. Thickness [nm]
PDPP3T:PC71BM Binary 0.64 14.40 67.0 6.23/ 6.39 80
FTAZ:PC71BM Binary 0.75 10.39 73.8 5.78/ 5.86 75
(PDPP3T:FTAZ=0.2:0.8):
PC71BM
Conventional
ternary 0.63 10.40 64.8 4.27/ 4.40 82
(PDPP3T:FTAZ=0.5:0.5):
PC71BM
Conventional
ternary 0.63 11.29 66.7 4.78/ 4.81 78
(PDPP3T:FTAZ=0.8:0.2):
PC71BM
Conventional
ternary 0.63 12.01 65.3 4.98/ 5.09 90
PDPP3T:PC71BM/FTAZ:P
C71BM
SeCaT
0.69 15.67 61.9 6.64/ 6.73 105
3.3.2 Active layer morphology
32 the bottom PDPP3T:PC71BM is not much disturbed by the subsequent casting of the FTAZ:PC71BM. Domain spacing of conventional ternary (39-40 nm), and ZnO/FTAZ:PC71BM/PDPP3T:PC71BM SeCaT (35 nm) exhibit only slightly larger phase separation in these films.
3.3.3 Depth profilometry
33 Figure 3.4. DSIMS depth profile of (a) SeCaT devices comprising PDPP3T:PC71BM bottom layer and FTAZ:PC71BM top layer, and (b) conventional ternary with 0.5:0.5 wt% of PDPP3T:FTAZ. Top surface at t = 0 s.
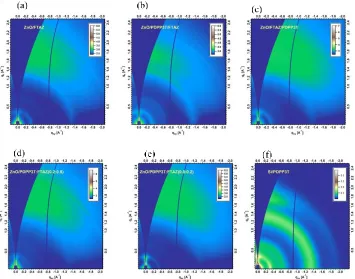
Figure 3.5. 2D GI-WAXS patterns of (a) FTAZ: PC71BM binary, (b) PDPP3T: PC71BM/ FTAZ:PC71BM SeCaT, (c) FTAZ: PC71BM/ PDPP3T: PC71BM SeCaT, (d) PDPP3T: FTAZ (0.2:0.8): PC71BM conventional ternary, (e) PDPP3T: FTAZ (0.8:0.2): PC71BM conventional ternary, and (f) PDPP3T: PC71BM binary films.
100 101 102 103 104 105 106 107 Count (a. u.) 600 500 400 300 200 100 0 Time (s) F CNO ZnO/PDPP3T:FTAZ (0.5:0.5) Polymer:PC71BM (1:2)
100 101 102 103 104 105 106 107 Count (a. u.) 800 600 400 200 0 Time (s)
FTAZ:PC71BM
TernaryPDPP3T:PC71BM Region
Top Surface
F CNO
ZnO/PDPP3T/FTAZ
34
3.3.4 Thermodynamic of the blend
To understand the differences in DSIMS profiles and performance, we used DSC to determine the crystallinity and polymer-polymer interaction parameter (χ). The later provides important information associated with the miscibility of polymer-polymer systems.[46–48] Based on the thermograms in Figure 3.6a, PDPP3T is a semi-crystalline polymer with the melting point (𝑇𝑚0) of about295 °C, which is consistent with previous reports.[49]In contrast, FTAZ has no evidence of a melting transition and is non-crystalline. These results are consistent with the molecular ordering or respective lack thereof found in GI-WAXS. The depression of the melting point temperature (𝑇𝑚) for blended materials, using Flory-Huggins approximation,[50] can be used to
determine the molecular interaction parameter (χ) of the polymers in the presence of a miscible diluent according to[51]
1
𝑇𝑚−
1
𝑇𝑚0
= − 𝑅
𝛥𝐻𝑓
𝑣2
𝑣1𝜒(1 − 𝜙2)2 (3.1)
Where the subscript 1 and 2 identify amorphous and semi-crystalline polymers, respectively;
𝑇𝑚 and 𝑇𝑚0 are the melting point of the mixture and the pure semi-crystalline polymer,
respectively; 𝑅 is the ideal gas constant; 𝑣1 and 𝑣2 are the molar volume of amorphous (𝑣1,𝐹𝑇𝐴𝑍=
903 cm3/mol) and semi-crystalline (𝑣2,𝑃𝐷𝑃𝑃3𝑇 = 721 cm3/mol) polymers; and 𝜙 is the volume
fraction. Utilizing 𝜒 = 𝐵𝑣1⁄𝑅𝑇, which represents the polymer-polymer interaction that is driven by enthalpy, and substitution into equation 1, the data can be represented as shown in Figure 3.6b and χ = -0.56 can be extracted by a linear fit. We note that the excellent fit achieved indicates that
χ has a negligible entropic component or D/A ratio dependence. The critical χ, i.e. χc, above which
phase separation can occur, is generally positive. In the limit of infinite molecule weight, χc = 0.
35 amorphous fractions of the two polymers form a miscible and thermodynamically stable mixture.
χ measurements in the field are rare,[52,53] and this the first time such negative χ has been measured.
It means there is no driving force for a polymer-polymer phase separation and the polymers form an alloy in which the PCBM is phase-separated.
Figure 3.6. (a) The DSC traces (10 °C/min) of the first run of PDPP3T:FTAZ blends, (b)
(1 𝑇⁄ 𝑚− 1 𝑇⁄ 𝑚0)/𝜙1 against 𝜙1⁄𝑇𝑚 for PDPP3T:FTAZ blends, (c) melting point, and (d) melting
enthalpy of PDPP3T in ternary and polymer-polymer blend as a function of volume fraction of FTAZ (𝜙1).
In order to investigate the impact of alloying on charge transport,[54] the space charge limited current (SCLC) method in a diode configuration was used to measure hole mobility (See Figure
(a) 3.0
2.5 2.0 1.5 1.0 Hea t Flow (W /g) 320 300 280 260 240 220 200 180 T (°C)
TM (°C) = 295.6
TM (°C) = 294.4
TM (°C) = 293.6
TM (°C) = 290.7
TM (°C) = 287.8
TM (°C) = 281.2
TM (°C) = N/A
TM (°C) = N/A
PDPP3T:FTAZ (100:0) (85:15) (80:20) (70:30) (60:40) (50:50) (40:60) (0:100) Exo Up (b)
(c) (d) 30
25 20 15 10 5 f (J/ g) 0.5 0.4 0.3 0.2 0.1 0.0 polymer-polymer ternary 90x10-6 80 70 60 50 40 30 (1/T M -1/T M 0)/ (K -1 ) 900x10-6 800 700 600 500 400 300
/Tm (K
36 3.7). For FTAZ concentrations that form an alloy, the mobility is lowered by about a factor of 2. This is consistent with the bilayer diode results that showed that hole hopping is asymmetric, with holes moving more easily from PDPP3T to FTAZ than from FTAZ to PDPP3T.Ideally, the hole from the PDPP3T hops only once along the highest occupied molecular orbital (HOMO) energy cascade (See Figure 3.2) to the FTAZ and a hole from the PCBM hops once or at most twice and then remains within the FTAZ-rich phase until it reaches the electrode. Alas, in an FTAZ:PDPP3T alloy, a hole might be forced to hop back onto the lower energy HOMO of the PDPP3T, hop via a longer distance to the next FTAZ, or explore longer and more tortuous FTAZ pathways. Consequently, a miscible phase, i.e., a polymer alloy, is detrimental here for hole transport. This reduces the performance in the conventional ternary configuration of this system that could have been ideal when only considering the matched optical and electronic properties. We suspect that transport would be even more impacted if the hopping is more asymmetric in other material pairs that have a larger HOMO offset.
0.0 0.2 0.4 0.6 0.8 1.0
1.5x10⁻⁴
2.0x10⁻⁴
2.5x10⁻⁴
3.0x10⁻⁴
3.5x10⁻⁴
4.0x10⁻⁴
Mo
bilit
y
[cm
2 /Vs
]
FTAZ volume fraction ()