Copyright 0 1996 by the Genetics Society of America
Testing Differentiation
in
Diploid Populations
Jerhme Goudet,” Michel Raymond,t9f
Thierry
de Meeiis5 and
Franqois
Roussett
*Institut de Zoologie et dEcologie Animale, Uniwersite‘ de Lausanne, CH-1015 Lausanne, Switzerland, +Znstitut des Sciences de 1 ’Evolution, UMR CNRS 5554, Laboratoire de Ginitique et Enwironnement, 34095 Montpellier cedex 05, France,
fDepartment of Genetics, University of Uppsala, 975007 Uppsala, Sweden and sLaboratoire de Parasitologie Compare‘e, UMR CNRS 5555, Uniwersite‘ de Montpellier ZZ, 34095 Montpellier cedex 05, France
Manuscript received February 8, 1996
Accepted for publication August 28, 1996
ABSTRACT
We examine the power of different exact tests of differentiation for diploid populations. Since there is not necessarily random mating within populations, the appropriate hypothesis to construct exact tests is that of independent sampling of genotypes. There are two categories of tests, Fsrestimator tests and goodness of fit tests. In this latter category, we distinguish “allelic statistics”, which account for the nature of alleles within genotypes, from “genotypic statistics” that do not. We show that the power of Fs+stimator tests and of allelic goodness of fit tests are similar when sampling is balanced, and higher than the power of genotypic goodness of fit tests. When sampling is unbalanced, the most powerful tests are shown to belong to the allelic goodness of fit group.
S
EVERAL procedures have been recently proposed in the literature to test for population differentiation. The development of fast microcomputers and of efficient algorithms has allowed the use of various exact tests (HUD-SON et al. 1992; ROFF and BENTZEN 1992; RAYMOND and
ROUSSET 1995b), which are preferable to traditionally used asymptotic tests, particularly when many infrequent alleles are considered, a situation now common after the recent development of DNA-based polymorphism.
The exact-X2 (HUDSON et al. 1992) or the probability test (WEIR 1990; RAYMOND and ROUSSET 1995b) are based on the hypothesis of random sampling of genes. These tests are therefore appropriate for haploid indi- viduals, where sampling individuals corresponds to the same process as sampling genes. For higher ploidy lev- els, these tests are also valid if genes within individuals are independent. For diploid organisms, this condition
is equivalent to random mating at least during the latest generation, in each population. When this assumption is not valid, exact tests of population differentiation should be based on the hypothesis of independent sam- pling of genotypes. Here we present several exact tests assuming random sampling of diploid genotypes. Possi- ble nonindependence of genes within individuals is therefore taken into account and could not affect their validity. Power comparison of these tests has been car- ried out to evaluate their performance in presence of distinct alternative hypotheses.
DEFINITION OF TESTS
Exact sampling distribution: Under the null hypoth- esis of absence of population differentiation, the condi-
Corresponding author: J&rBme Goudet, Institut de Zoologie e t D’Eco-
logie Anirnale, Bitiment de Biologie, Universite de Lausanne, CH- 1015 Lausanne, Switzerland. E-mail: [email protected]
Genetics 144: 1933-1940 (December, 1996)
tional probability of the observed sample given the mar- ginal counts is
where Ne is the number of individuals of genotype j in population i, Ni, is the sample size of population i, N.j
is the total number of individuals with genotype j , N..
the total number of individuals sampled, T the number
of samples and NE the number of genotypes (an exam- ple is given in Table 1A). Exact tests are constructed by ranking all possible tables given the marginal counts according to the value of a particular statistic, and sum- ming up the probabilities (as defined in Equation 1)
of the tables with more extreme ranks. The resulting sum is the Pvalue of the test.
Different classes of statistics to rank the tables will be considered here. A practical distinction is between estimators of F Y T and “goodness of fit” statistics such
as the X 2 , likelihood ratio, or (by a slight abuse of lan- guage) the sample probability Pr (S)
.
A more important distinction is between statistics computed from allele counts (“allelic statistics”, Table 1B) or from genotype counts (“genotypic statistics”, Table 1A). For example, an exact-X2 can be an allelic or genotypic goodness offit statistic whether it is computed on allele or genotype counts. In both cases however, the distribution of the statistics under the null hypothesis is obtained using the sampling distribution under random sampling of genotypes, not of genes ( i e . , of Table lA, not Table
1934 J. Goudet et al.
TABLE 1
Layout for the two types of contingency tables described in text
11 12 13 22 23 33 All
B
1 nI I nlz 1213 nl.
2 3 All
%I
n"'
n 3 3 n 2 .n31
n. 1 n.3 n.2 n.
n32 n33 n3
A. Layout of a R X C genotypic table. Sample made of three subsamples (rows). In this example, three alleles (six genotypes) were found at the locus analyzed. B. Layout of a R X C genic (or allelic) table derived from the genotypic one.
respect the usual estimators of FsT are allelic statistics since they take into account the nature of alleles within genotypes.
FsT estimators: The parameter traditionally used to measure population differentiation is FSl, (WRIGHT 1951; COCKERHAM and WEIR 1987). Several estimators of F S T were used to construct a rejection zone.
8,.
This is the estimator ofFST, defined by WEIR and COCKERHAM (1984) aswhere k is the number of alleles at the locus, and a,, b, and cu are the among samples, among individuals within samples and within individual estimates of components of variance, respectively, of a nested analysis of variance on allele frequencies (COCK-
ERHAM 1969,1973; WEIR and COCKERHAM 1984). The
P value of the exact awctest is computed as Pgw, =
Cg,(s,)+,c(s) Pr(s,), where the summation is over all possible contingency tables si with a larger
8,;
than the observed.8,.
This is an "unweighted" estimator ofFS7., defined by WEIR and COCKERHAM (1984) asThe P value of the exact Bzrtest is computed as Pe,,
8,.
This statistic is another estimate of F S T (ROBERT- SON and HILL 1984). An explicit formula is found in WEIR and COCKERHAM (1984):= & d s , ) r ~ , i ~ ) Pr(si).
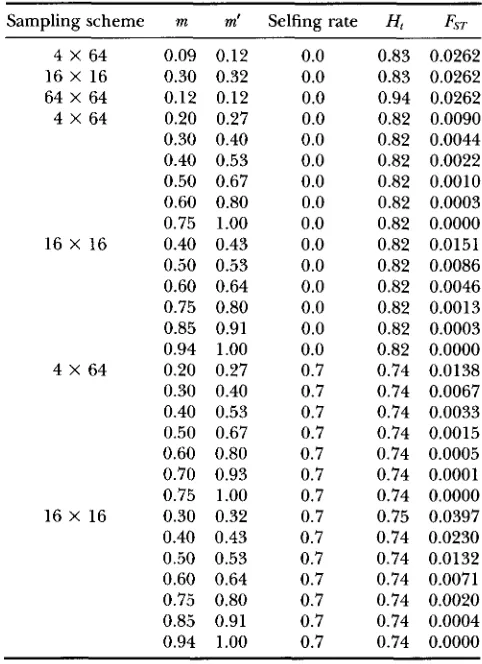
TABLE 2
Parameters values of the different alternative hypotheses
Sampling scheme m m' Selfing rate H, Fs,
4 X 64 16 X 16 64 X 64 4 X 64
16 X 16
4 X 64
16 X 16
0.09 0.12 0.30 0.32 0.12 0.12 0.20 0.27 0.30 0.40 0.40 0.53 0.50 0.67 0.60 0.80 0.75 1.00 0.40 0.43 0.50 0.53 0.60 0.64 0.75 0.80 0.85 0.91 0.94 1.00 0.20 0.27 0.30 0.40 0.40 0.53 0.50 0.67 0.60 0.80 0.70 0.93 0.75 1.00 0.30 0.32 0.40 0.43 0.50 0.53 0.60 0.64 0.75 0.80 0.85 0.91 0.94 1.00
0.0 0.0 0.0 0.0 0.0 0.0 0.0 0.0 0.0 0.0 0.0 0.0 0.0 0.0 0.0 0.7 0.7 0.7 0.7 0.7 0.7 0.7 0.7 0.7 0.7 0.7 0.7 0.7 0.7
0.83 0.0262 0.83 0.0262 0.94 0.0262 0.82 0.0090 0.82 0.0044 0.82 0.0022 0.82 0.0010 0.82 0.0003 0.82 0.0000 0.82 0.0151 0.82 0.0086 0.82 0.0046 0.82 0.0013 0.82 0.0003 0.82 0.0000 0.74 0.0138 0.74 0.0067 0.74 0.0033 0.74 0.0015 0.74 0.0005 0.74 0.0001 0.74 0.0000 0.75 0.0397 0.74 0.0230 0.74 0.0132 0.74 0.0071 0.74 0.0020 0.74 0.0004 0.74 0.0000
m, migration rate; m', migration rate corrected for the num- ber of populations [m' = D m / ( D I ) ] ; H t , expected value of the genetic diversity, F y T , expected value of the parameter Fyr.
where
p,
is the observed frequency of allele u. TheP value of the exact eRKtest is computed as Pa, =
&&",)&(S) W s t ) *
Genotypic goodness of fit statistics: Three statistics have been used in this category.
X 2 . The
X
'
is the well-known chi-square, i.e.,where = N J N , , . The proportion of tables with a higher or equal X 2 , P 2 = Pr(sj), is the P
value of an exact genotypic-X2 test.
G. The Gvalue is the traditional log likelihood ratio
(SON and ROHLF, 1981):
Tests of Differentiation 1935
TABLE 3
Power of the different exact tests described in the text
Goodness of fit tests
FST estimator tests Genotypic tests Allelic tests
Sampling scheme FST
8,
8,
8
wc Prx2
G Pra Ga4 X 64 0.0262 999 999 990 965 966 965 999 999
0.0090 875 873 731 484 489 497 872 873
0.0044 535 531 392 226 227 227 521 523
0.0022 250 244 172 109 114 111 243 232
0.0010 136 130 109 71 85 75 129 129
0.0003 64 67 61 66 64 66 65 65
16 X 16 0.0262 994 994 980 782 798 792 994 994
0.0151 908 913 799 413 429 422 904 899
0.0086 610 606 47 1 241 268 248 578 577
0.0046 287 291 242 137 137 139 260 269
0.0013 95 97 97 74 87 76 89 95
0.0003 55 55 62 81 73 70 67 70
4 X 64 stands for four populations of 64 individuals. 16 X 16 stands for 16 populations of 16 individuals. Numbers shown are the number of replicates (out of 1000) that gave significant ( P 5 0.05) results. Bold
characters indicate the highest observed power for a given alternative hypothesis. All alternative hypotheses are generated with random mating within demes.
Probability. The probability Pr of the observed Sam- tion. The definitions are the same as above with the ple (Equation 1) can be used to define the rejection interpretation that n9 is the count of allele J' in sample
zone. This procedure gives a test generally known as i, and ng the number of distinct alleles: the Fisher exact test on contingency table or Probabil-
ity test. The latter designation will be used here. The
Pvalue is computed as Pp, =
Cp,(,,),p,(s)
Pr(sj). n..!n:=]
n72, n,!.
Allelic goodness of fit statistics: The same goodness Test computation: The computation of each exact
of fit statistics can be computed on the genic tables test requires the evaluation of all tables given the mar- derived from the genotypic ones (that is, under the ginal values, which is practically impossible for most hypothesis of independent sampling of genotypes): the cases (GAIL and MANTEL 1977). Instead of computing
x,
the G, value, and the probability Pr, of the genic this exact probability, an unbiased estimate can be ob- table under the null hypothesis of nongenic differentia- tained using an appropriate sampling procedure undernL1 n1,!
n;z,
n,!Pr(S) =
(2)
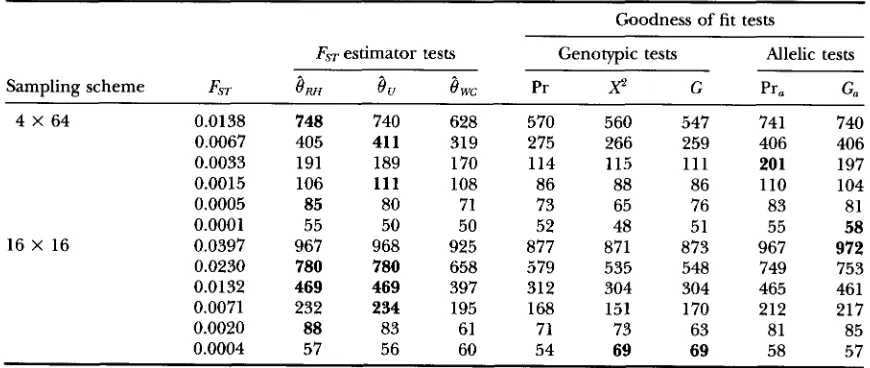
TABLE 4
As Table 3 but alternative hypotheses generated with 70% selfing
Goodness of fit tests
FsT estimator tests Genotypic tests Allelic tests
Sampling scheme FST
e,
8"
8
wc Prx2
G Pr, Go~
4 X 64 0.0138 748 740 628 570 560 547 741 740
0.0067 405 41 1 319 275 266 259 406 406
0.0033 191 189 170 114 115 111 20 1 197
0.0015 106 111 108 86 88 86 110 104
0.0005 85 80 71 73 65 76 83 81
0.0001 55 50 50 52 48 51 55 58
16 X 16 0.0397 967 968 925 877 871 873 967 972
0.0230 780 780 658 579 535 548 749 753
0.0132 469 469 397 312 304 304 465 461 0.0071 232 234 195 168 151 170 212 217
0.0020 88 83 61 71 73 63 81 85
0.0004 57 56 60 54 69 69 58 57
1936 J. Goudet et al.
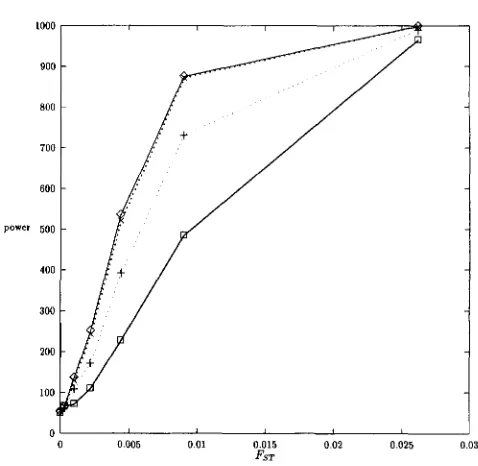
0 ' I
O 0.005 0.01 0.015 0.02 0 025 0.03 FST
FIGURE 1.-Power of different tests as a function of alterna- tive hypotheses. Population-sampled made of 16 demes of 16 individuals. No selfing. 0 , OM-test;
+,
B,-test; 0, Pr-test; X,Prgest.
the null hypothesis. We used either a permutation- based method such as the one developed by HUDSON
et al. (1992) or the Markov chain method developed by RAYMOND and ROUSSET (1995b) (see also Guo and THOMPSON, 1992). All programs were tested by hand computation or by comparison with each other on vari- ous datasets. Type I error was fixed at 5%, as is usually done in biological studies.
Generating alternative hypotheses: Our simulations assume that all alleles are different at initial time, and, to generate the alternative hypotheses, follow the prog- ress of inbreeding with time in a neutral finite island model of population. Asymptotic values of fixation indi- ces and of heterozygosity are known in this model. The validity of simulations were checked by comparing the observed values to their theoretical expectations. One thousand independent loci (replicates) were generated for each alternative hypothesis. The set of parameters we used is described in Table 2.
The simulations were run for a sufficient number of generations to insure that equilibrium between drift and migration has been reached. For each set of param- eters we checked that asymptotic equilibrium was at- tained. Since we are interested in finding tests with high power, we focused our attention on high migration rates (small
FYI).
For most of our results, the entire population was sampled without replacement, therefore only the effect of the genetic sampling is observed. However, the effect of the statistical sampling may be much larger than that of the genetic sampling. For this reason, we simulated 64 populations made of 64 individuals, from which we
power
I 0 0.005 0 01 0.015 0 02 0.025 0.03
FST
FIGURE 2 . - h in Figure 1. Population sampled made of four demes of 64 individuals. No selfing. 0 , @"test;
+,
Bwc-test; 0 , Pr-test; X, Pratest.sampled 16 individuals in 16 populations. These simula- tions were run for a large number of generations, much larger than the time necessary to reach equilibrium, and samples where taken every 500 generations until the 3000th generation to look at the effect of global genetic diversity on the power of the different tests. We also took a series of unbalanced samples from our populations, since the behavior of our tests may differ between balanced and unbalanced sampling. Pseudo- random numbers were generated according to MARSAG
LIA et al. (1990) for the Markov Chain algorithm and
according to L'ECUYER (1988) for the randomization algorithm.
RESULTS
In all cases, the power of the X', and BRKtest were the same, so the power is not shown in the tables. Results when the null hypotheses were true always gave power very close to 5% as expected and are therefore not shown either.
Exhaustive sampling, balanced samples: Results are shown in Tables 3 and 4 and Figures 1 and 2. In all cases, genotypic goodness of fit tests are less powerful than allelic tests that use the additional information of the identity of the alleles within genotypes. For each alternative hypothesis, the different allelic tests have similar power. The main exception is when
8,
is used to define the rejection zone, which lead to a decrease in power in most conditions (Tables 3 and 4 and Figures 1 and 2).Tests of Differentiation 1937
TABLE 5
Power of goodness of fit statistics under sampling of genotypes or alleles
Allelic tests
On On
genotypic genic
tables tables
Sampling scheme F,, Pr, G, Pr, C,
16 X 16 0.0151 904 899 906 905
0.0086 578 577 593 599
0.0013 89 95 98 103
Random mating within populations is assumed. Bold char- acters indicate the highest observed power for a given alterna- tive hypothesis.
als from fewer populations than the reverse, at least when the alternative hypothesis is close to the null (ie., F Y T is small, Tables 3 and
4).
When there is random mating within populations, genes within individuals are independent. We may then compare the power of tests based on the probability distribution of alleles (which are obtained from consid- ering the tables with the same marginal counts as the allelic table, Table 1B) and that of genotypes. Table 5 shows that the loss of power of the latter is small.
Partial sampling, balanced samples: Results are shown in Table 6. Ranking of the different tests is similar to what we obtain under exhaustive sampling. As the number of generations increases, genetic diversity decreases, so
does the power of the tests (Table 6).
Unbalanced samples: A discrepancy appears when samples are unbalanced between the probability test
(Pr,) or the Gtest (
Ga),
which performed better than the &tests. G, seems overall slightly more powerful than Pr, (Table7).
Among the FsTtests,8,
and8,
performed equally well, with a tendency for the former to do slightly better when samples are balanced, andTABLE 7
Effect of unequal sampling on the power of different exact tests
Tests power
FSl
8,
8"
8,
Pro G.A
0.0090 353 366 325 479 496
0.0044 165 169 159 237 236
B
0.0138 244 268 270 372 364
0.0067 146 145 151 189 196
C
0.0262 880 883 822 914 917
0.0086 320 324 272 341 35 1
D
0.0397 758 774 706 788 804
0.0132 243 255 210 250 25 1
Partial sampling was carried out on four populations of 64 individuals (two samples of five individuals, two of 64, A no selfing; B: 70% selfing) and on 16 populations of 16 individu- als (six samples of five individuals, five of 10, six of 16, C: no selfing and D: selfing). Bold characters indicate the highest observed power for a given alternative hypothesis.
slightly worse when the samples are unbalanced (Tables
6 and 7).
The effect of selfing and nonrandom mating When there is departure from random mating, the power of
the tests drops (Tables 3 and 4).
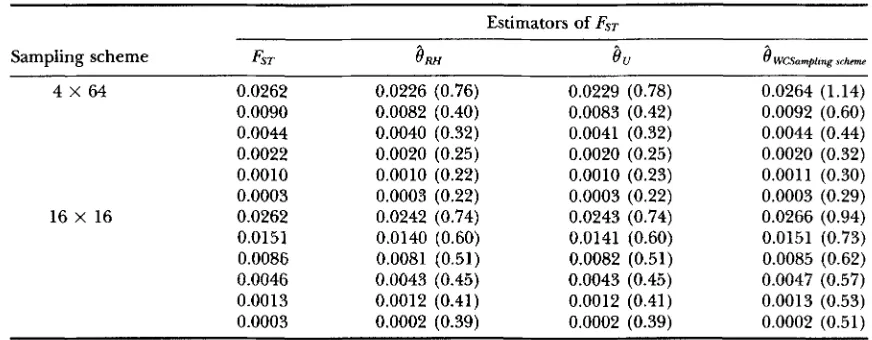
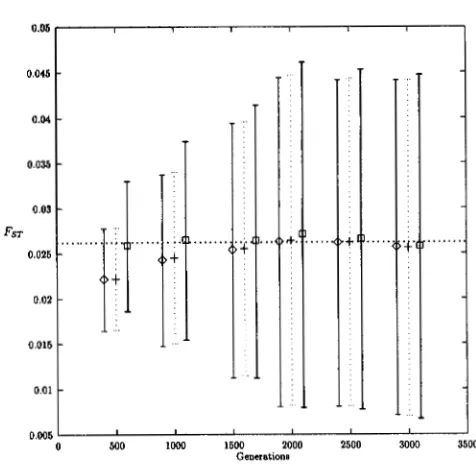
Relationships to estimation:
8,
provides the least biased estimator of FST for all sampling strategies, but has the largest variance when genetic diversity is high (Tables 8-10). As genetic diversity decreases, the vari- ance of the three estimators increases (Figure 3). Note- worthy is the effect of unbalanced sampling on the vari- ance of8,
and8,:
while0
,
has always a lower variance when all samples are of equal sizes (Tables 8 and 9 ) ,8,
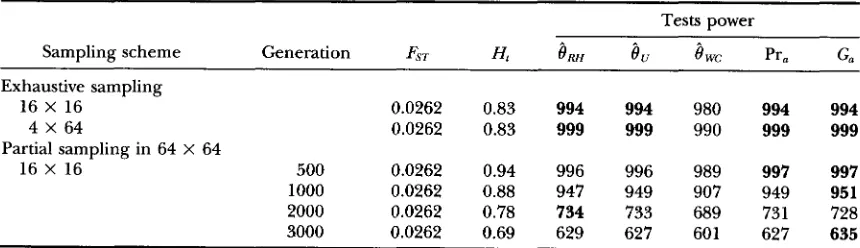
has a lower variance when sample sizes are unequal (Table 10).TABLE 6
Effects of the sampling scheme and of genetic diversity on the power of different exact tests
Tests power
Sampling scheme Generation FST H,
8,
8,
8,
Pr, G,~~ ~~
Exhaustive sampling
16 X 16 0.0262 0.83 994 994 980 994 994
4 X 64 0.0262 0.83 999 999 990 999 999
16 X 16 500 0.0262 0.94 996 996 989 997 997
1000 0.0262 0.88 947 949 907 949 951
2000 0.0262 0.78 734 733 689 731 728
3000 0.0262 0.69 629 627 601 627 635
Partial sampling was carried out on 64 populations made of 64 individuals. H, expected heterozygosity. Partial sampling in 64 X 64
1938 J. Goudet et al.
TABU 8
Mean of the three estimators of F-with no s e m g
Estimators of FST
Sampling scheme FST
8,
8,
e
WC.Samplrng x h m4 X 64 0.0262 0.0226 (0.76) 0.0229 (0.78) 0.0264 (1.14)
0.0044 0.0040 (0.32) 0.0041 (0.32) 0.0044 (0.44)
0.0090 0.0082 (0.40) 0.0083 (0.42) 0.0092 (0.60)
0.0022 0.0020 (0.25) 0.0020 (0.25) 0.0020 (0.32)
0.0010 0.0010 (0.22) 0.0010 (0.23) 0.001 1 (0.30)
0.0003 0.0003 (0.22) 0.0003 (0.22) 0.0003 (0.29)
0.0262 0.0242 (0.74) 0.0243 (0.74) 0.0266 (0.94)
0.0151 0.0140 (0.60) 0.0141 (0.60) 0.0151 (0.73)
0.0086 0.0081 (0.51) 0.0082 (0.51) 0.0085 (0.62)
0.0046 0.0043 (0.45) 0.0043 (0.45) 0.0047 (0.57)
0.00 13 0.0012 (0.41) 0.0012 (0.41) 0.0013 (0.53)
0.0003 0.0002 (0.39) 0.0002 (0.39) 0.0002 (0.51)
16 X 16
SD X 100 in parentheses.
DISCUSSION
Overall, the most powerful tests are the allelic proba- bility and the allelic G, carried out on the genotypic tables (respectively Pr,-test and Ga-test)
.
These conclu- sions stand for all sampling schemes. While power is similar between these two tests and the &-tests for bal- anced sampling (e.g., Table 6), the loss of power when samples are unbalanced is larger in Fsrtests than in the Pra-test and the G,-test (Table7).
For example, for an alternative hypothesis defined by FST = 0.009, we find no significant differences in power between the Fsrtests and the Pr, or G, tests (Table 3), but the latter are at least 13% more powerful than FSrtests when samples are unbalanced (Table7 ) .
Sampling
strategies: Power is much higher whensamples are balanced than when they are not. We also find that when gene flow is high, it seems better to sample few populations with many individuals rather
than more populations with less individuals. This may be because one gets a better estimation of local allele frequencies, thereby increasing the ability of the test to reject smaller allele frequency differences. When sam- ples are balanced, most exact tests that use the identity of alleles information perform equally well.
Among the tests based on F y T estimators, gWc, while
being the least biased estimator, is also the least power- ful.
0
,
and8,
perform equally well, with the former doing slightly better under balanced sampling and slightly worse under unbalanced sampling.Relationships to estimation: The different weightings given to alleles have an influence on the statistical out- come. Giving more weight to rare alleles provides estima- tors with lower variance under the null hypothesis and therefore more powerful test statistics. This finding stands for FST (ROBERTSON and HILL 1984; WEIR and COCKERHAM 1984; LONG 1986) and related quantities
TABLE 9
As Table 8 but with 70% selfing
Estimators of Fs7
Sampling scheme FST
8,
8,
e ,
4 X 64 0.0138 0.0125 (0.82) 0.0127 (0.85) 0.0142 (1.13)
0.0067 0.0062 (0.61) 0.0063 (0.63) 0.0069 (0.82)
0.0033 0.0031 (0.50) 0.0031 (0.52) 0.0035 (0.68)
0.0015 0.0013 (0.46) 0.0013 (0.47) 0.0016 (0.64)
0.0005 0.0006 (0.43) 0.0006 (0.44) 0.0006 (0.56)
16 X 16 0.0397 0.0366 (1.41) 0.0372 (1.41) 0.0400 (1.67)
0.0230 0.0211 (1.18) 0.0214 (1.19) 0.0232 (1.44)
0.0132 0.0124 (0.94) 0.0127 (0.96) 0.0139 (1.22)
0.0071 0.0065 (0.83) 0.0067 (0.85) 0.0075 (1.08)
0.0004 0.0004 (0.73) 0.0004 (0.74) 0.0004 (0.96)
0.0001 0.0002 (0.40) 0.0002 (0.41) 0.0002 (0.53)
0.0020 0.0018 (0.77) 0.0018 (0.78) 0.0018 (0.96)
Tests of Differentiation 1939
TABLE 10
As Table 8 but with unequal sample sizes
Estimators of FsT
4,.
,
8
8"
8
wcA
0.0090 0.0085 f0.88) 0.0085 (0.87) 0.0090 (1.05) 0.0044 0.0042 (0.75) 0.0042 (0.72) 0.0044 (0.78)
B
0.0138 0.0123 (1.61) 0.0125 (1.56) 0.0138 (1.83) 0.0067 0.0062 (1.48) 0.0062 (1.43) 0.0066 (1.56)
C 0.0262 0.0238 (1.05) 0.0240 (1.04) 0.0262 (1.27)
0.0086 0.0080 (0.77) 0.0081 (0.76) 0.0087 (0.94)
D
0.0397 0.0362 (1.61) 0.0368 (1.56) 0.0405 (1.83)
0.0132 0.0120 (1.48) 0.0123 (1.43) 0.0137 (1.56)
A, B, C, D as in Table 7. SD X 100 in parentheses.
(BARTON and SLATKIN 1986; SLATKIN and BARTON 1989) as well as for FIs (ROBERTSON and HILL 1984; ROUSSET and RAYMOND 1995).
The weighting given to the different samples for the F,+stimators was proportional to their size. This is the weighting advocated by WEIR and COCKERHAM (1984). HUDSON et al. (1992) used an equivalent weighting. Nev- ertheless, this weighting scheme for sample sizes may not be the best for the present testing purposes.
NEI
and CHESSER (1983) suggested to weight equally all sam- ples, on the ground that population size is usually un- known and may not be reflected in sample sizes. This point needs further investigations.
Genetic diversity: The levels of genetic diversity pres- ent in our simulated populations are closer to what is expected from molecular markers such as microsatel- lites than from isozymes (Tables
2
and 6). However, mutation was not considered in this investigation. Par- ticular mutation processes could generate allele fre- quency distributions different from the one generated by drift/migration alone and could affect the power of the different tests.Conclusions: The tests presented here are single lo- cus, multi-allelic tests. Fsr and goodness of fit tests are easily generalized to multi-locus data if these can be considered independent.
For diploid sexual organisms, exact tests of subdivi- sion should be based on the hypothesis of independent sampling of genotypes when the random sampling of alleles is inappropriate (alleles within individuals are not independent when there is nonrandom mating). Even when there is random mating, the power of allelic test based on genotypic tables is similar to that of tests based on genic tables when there is random mating. However, when samples are small compared to the level of variability (such that most sampled individuals have
. I t ...
< > - I
... c ...
.1
0.005 I I
0 500 1 w O 1500 2000 2500 3000 3500 Generations
FIGURE H.-ObseIved yalues of the three FST estimators ?
1 SD. 0 ,
OM;
+, 8,; 0 ,
Owe;. . .
, expected value of FsT.a unique genotype), allelic test on genic tables could be more powerful.
Tests ignoring the identity of alleles (genotypic good- ness of fit statistics) are less powerful than tests acknowl- edging it. While a test more powerful than those de- scribed here could be found, it should emerge from the allelic statistics class rather than the genotypic one.
This work was financed in part by grant 3143443.95 of the Swiss National Science Foundation U.G.), by PICS 290 of Centre National
de la Recherche Scientifique (T.D.) and GDR1105 (Programme Envi-
ronnement, Vie et SociCte du CNRS). This is contribution 96139 of the Institut des Sciences de I'Evolution (URA CNRS 327). M.R thanks P. PAMILO for the opportunity to spend a year at the department of Genetics, Uppsala University, Sweden. The G,-test will be included
in future releases of the computer programs FSTAT (GOUDET 1995)
and Genepop (RAYMOND and ROUSSET 1995a).
LITERATURE CITED
BARTON, N. H., and M. SLATKIN, 1986 A quasi equilibrium theory
of the distribution of rare alleles in a subdivided population. Heredity 5 6 409-415.
C O C K E ~ , C. C., 1969 Variance of gene frequencies. Evolution
2 3 72-84.
COCKERHAM, C. C., 1973 Analysis of gene frequencies. Genetics 7 4
679-700.
COCKERHAM, C. C., and B. S. WEIR, 1987 Correlations, descent mea- sures: drift with migration and mutation. Proc. Natl. Acad. Sci.
COCKERHAM, C. C., and B. S. WEIR, 1993 Estimation of gene flow from F-statistics. Evolution 47: 855-863.
GAIL, M., and N. MANTEL 1977 Counting the number of contin-
gency tables with fixed margins. J. Am. Stat. Assoc. 7 2 859-862. GOUDET, J., 1995 FstatVersion 1.2. A computer program to calculate
F-statistics. J. Hered. 86: 485-486.
Guo, S. W., and E. A. THOMPSON, 1992 Performing the exact test of Hardy-Weinberg proportions for multiple alleles. Biometrics
HUDSON, R. R., D. D. Boos and N. L. KAPLAN, 1992 A statistical test for detecting geographic subdivision. Mol. Biol. Evol. 9 138-
151.
USA &I: 8512-8514.
1940 J. Goudet et al.
L'ECUYER, P., 1988 Efficient and portable random number genera-
tors. Comm. ACM 31: 147-157.
LONG, J. C., 1986 The allelic correlation of the Gainj and Kalam speaking people. I. The estimation of and interpretation of WRIGHT'S F-statistics. Genetics 112: 629-647.
" X I A , G., A. ZAMAN and W. W. TSANG, 1990 Toward a univer- sal random number generator. Stat. Prob. Lett. 8: 35-39.
NEI, M., and R. K CHESSER, 1983 Estimation of fixation indices and gene diversities. Am. J. Hum. Genet. 47: 253-259.
RAYMOND, M., and F. ROUSSET, 1995a GENEPOP (version 1.2): a p o p ulation genetics software for exact test and ecumenicism. J. Hered. 86: 248-249.
RAYMOND, M., and F. ROUSSET, 1995b An exact test of population differentiation. Evolution 4 9 1280-1283.
ROBERTSON A., and W. G. HILL, 1984 Deviations from Hardy-Wein-
berg proportions: sampling variances and use in estimation of inbreeding coefficients. Genetics 107: 703-718.
Row, D. A., and P. BENTZEN, 1992 Detecting geographical subdivi- sion: a comment on a paper by HUDSON et al. Mol. Biol. Evol.
9: 968.
ROUSSET, F., and M. RAYMOND, 1995 Testing heterozygote excess and deficiency. Genetics 1 4 0 1413-1419.
SIATKIN, M., and N. H. BARTON, 1989 A comparison of three indi- rect methods for estimating levels of gene flow. Evolution 4 3
S o w , R. R., and F. J. ROHLF, 1981 B i o m t ~ , Ed. 2. Freeman and
WEIR, B. S., 1990 Genetic data analysis. Sinauer, Sunderland, M A . WEIR, B. S., and C. C. COCKERHAM, 1984 Estimating F-statistics for
the analysis of population structure. Evolution 38: 1358-1370.
WRIGHT, S., 1951 The genetical structure of populations. Ann. Eu-
genics 1 5 323-354. 1349-1368.
Co., New York.