Subjective Speech Evaluation on Mobile
Communication Networks
Osahenvemwen, O.A.
Senior Lecturer, Department of Electrical and Electronic, Faculty of Engineering and Technology, Ambrose Alli University, Ekpoma, Nigeria.
ABSTRACT: This study presents subjective speech evaluation on mobile communication networks, to determine
speech quality level on mobile networks in Nigeria. The speech evaluation was based on subjective measurement methods using Mean Opinion Score (MOS). The subjective method was carried out in a quiet place at various times, with recommended sentences at different period respectively, five TECNO mobile equipments, with model number TECNO N3 and Andriod Version 2.3.5 were used, for a period of three Months. In addition, Network A, Network B and Network C, were considered in mobile communication networks in Nigeria. The male and female speech quality were examine from three different mobile networks, also comparison analysis were carried out from various networks to determine their speech quality, using various statistical tools such as Root Mean Square Error (RMSE) and Correlation Coefficient. In addition, various causes of drop calls and low (poor) speech quality levels were highlighted. It is observed that the total average RMSE value from the male speech quality obtained from the three networks considered is 0.601, while Correlation Coefficient value obtained between male and female speech quality were in variance. Also, Network A has higher (better) speech quality than Network B and Network C. In addition, speech distortions have lead to high number of drop calls in mobile communication networks in Nigeria.
KEYWORDS: Mean Opinion Score (MOS), Quality of Service (QoS), Speech quality, Subjective measurement.
1. INTRODUCTION
The rapid growth of mobile networks in recent years has produced overwhelm output in terms of technological advancement, employment etc. The mobile communication network is a major factor that drives economical advancement, infrastructures development of any developing country. Recent time, there have being various competition between mobile communication operators over the number of subscribers they possess. Based on the quality of service, subscribers are wooed to use a particular network over the other. Therefore, the optimization of mobile communication network is very imperative to obtained high quality of service. Also, subscribers have witnessed low quality of service, expressed as speech distortion. Subscribers were forced to terminate their calls due to speech distortion hereby increasing the number of drop calls occurrences and subscribers decided to redial the calling party in attend to obtained good quality of speech. Subscribers were always dissatisfied with the speech (digital audio) quality produced through speaker telephones, earphones and mobile phones etc. Speech signals transmitted through telecommunication systems suffer from significant call quality degradation caused by channel noise, interferences, echo, codec used, speech level, noise level and bit error ratio. These impairments have become a major setback in mobile communication system [1][2].
without restriction. The normal human speech level fall between 55 dB and 65 dB (measured at a distance of 1meter from the speaker). In specific situations, levels may reach as high as 90 dB when shouting a warning, or as low as 30 dB when whispering softly. The women cannot raise their voice above 75 dB whilst 15% of shouting men can easily exceeding 96 dB, sometimes reaching as high as104 dB [3][4][5][6].
Measurement of Voice Quality in Mobile Communication Networks
There are two broad classes of speech quality measurement methods; they are subjective and objective quality estimation procedures. The subjective measurement involve testing, where human subjects are required to perform listening to alive or recorded conversation and assigning a rating to it. The ratings are dependent on each individual user perception. A mean of all the recorded results are averaged to get the overall quality estimate of the speech quality under test [7][8]. However, the objective method is computer algorithms, designed to estimate quality degradation in the signal through automated computer processes. Speech quality is a complex psycho acoustic phenomenon within the process of human perception. From research, it observed that the subjective was subject to variation due to different people interpret speech quality differently. However, the objective measures are widely used since they have several critical advantages over the subjective measures method [9].
The most important KPI speech quality assessment is indeed the Mean Opinion Score (MOS), defined as the arithmetic mean of subjective evaluations in listening or conversational tests, which range from 1 (bad) to 5 (excellent) in Table 1.
TABLE 1: The MOS comparison values SOURCES: [6]
The MOS is affected by many factors, such as the background noise, mute suppression, low rate coder, frame error rate, echo, Mobile Terminal (MT) or Mobile Station (MS). The frame error rate pertains to the handling strategy (handling of frame loss during signaling transmission), frame stealing, bit error, handover, and number of online subscribers (congestion degree) [10]. Also, MOS values measurement can be carried out in a test laboratory environment. MOS values are obtained from the subjective voice quality perceived from a group of listeners participating in the test. It is worth noticing that subjective means is time consuming time to perform and subject to low reproducibility. The objectives methods, used for measuring voice quality in mobile communication networks largely use drive test tools based on the Perceptual; Evaluation of Speech Quality (PESQ) algorithms, which is an objectives method for assessing end-to-end speech quality developed by the International Telecommunication Union (ITU). Another common method is based on Ericsson’s Speech Quality Index (SQI), which estimates how codec type and radio link parameters such as Bit-Error Rate (BER), Frame-Erasure Rate (FER), Discontinuous Transmission (DTX), and handover rates affect voice quality [11].
Impact of Discontinuous Transmission (DTX) and Codec in the Speech Quality
The Discontinuous Transmission (DTX) is associated with a radio network; comfort noise and Voice Activity Detection (VAD). The Voice Activity Detection cannot be totally be exact due to background noise and system noise leads to the clipping of speech signals, result to loss of speech frames and speech distortion. Also, Compressor and Decompressor (codec) systems and Digital Signal Processing (DSP) are used in mobile communication networks, and for the purpose of conservation of bandwidth. But there is a trade-off between voice quality and bandwidth conservation [11]. The best codecs provide the most bandwidth conservation while producing the least degradation of voice quality. Bandwidth can be measured quantitatively, but voice quality requires human interpretation, although estimates of voice quality can be made by automatic test systems. GSM has used a variety of voice codecs to squeeze 3.1 kHz audio within 6.5 kbits and 13 kbit/s. Originally, two codecs, called Half Rate (6.5 kbit/s) and Full Rate (13 kbit/s). The GSM system was enhanced with the Enhanced Full Rate (EFR) codec, a 12.2 kbit/s codec. Finally,
S/N Quality of the speech Score MOS indicators MOS comparison values
1 Excellent 5 Very satisfied 4.3- 50
2 Good 4 satisfied 4.0- 4,3
3 Fair 3 Some user satisfied 3.6-4.0
4 Poor 2 Many user dissatisfied 2.6-3.6
with the development of UMTS, EFR was re-factored into a variable-rate codec called Adaptive Multi-Rate (AMR) Narrowband, which is of high quality and robust against interference when used on full-rate channels, or less robust but still relatively high quality when used in good radio conditions on half-rate channel. The Adaptive Multi-Rate (AMR) audio codec is an audio compression format optimized for speech coding. AMR speech codec consists of a multi-rate narrowband speech codec that encodes narrowband (200–3400 Hz) signals at variable bit rates ranging from 4.75 to12.2 kbit/s with toll quality speech starting at 7.4 kbit/s[12,13] [6][11]
Related Works
Today, the primary constrain in wireless communication system is limitation of bandwidth which also affect the quality of service of speech in mobile communication networks by Bhatt and Kosta, 2011. Also, due to the important of speech evaluation, different techniques and method were considered. The objective method was deployed by Fajkus et al, 2014. But Miroslav and Jan, investigate a correlation between the speech quality in GSM using Perceptual Evaluation of Speech Quality (PESQ) which is the objective method and meteorological data such as temperature, humidity, a dew point, rain, wind speed and an atmospheric pressure. The subjective method was not considered by those researchers because of the drawback associated with experimental procedures. Barile et al, considered the subjective method but values were obtain from the Operation and Maintenance Centre (OMC), not from listener audience which give exact condition of the mobile communication networks. This subjective method was considered in this research work, for mobile communication networks in Nigeria [7][8][10][13][12].
II. METHODOLOGY
This study is on subjective speech evaluation on mobile communication networks, to determine speech quality levels in mobile networks in Nigeria. The speech evaluation is based on subjective measurement method, using Mean Opinion Score (MOS), was carried out in three months period, at a quiet place at various times and different period using the recommended sentences has recommended by ITU-T standard. The recommended sentences are has followed; you will have to be very quiet, There was nothing to be seen, they worshipped wooden idols, I want a minute with the inspector and did he need any money. Male and female speech voices were used in this analysis for period of three months. Five TECNO mobile equipments, with model number TECNO N3, and Andriod Version 2.3.5, were used, also three mobile communication networks were considered in Nigeria, which were represented as network A with network type HSPA *144 Mbps, cell ID 33412, average strength of -83dBm, network B with network type HSPA *144 Mbps, cell ID 1538, average strength of 101dBm and network C with network type HSPA *144 Mbps, cell ID 6674, average strength of -75dBm in this study. The causes of drop calls from three different subscribers in network A for one month period were considered. The Root Mean Square Error (RMSE) and Correlation Coefficient were used to evaluate the speech quality on mobile communication networks and the relationship between male and female speech quality.
III. DATA PRESENTATION
Three different mobile network operators in Nigeria were considered in this investigation. Firstly, the accumulative causes of drop calls were presented in Table 2.
Table 2: Drop calls from Network A from three subscribers in one month
S/N Courses of drop calls Average Occurrence
1 Forceful termination due to speech distortion 56
2 Insufficient credit 32
3 Electromagnetic causes 21
3 Battery outage 10
4 Handover process 5
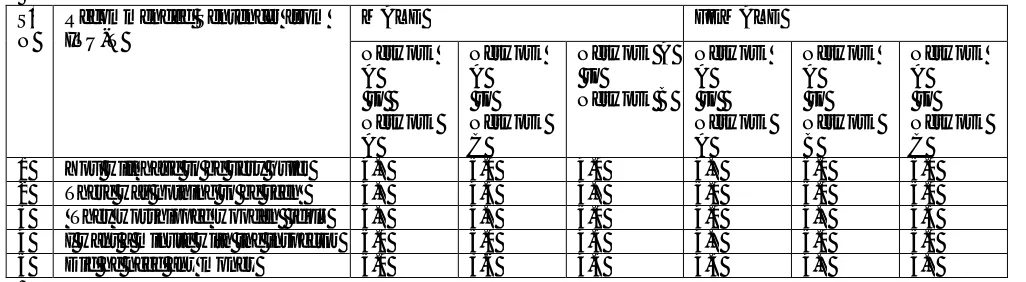
Table 3: The MOS result obtained from initialing calls from Network A to other Networks.
S/ N
Recommended Sentences from ITU-T
MALE FEMALE
Network A to Network A Network A to Network C Network A to Network B Network A to Network A Network A to Network B Network A to Network C
1 You will have to be very quiet 4.7 5.0 4.0 4.7 5.0 5.0
2 There was nothing to be seen 4.7 4.3 4.7 5.0 5.0 5.0
3 They worshipped wooden idols 4.7 4.7 5.0 4.0 4.7 4.3
4 I want a minute with the inspector 5.0 5.0 4.3 4.7 5.0 5.0
5 Did he need any money 5.0 3.6 4.3 4.3 4.7 4.7
Table 4: The MOS result obtained from initialing calls from Network B to other Networks. S
/ N
Recommended Sentences from ITU-T
MALE FEMALE
Network B to
Network A
Network B to Network C Network B to Network B Network B to Network A Network B to Network C Network B to Network B
1 You will have to be very quiet 5.0 4.3 4.7 5.0 4.3 4.7
2 There was nothing to be seen 5.0 4.0 4.7 5.0 5.0 5.0
3 They worshipped wooden idols 4.7 3.3 4.7 4.7 4.3 4.0
4 I want a minute with the inspector 5.0 4.3 5.0 5.0 4.3 4.7
5 Did he need any money 4.7 4.7 5.0 4.7 4.0 4.3
Table 5: The MOS results obtained from initialing calls from Network C to other Networks.
S/ N
Recommended Sentences from ITU-T
MALE FEMALE
Network C to Network A Network C to Network C Network C to Network B Network C to Network A Network C to Network C Network C to Network B
1 You will have to be very quiet 4.0 4.0 4.3 4.7 5.0 4.3
2 There was nothing to be seen 4.3 4.0 4.0 4.7 5.0 5.0
3 They worshipped wooden idols 3.0 3.0 3.3 4.3 3.6 4.3
4 I want a minute with the inspector 4.0 4.6 4.3 4.7 5.0 4.3
5 Did he need any money 5.0 4.3 4.7 5.0 4.3 4.0
V. DATA ANALYSIS, RESULT AND DISCUSSION
Fig 1: The causes of drop calls and level of occurrences in mobile communication networks
The drop calls, affects the quality of service; leading to increase in number of redial calls and traffic congestion in mobile communication networks. Therefore, the needs to evaluate the speech quality become imperative, using the subjective measurement method which is based on MOS values shown in Table 3 to Table 5. Statistical tools such as Root Mean Square Error (RMSE) also called the root mean square deviation presents in Equation 1 is used to measure the difference between values predicted by a model and the values actually observed from the environment that is being modeled.
= ∑ ( , ,)
(1)
Where Xobs is the observed values and Xmodel is the modeled values at the time and place i.
XObs is assume to be MOS calls values obtained from Network A to Network A mobile communication networks, while
n is the number of occurrences. Also, XModel is assume to be MOS calls values from Network A to either Network B
and Network C mobile communication network.
The RMSE value obtained from MOS values from Network A to Network C is 0.559 While the RMSE value obtained from MOS values from Network A to Network B is 0.665 The average RMSE value obtained from MOS values from Network A = 0.612
The RMSE value obtained from MOS values from Network B to Network C is 0.7987 The RMSE value obtained from MOS values from Network B to Network C is 0.2324 Similar, the average RMSE value obtained from MOS values form Network B = 0.51556
The RMSE value obtained from MOS values from Network B to Network C is 0.5916 The RMSE value obtained from MOS values from Network C to Network B is 0.7563 Also, the average RMSE value obtained from MOS values for Network B = 0.674
The total average RMSE value obtained from MOS values for male speech quality is given as
The total average RMSE value obtained from MOS value =0.612 + 0.516 + 0.674
3 = 0.601
ℎ = ∑ ( ).( )
∑ ( ) .∑ ( )
(2)
The correlation coefficient was deployed from Equation (2) to determine the strength and the linear relationship between male and female speech quality level based on the same networks (calls initialed from Network A to Network A) shown in Table 3.
Where Xi = Male
0 10 20 30 40 50 60
A
ve
ra
ge
n
u
m
b
er
o
f
o
cc
u
rr
en
ce
While Yi = Female
obtained from MOS value ̅= 4.82
obtained from MOS value = 4.54
The Correlation Coefficient (r) value obtained from MOS value is 0 (zero); therefore this result was validated using the result obtained value of Network C in Table 5. The Correlation Coefficient (r) obtained from Network C is also, 0 (zero). This implies that the male speech quality was in variance with female speech quality level. This comparison between male and female speech quality level are shown in Fig 2 and Fig 3. In addition, analysis was carried out from Table 5, shown in Fig 2 for both male and female speech quality level based on initialing calls from Network C to other mobile networks respectively. It observed that female speech sound better than the male counter parts speech.
Figure 2: Comparison of male and female voice speech quality based on initialing calls from network C.
Based on the obtained MOS values from Table 3, it was used to validate the initial result obtained from Fig 2, on the female subscriber’s speech quality level sound better than the male subscriber’s speech quality level. Also, in Figure 3, it was observed again that the female voice sound better with 51%, while the male speech quality is 49%, based on calls initialed from network A, to other mobile communication Networks.
Figure 3: Comparison of male and female speech quality based on the MOS values obtained with recommended ITU sentences.
17 18 19 20 21 22 23 24
Net. C to Net. A
Net. C to Net. C
Net. C to Net. B
Net. C to Net. A
Net. C to Net. C
Net. C to Net. B
MALE FEMALE
T
h
e
M
O
S
a
ve
ra
ge
v
al
u
e
s
fo
r
b
o
th
m
a
le
a
n
d
f
e
m
a
le
s
p
ee
ch
q
u
al
it
y
for both male and female speech quality
MAN 49% FEMALE
51%
Figure 4: The comparison between the male and female speech quality based on three mobile networks under investigation.
The cumulative MOS values for both male and female obtained from the three mobile networks, such has Network A, Network B, and Network C, were compared in Figure 4.
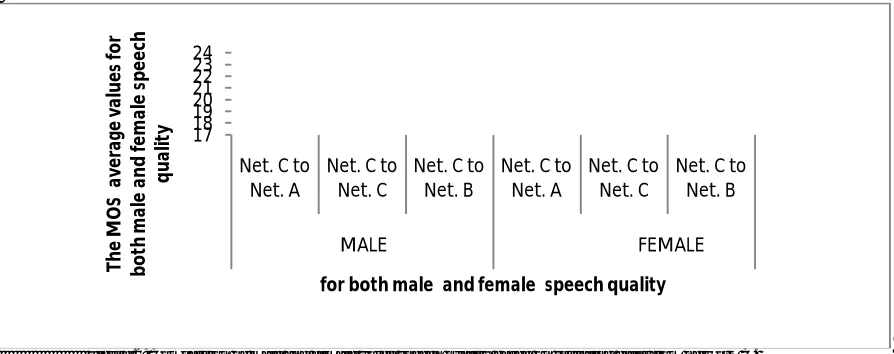
Figure 5: The comparison between various mobile networks and for both male and female speech quality with the corresponding average MOS values.
In Figure 5, shows the corresponding average MOS values comparison of various networks for both male and female speech quality level on different mobile communication networks under investigation. It is observed that Network A, average MOS value obtained is 4.67 for both male and female speech quality level, Network B, average MOS value obtained is 4.605 for both male and female speech quality level, while the Network C, average MOS value is 4.3 for both male and female speech quality level, which implies that the MOS values obtained for various mobile network is good and satisfactorily, but the mobile operators need to still improve on the speech quality level.
54 56 58 60 62 64 66 68 70 72
Male Female Male Female Male Female
Network A Network B Network C
Th
e
a
ve
ra
ge
M
O
S
va
lu
e
s
f
ro
m
t
h
e
th
re
e
m
o
b
ile
n
e
tw
o
rk
s
the comparison between male and female speech quality using the recommended sentences
3.6 3.8 4 4.2 4.4 4.6 4.8
NETWORK A NETWORK B NETWORK C
Th
e
a
ve
ra
ge
M
O
S
v
al
u
es
Various mobile networks
MALE
Figure 6: The MOS values obtained with recommended ITU sentences for three different mobile networks
From Table 5 the average MOS values obtained from initialing calls from Network C to other mobile networks such are Network A, Network B and Network C, using male speech only is shown in Fig 6, It was observed from the male speech, that low values witnessed, resulted to sharp drop in the middle of the graph, which represent low (poor) speech quality from calls initialed from Network C to Network C.
Figure 7: Various subjective recommended ITU sentences
It is observed from Fig 7, based on the recommended ITU sentences, that there are still discrepancies exist among the five recommended sentences. But three of the recommended sentences reflect close correlation, while two sentences show wide variation with the initial three sentences shown in Fig 7. Therefore, those sentences should be reconsidered for the purpose of speech quality analysis. The disadvantages of this subjective speech methods consume more time and due to the high number of listeners required to perform the test. The objective methods try to eliminate these issues and introduce a human independent approach to speech quality. This can be achieved by mathematical computational models and algorithms. However, the objective measures are widely used since they have several critical advantages over the subjective measures. Also, for further study, the subjective measurement result should be compared with objective method. In addition, the various parameters that affects or causes low speech qualities are highlighted as followed; channel noise, interferences, echo, codec used, speech level, noise level, Mobile Terminal (MT) or Mobile Station (MS), Frame-Erasure Rate (FER), Discontinuous Transmission (DTX), and handover rates and bit error ratio. In addition, the speaker dependent parameters including pitch, speaking rate and accent.
0 1 2 3 4 5 6
1 2 3 4 5
Th
e
M
O
S
av
e
ra
ge
v
a
lu
e
s
o
b
ta
in
ed
fo
r
m
a
le
s
p
e
e
ch
o
n
ly
The five sentences recommended with three different mobile networks
Network C to Network A
Network C to Network C
Network C to Network B
4.2 4.3 4.4 4.5 4.6 4.7 4.8 4.9
You will have to be very quiet
There was nothing to be seen
They worshipped wooden idols
I want a minute with the inspector
Did he need any money
A
ve
ra
ge
M
O
S
re
su
lt
s
o
b
ta
in
e
d
IV. CONCLUSION
However, due to wrinkling speech quality witnessed by subscribers in mobile communication in Nigeria has lead to low quality of service in communication sector. There is need to embark on this study “subjective speech evaluation on mobile communication networks” to determine the causes of low speech quality on mobile communication networks. Subjective method using Mean Opinion Score (MOS) was used. Three mobile networks were considered in this study, also the male and female speech quality level were examine in three different mobile networks, also comparison analysis were carried out between the various networks to determine their speech quality level, using various statistical tools such as Root Mean Square Error (RMSE) and Correlation Coefficient analysis. In addition, various causes of drop calls and low speech quality levels were highlighted such has channel noise, interferences, echo, codec used, speech level, noise level, Mobile Terminal (MT) or Mobile Station (MS), Frame-Erasure Rate (FER), Discontinuous Transmission (DTX), and handover rates and bit error ratio. In addition, the speaker dependent parameters including pitch, speaking rate and accent. It is observed that the total average RMSE value of man speech quality obtained from the three networks is 0.601, while correlation coefficient value obtained between male and female speech quality are in variance. Also, Network A has better speech quality than Network B and Network C. In addition, speech distortion has resulted in high level of drop calls in mobile communication in Nigeria.
REFERENCES
[1] Beerends, J. G., Hekstra, A. P., Rix, A. W. and Hollier, M. P., (1998), Perceptual Evaluation of Speech Quality (PESQ), the new ITU standard for end-to-end speech quality assessment. Part II – Psychoacoustic model, for publication in the J. Audio Eng. Soc. PP1-27.
[2]Fajkus Marcel, Mikulec Martin, Voznak Miroslav, Tomis Martin and Fazio Peppino, (2014), Speech Quality Measurement of GSM Infrastructure Built on USRP N210 and OpenBTS Project, Information and Communication Technologies and Services, Volume: 12, Number: 4, Page 341-347 [3]Srinivasan, A., (2011) “Speech Recognition Using Hidden Markov Model” Applied Mathematical Sciences, Vol. 5, 2011, No. 79, 3943 - 3948 [4]Miroslav Voznak and Jan Rozhon, (2012), “Influence of atmospheric parameters on speech quality in GSM/UMTS” International Journal of Mathematical Models and Methods in applied sciences, issue 4, volume 6, page 575- 582.
[5] Haider, B., Zafrullah, M., and Islam, M. K., (2009), Radio Frequency Optimization & QoS Evaluation in Operational GSM Network, Proceedings of the World Congress on Engineering and Computer Science, Vol I, WCECS 2009,
[6] Measuring MOS for VoIP test, available http://www.voipmechanic.com/mos-mean-opinion-score.htm, [Accessed: Jan 23rd 2015].
[7] Ninad Bhatt, Yogeshwar Kosta, (2011), Proposed modifications in ETSI GSM 06.10 full rate speech codec and its overall evaluation of performance using MATLAB, International Journal Speech Technology, 14: Page157–165
[8]Bhatt Ninad S. Kosta Yogesh P., (2011), Architectural study, implementation and Objective Evaluation of code Excited Linear Prediction Based GSM AMR 06.90 Speech Coder using MATLAB, International Journal of Advanced Engineering Technology, (IJAET), Vol.II Issue II PAGE 52-59
[9] Martin Kollár (2008), Evaluation of real call set up success rate in GSM, Acta Electrotechnica et Informatics Vol. 8, No. 3,Page 53–56
[10] Miroslav Voznak and Jan Rozhon, (2012) Automated Speech Quality Monitoring Tool based on Perceptual Evaluation, Recent Researches in Communications, Information Science and Education.
[11]Rohan Verma, Sandip Mandal and Anurag Kumar, (2012) , Improved Voice Quality of GSM Network through Voice Enhancement Device International Journal of Advanced Research in Computer Science and Software Engineering Volume 2, Issue 7, page 77-80.
[12]Barile,M., Camarda,P., Dell’Aquila, R. and N. Vitti (2006) Parametric Models for Speech Quality Estimation in GSM Networks, International Conference on Software in Telecommunications and Computer Networks, Page 204-208
![TABLE 1: The MOS comparison values SOURCES: [6]](https://thumb-us.123doks.com/thumbv2/123dok_us/1661209.1208512/2.595.67.528.232.306/table-the-mos-comparison-values-sources.webp)