Copyright2000 by the Genetics Society of America
A Method for Estimating the Intensity of Overdominant Selection
From the Distribution of Allele Frequencies
Montgomery Slatkin and Christina A. Muirhead
Department of Integrative Biology, University of California, Berkeley, California 94720-3140 Manuscript received May 22, 2000
Accepted for publication August 24, 2000
ABSTRACT
A method is proposed for estimating the intensity of overdominant selection scaled by the effective population size,S ⫽ 2Ns, from allele frequencies. The method is based on the assumption that, with strong overdominant selection, allele frequencies are nearly at their deterministic equilibrium values and that, to a first approximation, deviations depend only onS. Simulations verify that reasonably accurate estimates ofScan be obtained for realistic sample sizes. The method is applied to data from several loci in the major histocompatibility complex (Mhc) in numerous human populations. For alleles distinguished by both serological typing and the sequence of the peptide-binding region, our estimates ofSare compara-ble to those obtained by analysis of DNA sequences in showing that selection is strongest onHLA-Band weaker onHLA-A,HLA-DRB1, andHLA-DQA1.The intensity of selection onHLA-Bvaried considerably among populations. Two populations, Native American and Inuit, showed an excess rather than a deficiency in homozygosity. Comparable estimates ofSwere obtained for alleles atMhcclass II loci distinguished by serological reactions (serotyping) and by differences in the amino acid sequences of the peptide-binding region (molecular typing). A comparison of two types of data forDQA1andDRB1showed that serotyping led to generally lower estimates ofS.
T
HE extensive polymorphism at the major histocom- region ofMhcproteins.EdwardsandHedrick(1998) review other methods for estimating selection intensities patibility complex (Mhc) loci in humans and othervertebrates is probably attributable to balancing selec- in the Mhcregion. tion caused by the superior performance of the immune
system of individuals more heterozygous at these loci.
METHOD
HughesandYeager(1998) summarize evidence in
fa-Our method assumes a single locus withkalleles in vor of this theory. In this article we describe a simple
a population containingNdiploid individuals and sym-method for using allele frequencies at a locus to estimate
metric overdominant selection in which every heterozy-the intensity of selection in favor of heterozygotes. Our
gous individual has a fitness 1 ⫹ s relative to every method is based on the assumption that allele
frequen-homozygous individual. The frequency of theith allele is cies are held at almost the frequency expected under
xiand, at the deterministic equilibrium under selection selection alone and that deviations from those
frequen-alone,xi⫽1/k.We assume that genetic drift results in cies are determined by the balance achieved between
small deviations of allele frequencies from 1/kand write genetic drift and selection. In a previous article, we
the deviation at the ith allele as i ⫽ xi ⫺ 1/k. One showed that making such an assumption leads to an
generation of selection and genetic drift changes thei excellent approximation for the numbers of alleles
to ⬘i. We can use the standard theory of population maintained at a locus under the combined effects of
genetics to compute the approximate mean and vari-genetic drift, mutation, and overdominant selection
ance of⌬i⫽ i⫺ ⬘i and the covariance between ⌬i (Slatkin and Muirhead 1999). We first develop the
and ⌬j for the ith and jth alleles (i ⬆ j) under the basic theory, then test the performance of our method
assumption thatsis small andN is large, on simulated data, and finally apply it to several
pub-lished sets of allele frequencies atMhcloci in humans.
Our results are similar to those ofSattaet al.(1994), E(⌬i)⬵ s
冢
1k ⫹ i
冣冢
F⫺ 1k⫺ i
冣
(1a) who estimated selection intensities from the ratio ofsilent to replacement changes in the peptide-binding
Var(⌬i)⬵ (1/k⫹ i) (1 ⫺1/k⫺ i)
2N (1b)
Corresponding author: Montgomery Slatkin, Department of Inte- Cov(⌬i,⌬j)⫽ ⫺(1/k⫹ i) (1/k⫹ j)
2N , (1c)
grative Biology, University of California, 3060 Valley Life Sciences Bldg., Berkeley, CA 94720-3140.
E-mail: [email protected] whereF⫽Rix2
i is the homozygosity.
The general solution to a multidimensional diffusion the same means, variances, and covariances. The reason for using a Dirichlet rather than a multivariate normal equation based on (1) has been obtained by
Watt-erson(1977) but it is difficult to use that result to derive distribution is that the sampling distribution has a par-an estimate of the intensity of selection. Here, we obtain ticularly simple form, the multinomial Dirichlet distri-approximate results for both the population and a sam- bution,
ple from it by assuming thatF⫽ 1/k, the value at the
equilibrium under selection, and that thetare much Pr(i
1, . . . ,ik|a)⫽
兿
k j⫽1(a)(ij)
(ka)(n)
, (3)
smaller than 1/k.In other words, we assume that genetic drift results in only small deviations from the
determinis-where (a)(i) ⫽ a(a ⫹ 1) . . . (a ⫹ i⫺ 1) (Johnson et
tic equilibrium. With these approximations
al.1997). For large values ofa, there is little difference between Dirichlet and multinomial distributions, and E(⌬i)⫽ ⫺si/k, (2a)
the use of a Dirichlet distribution ensures that all allele Var(⌬i)⫽1/(2Nk), (2b)
frequencies are positive.
Given the data, Equation 3 provides the likelihood of Cov(⌬i,⌬j)⫽ ⫺1/(2Nk2), (2c)
aand hence ofS.We have written a short Mathematica where (2b) assumes that k Ⰷ 1, which is typically the (Wolfram1996) program to find the maximum-likeli-case atMhcloci. Ifkis small, thenNin (2b) is divided hood estimate (MLE) ofS,Sˆ, and will distribute copies by 1⫺1/k.A diffusion equation for the joint probability of that program upon request. This program either distribution of1, . . . ,kcan be derived from (2). The providesSˆor it indicates that the likelihood function is solution to that equation tells us that the joint probabil- a monotonically increasing function ofS, implying that ity distribution of1, . . . ,kis a symmetric multivariate there is no finite MLE value. In that case, we report the normal with mean values of 0, variances 1/(4Ns), and result asSˆ⫽∞. The value ofSˆis always positive because covariances ⫺1/(4Nsk) (Felsenstein 1977). Because of the functional dependence of the likelihood ona. xi ⫽ i ⫹ 1/k, the joint distribution of (x1, . . . , xk) is Two extreme hypotheses, S⫽ 0 and S ⫽ ∞, can be
multivariate normal with means 1/k, with equal vari- considered separately. Neutrality (S⫽0) can be tested ances given by (2b) and with equal covariances given using eitherWatterson’s (1977) test based on the ob-by (2c). served homozygosity,F(also called the Ewens-Watterson Under this model and under the assumption of strong test), or an exact test (Slatkin 1994). We used the selection, the joint distribution of allele frequencies in program described by
Slatkin(1996) to carry out the the population depends on only one combination of Ewens-Watterson test and provide the tail probability parameters, 4Ns, which we denote by 2Sto be consistent P
H. The value ofPHis the probability under neutrality
with previous notation. The problem is to estimate S (S ⫽ 0) of obtaining a value of F no larger than the from a sample from a population. A data set consists of observed value in a random sample of the same size a set of counts of each allele, {ij} (j⫽1 , . . . ,k), where containing the same number of alleles. A small value Rk
j⫽1ij⫽ n, the sample size (n/2 being the number of of P
Hindicates too little homozygosity and can be the
individuals sampled). In general, the true number of result of overdominant selection. A value ofP
Hclose to
alleles at the locus is unknown so, in our analysis, k 1 indicates excess homozygosity and can be the result means the number of alleles found in the sample and of purifying selection. The exact test is similar but was theijare all nonzero. The value ofkcan and does differ not designed to be powerful against the specific alterna-among populations. Our method assumes in effect that tive of overdominant selection.
differences among populations in the number of alleles The other extreme hypothesis is
S ⫽ ∞, in which found in a sample reflect differences among popula- case the allele frequencies are at their deterministic tions in the true number of alleles present. It would be equilibrium value, 1/k, and the deviations from those easy to modify the method presented here so that the frequencies are attributable to sampling only. The test true number of alleles is assumed known and that some forS⫽∞is then a test of the hypothesis that the sample of theijare zero. Such a modification would increase is drawn from a multinomial distribution with equal the apparent variance in allele frequencies and reduce probabilities and sample size n. For reasonably large the estimated values ofS. sample sizes, a2test withk⫺ 1 d.f. can be used and
To simplify the analysis, we further approximate the a probability of the data under the hypothesis thatS⫽ multivariate normal distribution of allele frequencies ∞, P
M (M for multinomial), can be obtained. A
one-by a symmetric Dirichlet distribution, sided test is appropriate in this case because we assume
random sampling is always present and the only ques-Pr(x1, . . . ,xk|a)⫽ ⌫
(ka) (⌫(a))k
兿
k
j⫽1
xa⫺1
j , tion is whether there is significant deviation from equal frequencies. A value ofPM⬎0.05 indicates that the data
do not reject the hypothesis thatS⫽∞. Our Mathemat-where the parameter a is chosen so that S ⫽ k2(1 ⫹
head1999) and those ofTakahata(1990) provide a formula relating the expected number of alleles toS and the scaled mutation rate,M⫽Nu:
k⫽
冪
2Sln(S/32M2). (4)
Equation 4 can be solved for M as a function of k andS:
M⫽
冪
S 32e⫺S/k2
. (5)
WhenSˆis finite, our program calculatesMfrom Equa-tion 5.
Figure1.—Frequency distribution ofSˆin two sets of 1000 SIMULATION TEST replicates of a model withN⫽10,000,u⫽10⫺6(M⫽0.1),
and s⫽ 0.01 (S ⫽ 400). For n ⫽ 100, Sˆ was finite in 902 We applied our method to simulated data generated replicates and forn⫽1000,Sˆwas finite in 997 replicates (cf. by the program described in our earlier article (Slatkin Table 1).
andMuirhead1999). For each replicate, the parame-ters areS ⫽ 2Ns, M ⫽ Nu, and n, the sample size. In all cases, we assumedN⫽10,000. Samples were taken For any data set, our program and the program to
test neutrality provide three numbers,Sˆ,PM, andPH. We after the numbers of alleles reached stationarity. For
each set of parameter values we generated 1000 repli-found in some cases that PM⬍0.05 butSˆ⫽ ∞, but we
have found no cases in whichPM⬎0.05 butSˆis finite. cate data sets.
Typical distributions ofSˆare shown in Figure 1 and In the simulated data sets described in the next section
we found several for whichPM⬎0.05, but no such cases the summary of results is shown in Table 1. For the
parameter values we used in our simulations, estimates in any of the real data sets we analyzed.
Our method estimatesSfrom the extent of variation ofS are relatively unbiased although they have broad 95% confidence intervals. Averages and confidence in-in allele frequencies at a locus. The dependence onk
is very weak. Our previous results (SlatkinandMuir- tervals reported in Table 1 are based on all replicates
TABLE 1
Performance of method for findingSˆ, the MLE ofS⫽2Nsin sets of 1000
replicate simulations for each set of parameter values
n u Average (Sˆ) 95% C.I. Sˆ⬍∞ PM⬎0.05
A.S⫽400 (s⫽0.02)
100 10⫺6 598 (116, 2895) 902 383
1,000 10⫺6 429 (74, 1419) 997 1
20,000 10⫺6 372 (49, 1332) 1000 0
100 10⫺7 527 (98, 2528) 778 530
1,000 10⫺7 555 (104, 1996) 980 11
20,000 10⫺7 543 (55, 1832) 997 0
B.S⫽4000 (s⫽0.2)
100 10⫺6 5330 (1213, 20812) 720 796
1,000 10⫺6 3139 (1162, 7831) 1000 1
20,000 10⫺6 2532 (635, 5799) 1000 0
100 10⫺7 4585 (917, 17174) 659 821
1,000 10⫺7 3666 (1294, 10980) 998 2
20,000 10⫺7 3229 (1018, 6769) 1000 0
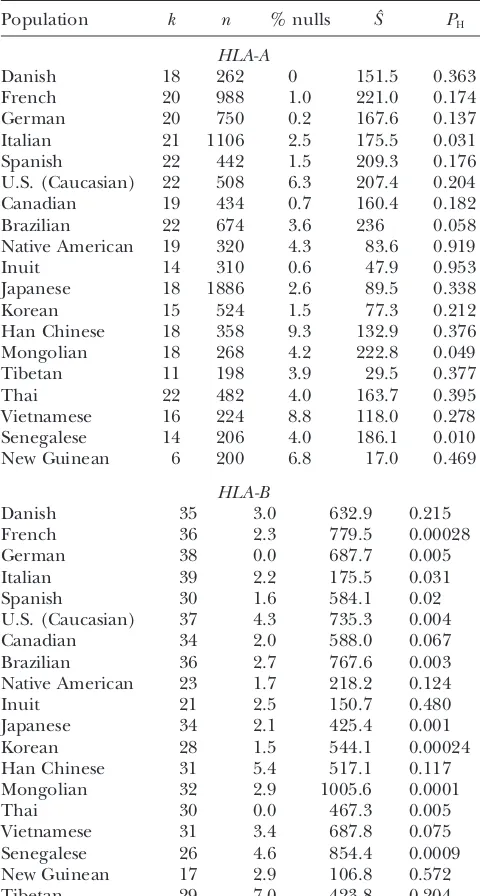
TABLE 2 TABLE 2
Analysis of allele frequencies at several human MHC loci (Continued)
Population k % nulls Sˆ PH
Population k n % nulls Sˆ PH
HLA-A HLA-DRB1
Danish 18 3.8 206.8 0.009
Danish 18 262 0 151.5 0.363
French 20 988 1.0 221.0 0.174 French 20 4.4 186.1 0.002
German 20 1.1 168.0 0.006
German 20 750 0.2 167.6 0.137
Italian 21 1106 2.5 175.5 0.031 Italian 16 7.1 137.6 0.009
Spanish 17 3.5 135.2 0.023
Spanish 22 442 1.5 209.3 0.176
U.S. (Caucasian) 22 508 6.3 207.4 0.204 U.S. (Caucasian) 21 5.0 194.9 0.007
Canadian 16 1.3 161.0 0.002
Canadian 19 434 0.7 160.4 0.182
Brazilian 22 674 3.6 236 0.058 Brazilian 19 4.5 172.8 0.002
Native American 16 2.8 91.4 0.874
Native American 19 320 4.3 83.6 0.919
Inuit 14 310 0.6 47.9 0.953 Inuit 15 9.0 105.6 0.301
Japanese 23 3.0 203.0 0.002
Japanese 18 1886 2.6 89.5 0.338
Korean 15 524 1.5 77.3 0.212 Korean 17 2.6 148.3 0.004
Han Chinese 16 6.2 115.4 0.024
Han Chinese 18 358 9.3 132.9 0.376
Mongolian 18 268 4.2 222.8 0.049 Mongolian 15 8.0 282.7 0.0001
Thai 17 3.3 157.6 0.006
Tibetan 11 198 3.9 29.5 0.377
Thai 22 482 4.0 163.7 0.395 Vietnamese 16 2.7 179.6 0.159
Vietnamese 16 224 8.8 118.0 0.278
HLA-DQA1
Senegalese 14 206 4.0 186.1 0.010
Danish 6 1.5 29.8 0.062
New Guinean 6 200 6.8 17.0 0.469
French 10 8.7 120.4 0.0003
German 10 1.4 168.0 0.006
HLA-B
Danish 35 3.0 632.9 0.215 Italian 10 9.9 46.0 0.021
Spanish 10 6.6 99.0 0.006
French 36 2.3 779.5 0.00028
German 38 0.0 687.7 0.005 U.S. (Caucasian) 9 8.7 44.4 0.065
Canadian 9 3.3 32.6 0.113
Italian 39 2.2 175.5 0.031
Spanish 30 1.6 584.1 0.02 Native American 10 6.9 42.1 0.834
Inuit 10 10.0 31.9 0.845
U.S. (Caucasian) 37 4.3 735.3 0.004
Canadian 34 2.0 588.0 0.067 Japanese 11 10.0 36.3 0.030
Thai 10 4.2 49.5 0.127
Brazilian 36 2.7 767.6 0.003
Native American 23 1.7 218.2 0.124 Vietnamese 9 6.4 49.7 0.146
Inuit 21 2.5 150.7 0.480
Data fromTsujiet al.(1992). The sample sizes,n, are the
Japanese 34 2.1 425.4 0.001
same for all loci and are not repeated in the latter parts of
Korean 28 1.5 544.1 0.00024
the table.
Han Chinese 31 5.4 517.1 0.117
Mongolian 32 2.9 1005.6 0.0001
Thai 30 0.0 467.3 0.005
Vietnamese 31 3.4 687.8 0.075 We also simulated some cases with weaker selection,
Senegalese 26 4.6 854.4 0.0009 S ⫽ 40. For this selection coefficient, we had to use
New Guinean 17 2.9 106.8 0.572 higher mutation rates to obtain numbers of alleles
com-Tibetan 29 7.0 423.8 0.204
parable to what is found in many data sets we analyzed.
(continued) In all cases, N ⫽ 10,000. With u ⫽ 10⫺5, the average
number of alleles is ⵑ9 and for u ⫽ 5 ⫻ 10⫺5, the
average isⵑ15. For the smaller mutation rate,PH⬍0.05
in 603 of 1000 replicates withn ⫽100, andPH⬍0.05
for which Sˆ ⬍ ∞. For a particular data set, it appears
in 785 of 1000 replicates withn⫽1000. With the higher that if an estimate can be obtained at all, it is of the
mutation rate,PH⬍0.05 in 318 of 1000 replicates with
correct order of magnitude at least.
n ⫽100 and 453 of 1000 replicates with n⫽ 1000. In In almost all cases, neutrality could be rejected using
all cases, averages ofSˆwere biased upward somewhat. the Ewens-Watterson test even with a sample size of 100.
Even when the entire population is sampled,Sˆis not For the examples summarized in Table 1 withn⫽100,
the true value. The reason is thatSˆreflects two sources with u ⫽ 10⫺6 and s ⫽ 0.02 (S ⫽ 400 and M ⫽ 0.1)
of variation, variation attributable to sampling and varia-PH ⬍ 0.05 in 997 out of 1000 replicates and withu ⫽
tion attributable to stochastic variation in the allele fre-10⫺7, P
H ⬍ 0.05 in all 1000 replicates. For the larger
quencies. Sampling the entire population removes only sample size (n ⫽ 1000) and both selection intensities
one source of variation. The relatively weak dependence (S ⫽ 400 and S ⫽ 4000), and for the smaller sample
of the variance ofSˆon sample size shows that stochastic size (n⫽100) and the stronger selection intensity (S⫽
Figure 2.—Values of Sˆ for alleles distin-guished by serotyping for four humanMhcloci (A, HLA-A; B, HLA-B; DQ, HLA-DQA1; DR, HLA-DRB1) in 11 populations (FRA, French; GER, German; ITA, Italian; NAI, Native Ameri-can; INU, Inuit; JAP, Japanese; THA, Thai; VIE, Vietnamese; USA, United States; SEN, Senegalese).
Estimates ofMobtained in the same set of replicates recognizable alleles was usually⬍0.05. To obtain wider geographic coverage, we included some populations are not as good and are probably not very useful. In
most of the cases we examined, average estimates ofM with slightly higher frequencies of null alleles. Table 2 shows the populations, loci, and sample sizes, and the are not of the correct order of magnitude and the 95%
confidence interval covers several orders of magnitude. values ofSˆandPHfor each case. In no case wasSˆ⫽∞
obtained and in all casesPMwas 0 or nearly so, indicating
For example, withn⫽1000,S⫽400, andM⫽0.01, the
average estimate ofMwas 0.11 and the 95% confidence that the hypothesisS ⫽∞could always be rejected. ForHLA-A, values ofPHindicate neutrality cannot be
interval was (9.8⫻ 10⫺8, 0.44). Our conclusion is that
the method estimates S reasonably well, to within an rejected in most populations, yet values ofSˆare gener-ally larger than those fromHLA-DRB1andHLA-DQA1, order of magnitude at least, even for samples as small
as 100, but that the estimate ofMis not accurate enough for which neutrality could usually be rejected. Neutrality could not be rejected for any of the samples from Native to be useful.
Americans and Inuits for any of the four loci. In those two populations, the value of PH for HLA-A is close APPLICATIONS
enough to one that there appears to be significantly more homozygosity than expected under neutrality. It We applied our method for estimatingSto two
pub-is difficult to know whether the excess homozygosity lished data sets. The first data set is based on alleles
results from a problem with serotyping, from evidence distinguished by serological typing (or serotyping) and
of purifying selection, or from admixture in those popu-was presented at the histocompatibility workshop held
lations. We considered the possibility that a population in 1991 (Tsujiet al. 1992). These data were analyzed
bottleneck could lead to excess homozygosity, but simu-previously by Satta et al. (1994) and copies of these
lation results from a model of a bottlenecked population data were kindly provided to us by Dr. Y. Satta. We
could not reproduce the patterns found in the Native analyzed data from four loci, two class I loci, human
American and Inuit samples (results not shown). A bot-histocompatibility system HLA-A and HLA-B, and two
tleneck generally results in the loss of alleles rather than class II loci, HLA-DQA1 and HLA-DRB1. The second
excess homozygosity. data set was for class II loci for which alleles could be
Our results are similar to those obtained bySattaet distinguished by differences in DNA sequence in the
al.(1994). Our estimates ofSare consistently lower than known or presumed peptide-binding regions (molecular
those in Table 2 ofSattaet al.(1994). Their estimates typing), which are thought to be the targets of selection
ofS were based on the comparison of pairwise differ-(HughesandYeager1998). We analyzed the data for
ences in silent and replacement sites in the peptide-four loci,HLA-DQA1,HLA-DQB1,HLA-DPB1, and
HLA-binding region. They used five different methods that DRB1. These data were published in the proceedings
gave somewhat different results. Their method I gave of a later workshop on HLA (Charron1997) and were
the lowest estimates:HLA-A,S⫽690;HLA-B,S⫽1200; analyzed previously byValdeset al.(1999). These data
HLA-DRB,S⫽990; andHLA-DQB1,S⫽360. ForHLA-A, were kindly provided by Dr. S. McWeeney. Only alleles
the largest values ofSˆwe found are slightly⬎200 (Figure at class II loci can be distinguished by molecular typing.
2). ForHLA-B, most of theSˆvalues were between 500
Alleles distinguished by serotyping:We restricted our
and 800 with only one⬎1000. The ratio ofSˆforHLA-B analysis to populations in which the sample size was
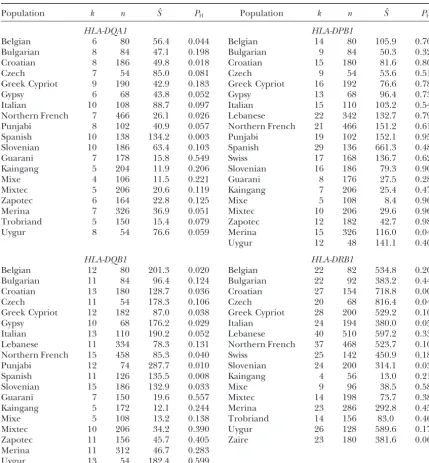
TABLE 3
Analysis of allele frequencies at four human MHC loci based on sequence typing of alleles
Population k n Sˆ PH Population k n Sˆ PH
HLA-DQA1 HLA-DPB1
Belgian 6 80 56.4 0.044 Belgian 14 80 105.9 0.701
Bulgarian 8 84 47.1 0.198 Bulgarian 9 84 50.3 0.329
Croatian 8 186 49.8 0.018 Croatian 15 180 81.6 0.805
Czech 7 54 85.0 0.081 Czech 9 54 53.6 0.512
Greek Cypriot 9 190 42.9 0.183 Greek Cypriot 16 192 76.6 0.788
Gypsy 6 68 43.8 0.052 Gypsy 13 68 96.4 0.733
Italian 10 108 88.7 0.097 Italian 15 110 103.2 0.540
Northern French 7 466 26.1 0.026 Lebanese 22 342 132.7 0.795
Punjabi 8 102 40.9 0.057 Northern French 21 466 151.2 0.612
Spanish 10 138 134.2 0.003 Punjabi 19 102 152.1 0.957
Slovenian 10 186 63.4 0.103 Spanish 29 136 661.3 0.488
Guarani 7 178 15.8 0.549 Swiss 17 168 136.7 0.624
Kaingang 5 204 11.9 0.206 Slovenian 16 186 79.3 0.902
Mixe 4 106 11.5 0.221 Guarani 8 176 27.5 0.282
Mixtec 5 206 20.6 0.119 Kaingang 7 206 25.4 0.471
Zapotec 6 164 22.8 0.125 Mixe 5 108 8.4 0.960
Merina 7 326 36.9 0.051 Mixtec 10 206 29.6 0.964
Trobriand 5 150 15.4 0.079 Zapotec 12 182 42.7 0.980
Uygur 8 54 76.6 0.059 Merina 15 326 116.0 0.044
Uygur 12 48 141.1 0.403
HLA-DQB1 HLA-DRB1
Belgian 12 80 201.3 0.020 Belgian 22 82 534.8 0.203
Bulgarian 11 84 96.4 0.124 Bulgarian 22 92 383.2 0.449
Croatian 13 180 128.7 0.036 Croatian 27 154 718.8 0.008
Czech 11 54 178.3 0.106 Czech 20 68 816.4 0.047
Greek Cypriot 12 182 87.0 0.038 Greek Cypriot 28 200 529.2 0.104
Gypsy 10 68 176.2 0.029 Italian 24 194 380.0 0.052
Italian 13 110 190.2 0.052 Lebanese 40 510 597.2 0.338
Lebanese 11 334 78.3 0.131 Northern French 37 468 523.7 0.102
Northern French 15 458 85.3 0.040 Swiss 25 142 450.9 0.180
Punjabi 12 74 287.7 0.010 Slovenian 24 200 314.1 0.036
Spanish 11 126 135.5 0.008 Kaingang 4 56 13.0 0.215
Slovenian 15 186 132.9 0.033 Mixe 9 96 38.5 0.583
Guarani 7 150 19.6 0.557 Mixtec 14 198 73.7 0.388
Kaingang 5 172 12.1 0.244 Merina 23 286 292.8 0.459
Mixe 5 108 13.2 0.138 Trobriand 14 156 83.0 0.463
Mixtec 10 206 34.2 0.390 Uygur 26 128 589.6 0.174
Zapotec 11 156 45.7 0.405 Zaire 23 180 381.6 0.064
Merina 11 312 46.7 0.283
Uygur 13 54 182.4 0.599
Data are fromCharron(1997). The order of the populations is the same as in Table 3 ofValdeset al. (1999).
than the ratio found by Satta et al.for their method I et al. (1994) for the same four loci, but, as with the previous data set, our estimates of S are consistently but comparable to values they obtained using the other
four methods. Given the wide confidence intervals asso- smaller than theirs. ForDQA1andDRB1we have esti-mates based on both serotyping and molecular typing. ciated with both methods for estimating selection
inten-sities, our results are compatible with those ofSattaet The data sets are mostly for different populations and, even when the same population is represented, different al.(1994).
Alleles distinguished by molecular typing: Table 3 individuals were sampled. The results from analyzing the two data sets are comparable. Most values of Sˆfor shows the results for four class II loci. Values of Sˆ are
consistently larger for DQB1 than DQA1. Values for European populations are between 50 and 100 with smaller values for Native American populations. The DRB1 are the largest. The orders of magnitude of the
Figure 3.—Values ofSˆ and PHfrom Table 3 for alleles distinguished by molecular typing for four Mhcclass II loci in several human popula-tions.
smaller than based on serotyping for Native Americans. DNA sequence in the peptide-binding region would be more likely to create functionally different alleles. To Values ofSˆare larger forDRB1, and again Native
Ameri-can populations have the smallest values. explore the effects of intragenic recombination, a se-quence-based simulation model of the kind analyzed by
Satta(1997) is necessary but that is beyond the scope
DISCUSSION AND CONCLUSIONS of our study. Satta assumed that heterozygote fitness
increased with the difference in DNA sequence of the Our method provides a simple way to estimate the
peptide-binding region and allowed for intragenic re-strength of overdominant selection from the observed
combination to create functionally different alleles. distribution of allele frequencies. The estimate ofS is
Both of these assumptions lead to increased variance essentially the inverse of the variance in frequencies.
in allele frequencies under selection alone and hence The multinomial Dirichlet distribution (3) is used to
would reduce estimates ofSobtained using our method. account for sampling. Our estimate of S is always an
Our method is similar to methods developed byM. N.
underestimate of the true intensity of selection because
Grote(unpublished results) and byP. Donnelly, M.
other factors, particularly differences in fitness among
NordbergandP. Joyce(unpublished results), both of different alleles or anything else that causes deviations
which rely on the theory ofJoyce(1995). These meth-from the stationary distribution of allele frequencies,
ods are mathematically much more sophisticated than increase the variance and hence reduce the estimate of
the method presented here and require extensive simu-S.Our method assumes all variation in observed allele
lation to obtain an estimate ofS for a single data set. frequencies is the result of sampling and genetic drift.
Donnelly et al. apply their method to data for a locus The estimate of Sobtained is an estimate of the net
with four alleles and observed counts (46, 166, 112, and force tending to equalize allele frequencies. That force
120) and estimate S to be 36. Our method gives 47, could be attributable only to overdominance in fitness,
which is consistent with their results. as we have assumed, or to frequency-dependent
selec-There is no simple relationship between our estimates tion resulting from mating preferences or some other
ofSand the tail probability from the Ewens-Watterson factor. The estimate itself does not indicate the kind of
homozygosity test,PH. The variance in allele frequency
selection acting and does not validate a particular model
is closely related to the homozygosity, of selection.
Another possible cause of differences in allele
fre-Var(x)⫽ 1 k
兺
k
i⫽1
(xi⫺x)2⫽1 k
冢
F⫺1
k
冣
, (6) quencies is bias in the mutation process, with somealleles or types of alleles arising more frequently than
others. Intragenic recombination between different al- where kis the number of alleles,xiis the frequency of theith allele,x⫽1/kis the average allele frequency, leles could contribute to bias in mutation because
re-combination between alleles that are more different in andF⫽Rk
sam-Edwards, S. V.,andP. W. Hedrick,1998 Evolution and ecology
pling,SˆandPHdepend in complex ways onkand the
of MHC molecules: from genomics to sexual selection. Trends
counts of each allele. Figure 3 shows plots of Sˆ vs. PH Ecol. Evol.13:305–311.
Felsenstein, J., 1977 Multivariate normal genetic models with a
for each of the four loci in Table 3. Although it would
finite number of loci, pp. 227–246 inProceedings of the International be convenient if PHindicated roughly the intensity of Conference on Population Genetics, edited byE. Pollak, O.
Kemp-selection, it does not appear to do so very well. thorneandT. J. Bailey.Iowa State University Press, Ames, IA.
Hughes, A. L., andM. Yeager,1998 Natural selection at major
Our estimates of SforHLA-Aare of the same order
histocompatibility complex loci of vertebrates. Annu. Rev. Genet.
of magnitude as those obtained bySattaet al.(1994) 32:415–435.
from the analysis of silent and replacement differences Johnson, N. L., S. KotzandN. Balakrishnan,1997 Discrete Multi-variate Distributions.John Wiley & Sons, New York.
in the peptide-binding region ofHLA-A.There appears
Joyce, P.,1995 Robustness of the Ewens sampling formula. J. Appl.
to be some geographic variation in the intensities of Probab.32:609–622.
overdominant selection in human populations. The Satta, Y.,1997 Effects of intra-locus recombination of HLA poly-morphism. Hereditas127:105–112.
broad confidence intervals onSˆwe found in simulations
Satta, Y., C. O’Huigin, N. TakahataandJ. Klein,1994 Intensity
mean that differences among European, Asian, and the of natural selection at the major histocompatibility complex loci.
Proc. Natl. Acad. Sci. USA91:7184–7188.
one African population analyzed are not significant at
Slatkin, M.,1994 An exact test for neutrality based on the Ewens
any of the loci. It does appear that in the two North
sampling distribution. Genet. Res.64:71–74.
American populations, Native Americans and Inuit, ei- Slatkin, M.,1996 A correction to the exact test based on the Ewens sampling distribution. Genet. Res.68:259–260.
ther selection is much weaker than in the rest of the
Slatkin, M.,andC. A. Muirhead,1999 Overdominant alleles in a
world or that admixture has resulted in the appearance population of variable size. Genetics152:775–781.
of weaker selection. Takahata, N., 1990 A simple genealogical structure of strongly balanced allelic lines and trans-species evolution of polymor-We thank Dr. Y. Satta for providing copies of the data analyzed in phism. Proc. Natl. Acad. Sci. USA87:2419–2423.
the article bySattaet al.(1994) and Dr. S. McWeeney for providing Tsuji, K., M. AizawaandT. Sasazuki(Editors), 1992 HLA 1991: copies of the data analyzed byValdeset al.(1999), and for helpful Proceedings of the Eleventh International Histocompatibility Workshop and Conference Held in Yokohama, Japan, 6-13 November, 1991. Ox-discussions of this project. This research was supported in part by
ford University Press, Oxford. National Institutes of Health (NIH) grant GM40282 to M. Slatkin and
Valdes, A. M., S. K. McWeeney, D. Meyer, M. P. NelsonandG.
by an NIH traineeship to C. A. Muirhead from grant GM07127.
Thomson, 1999 Locus and population specific evolution in
HLA class II genes. Ann. Hum. Genet.63:27–43.
Watterson, G. A.,1977 Heterosis or neutrality? Genetics85:789–
814.
Wolfram, S.,1996 The Mathematica Book.Wolfram Media,
Cham-LITERATURE CITED
paign, IL.
Charron, D.(Editor), 1997 Genetic Diversity of HLA: Functional and