ABSTRACT
ZHAO, LUYANG. Single Nanoparticle Microscopy and Spectroscopy. (Under the direction of Dr. Gufeng Wang).
Understanding the properties of nanometer-sized particles, e.g. how they behave on or near interfaces, and how they respond to light, is important for the fundamental sciences and many emerging applications. In this dissertation, we develop three-dimensional (3D) single particle tracking microscopy to study the particle-surface interactions in confined spaces, and construct micro-spectrometers to study the scattering and luminescence of individual gold nanoparticles. Efforts are made toward using light to enhance the catalytic activity of metal nanoparticles through the design of hetero-metallic nanostructures.
First, we study how negatively charged nanoparticles interact with the samely charged flat solid surfaces. By tracking the 3D trajectories of the nanoparticles near the surface, we find that contrary to conventional wisdom that nanoparticle retention is achieved by frequent adsorption/desorption events, the nanoparticles are retained on or near the surface through a long-range, like-charge attraction. A counter-ion interaction theory is proposed and the characteristic length scale is determined for this interaction. This new theory is important in explaining the specific binding between biomolecules/ nanoparticles and a solid or semi-fluidic membrane surface when the antigen concentration is low.
solvents, the decrease of particle individual steps is proportional to the increment of viscosity as expected. As a contrast, increasing the pore wall affinity only decreases the step size by a small fraction. This suggests that the direct withholding of the particle by the pore wall alone does not account for the increased residence time in the pore. A restricted diffusion mode is possibly the main reason in holding particles in surface-modified pores for longer time. This study depicts a picture of macroscopically slow but microscopically active nanoparticle movement in confined spaces.
In recent years, gold nanoparticles are receiving more attention because of their potentials in serving as imaging labels, optical sensors, and heterogeneous catalysts, etc. Despite of extensive studies in the literature, their luminescence mechanism is not clear. We recently found that when gold nanoparticles were excited at the red side of the surface plasmon resonance (SPR) wavelength by a continuous wave (CW) laser, up-converted luminescence was discovered, possibly involving a new emission mechanism: phonon-coupled interband transitions. With this knowledge, we study the origin of gold nanorods luminescence under multiphoton excitation conditions. By exciting gold nanorods with different aspect ratios at different excitation wavelengths using a femtosecond laser, we show that gold nanorod luminescence at the blue side of the excitation has mixed contributions from two-photon excited surface plasmon resonance (SPR) emission and single photon excited up-converted luminescence from interband transition. The total luminescence is enhanced by single photon excited SPR.
Single Nanoparticle Microscopy and Spectroscopy
by Luyang Zhao
A dissertation submitted to the Graduate Faculty of North Carolina State University
in partial fulfillment of the requirements for the degree of
Doctor of Philosophy
Chemistry
Raleigh, North Carolina 2015
APPROVED BY:
_______________________________ _______________________________ Dr. Gufeng Wang Dr. Edmond F. Bowden
Committee Chair
BIOGRAPHY
Luyang Zhao was born in Xingtai, Hebei, China on November 10th 1988. He is a typical scorpio and he doesn’t feel bad about it at all. Luyang had an outstanding academic
ACKNOWLEDGMENTS
I would like to first thank my parents, Zhao Zhanping and Li Li, for their unconditional love and support. Without them, I would not have made it this far. They have supported me throughout my life and provided a foundation that has allowed me to flourish and pursue my own life. I know not all people are so lucky, and I am grateful.
I would like to sincerely thank my advisor Dr. Gufeng Wang for his patience and guidance not just in research but also in life. The picture of our first meet is still clearly in my mind and he was just as young as a postdoc at that time. I see how work stress changes a person in four years. He has great influence on me including research interest, career choice and attitude toward life and work. Thank you for taking me when I switched group. Thank you for being such a nice boss. I could have quit PhD without your support. Finally I want to say that I am sorry that I’m not doing that well in research. I hope I could contribute more,
and I really do.
There are a lot of friends that I’d like to acknowledge. I’d like to thank Mengran Liu for growing up together and supporting me in every aspect. I wish you all the best. My furry friends, Yao Wang and Fengyuan Gong, thank you for hanging around. Thanks to my former roommate and classmate, Jin Wang. I really enjoy the time when we lived together and played Xbox every night. Thanks my current roommate Xin Xu for the meaningful conversations and divinations. You will be a master one day.
TABLE OF CONTENTS
LIST OF TABLES ... x
LIST OF FIGURES ... xi
Chapter 1 Background and Significance ... 1
1.1 Overview of Particle/Molecule-Surface Interactions ... 1
1.1.1 Importance of Interfacial Studies ... 2
1.1.2 Nanoparticles/Molecules Behave Differently on or near Interfaces ... 2
1.1.3 How Nanoparticles/Molecules Interact with Surfaces: Long-range or Short-range Interaction?... 3
1.1.4 Size Matters ... 5
1.1.5 Super-resolution Optical Microscopy Provides a New Opportunity ... 6
1.2 Three-dimensional Super Resolution Microscopy ... 6
1.2.1 3D Point Spread Function and Model-based Correlation Imaging ... 6
1.2.2 Localization Accuracy and Precision ... 10
1.2.3 Comparison with Other Super Resolution Optical Techniques ... 14
1.3 Gold Nanoparticle Luminescence... 14
1.3.1 Origin of Luminescence and Involvement of Surface Plasmon Resonance .... 14
1.3.2 One Photon Excitation and Two Photon Excitation ... 15
1.3.3 Luminescence or Resonant Raman Scattering ... 17
1.3.4 Instrumentation ... 18
1.4 How Light Enhances the Catalytic Activity of Palladium-coated Gold Nanorods ... 20
1.4.1 Noble-metal Nanoparticle Catalysts ... 20
1.4.3 Photothermal Effect or Enhanced Local Electromagnetic Field? ... 21
1.4.4 Palladium-coated Gold Nanorods ... 22
Chapter 2 Long-Range Trapping of Single Particles near Liquid-Solid Interface ... 24
2.1 Introduction ... 24
2.2 Results and Discussion... 25
2.2.1 Particles Are Remotely Retained by Attractive Site(s) near Surface ... 26
2.2.2 Both the Attractive Site and the Surface Influence Particle Distribution. ... 35
2.2.3 pH Affects the Particle-Surface Interactions ... 39
2.2.5 Rugged PES near Surface ... 44
2.2.6 “Trapped Diffusion” as an Important Mechanism for Surface Diffusion and Targeted Binding ... 46
2.2.7 Implication for the Novelty of the Discovery ... 47
2.3 Conclusions ... 49
2.4 Experimental ... 49
2.4.1 Materials and Sample Preparation ... 50
2.4.2 Atomic Force Microscopy ... 50
2.4.3 3D Imaging ... 51
2.5 Supporting Information ... 51
2.5.1 Particle-Wall Interaction Analyzed with DLVO Theory ... 51
2.5.2 Potential Energy Surface Calculated from Particle 3D Distribution ... 54
2.5.3 Proposing PES of Glass Surface ... 55
2.5.4 More Examples - Different Types of Interception ... 57
Chapter 3 Three-Dimension Tracking Microscopic Movements of Diffusing Nanoparticles in Cylindrical Nanopores ... 61
3.1 Introduction ... 61
3.2.1 Particle Diffusing Trajectories ... 64
3.2.2 Calculation of Diffusion Coefficients ... 67
3.2.3 Slowing Down in Viscous Buffer or “Sticky” Pore Wall ... 71
3.2.4 Calculation of Activation Energy ... 78
3.2.5 Confined Diffusion in Axial Direction ... 81
3.3 Conclusions ... 85
3.4 Experimental ... 86
3.4.1 Chemicals and Sample Preparation ... 86
3.4.2 C18/PEG Modification of Pore Wall ... 87
3.4.3 Epi-fluorescence Microscopy and CCD Camera ... 87
3.5 Supporting Information ... 88
3.5.1 Defects on the Pore Wall ... 88
3.5.2 Diffusion Coefficient Calculated from MSD vs Δt Plot ... 90
3.5.3 Theoretical Bulk Diffusion Coefficient ... 91
3.5.4 Hydrodynamic Theory ... 92
3.5.5 Criteria for Counting Particle Residence Time in Pores ... 93
3.5.6 Gibbs Free Energy and Activation Energy of Particle Withheld by the Pore Wall ... 93
Chapter 4 Luminescence of Gold Nanorods Excited by a Femtosecond Laser ... 99
4.1 Introduction ... 99
4.2 Results and Discussion... 105
4.2.1 General Description of Luminescence Spectrum ... 105
4.2.2 Luminescence of Short Rods ... 110
4.2.3 Luminescence Intensity ... 113
4.2.4 Luminescence of Long Rods ... 114
4.2.5 Silver Component in Gold Nanorods ... 115
4.4 Experimental ... 116
4.4.1 Gold Nanorods ... 116
4.4.2 Optical measurements ... 117
4.5 Supporting Information ... 117
4.5.1 Up-conversion Luminescence of Gold Nanoparticles ... 118
Chapter 5 Palladium-Coated Gold Nanorods Drastically Expedite Photo-Reduction of Resazurin to Resorufin ... 121
5.1 Introduction ... 121
5.2 Results and Discussion... 123
5.2.1 Scattering Spectrum of Pd-coated Au Nanorods ... 124
5.2.2 Photo-reduction of Resazurin to Resorufin in the Presence of Hydrazine .... 127
5.2.3 Pd-coated Au Nanorods Greatly Expedite Photo-reduction of Resazurin to Resorufin ... 131
5.2.4 Distribution of Catalytic Sites on Pd-coated Au Nanorods ... 140
5.2.5 Kinetic Mechanism Revealed by on ... 144
5.3 Conclusions ... 146
5.4 Experimental ... 147
5.4.1 Materials ... 147
5.4.2 Synthesis of Pd-coated Au Nanorods ... 147
5.4.3 Synthesis of Pd Nanospheres ... 148
5.4.4 Catalytic Reaction in Bulk Solution ... 148
5.4.5 Catalytic Reaction at Single Molecule Level ... 148
5.4.6 Optical Microscopy ... 149
Chapter 6 Conclusion and Outlook ... 151
6.2 Further Work ... 153
6.2.1 Interfacial Studies on Liquid-liquid/Liquid-air Interfaces ... 153
6.2.2 Single Molecule DNA Sequencing ... 153
REFERENCES ... 155
APPENDICES ... 178
LIST OF TABLES
LIST OF FIGURES
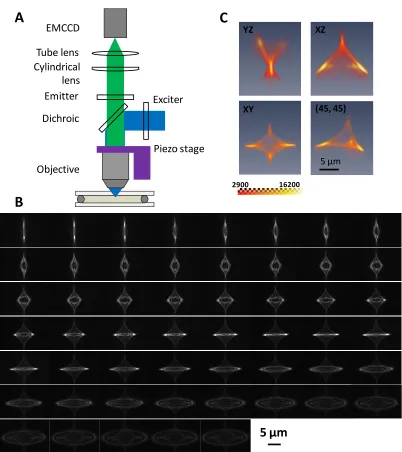
Figure 1.1 Astigmatic imaging for 3D super localization. (A) Schematic of the imaging system. A cylindrical lens is inserted between the objective and the tube lens to generate an astigmatic image pattern for a point object. (B) Image patterns of an immobolized 85 nm particle placed at different z-positions, starting from the particle outside the focal plane toward inside the focal plane. The step size between images was 200 nm. The integration time was 300 ms. The complete calibration set contains 523 images with a step size of 20 nm, a span over 10 µm. (C) The 3D view of the astigmatic point spread function. The last image labeled (45, 45) was looking down with 45º angle from the diagonal of the x- and y -axes. ... 9 Figure 1.2 3D correlation score map shows a spheroidal shape. ... 10 Figure 1.3 Super localization accuracy and precision with astigmatic imaging. (A) z-stepping experiment using a piezoelectric stage. A 200 nm particle was stepped in the z-direction with 100 nm steps. The integration time was 100 ms. 100 measurements were made at each z
position. (B) Variation of 100 super localized xyz positions of particle S relative to particle R. Particle size: 85 nm. Integration time: 30 ms. The localization precision was 15-20 nm for the
Figure 2.6 AFM image and typical line profile of the surface of a thoroughly cleaned Corning coverglass... 35 Figure 2.7 Potential energy surfaces of a trapped particle. (A) PES along the radial direction
R with respect to the attractive center on the glass surface; and (B) PES along the z-direction with respect to the glass surface... 38 Figure 2.8 Z positions of a trapped G85 particle as a function of log[buffer]. The sample was made in a flow cell and phosphate buffer with concentration of 8 µM, 80 µM, 0.8 mM, 8.0 mM and 0.8 mM were flowed in, successively. (A) radius shows a clear trend of decreasing when buffer concentration is increased. (B) shrinking trend of particle distrubution. Brown: 8 µM. Green: 80 µM. Blue: 0.8 mM. Orange: 8.0 mM. ... 40 Figure 2.9 Real time tracking of 85 nm particles moving in the vicinity of the aqueous solution-glass interface. (A) A trapped particle moving from one trapping location into another. (B) A particle transiently retained near the interface for ~0.3 s. (C) A paritcle transiently adsorbed on the interface for ~0.4 s. The green circle highlights the part of the trajectory of interest. ... 45 Figure 2.10 Movement of a freely diffusing and a trapped diffusing 85 nm particles. (A) Square displacement dxy for a freely diffusing particle. (B) Histogram of the z-positions of the freely diffusing particle in the bulk. (C) Square displacement dxy for a trapped diffusing particle. (D) Histogram of the z-positions of the trapped particle. ... 47 Figure 2.11 Estimated potential energy surface between 85 nm polystyrene nanoparticles and glass surface in the presence of 8 mM phosphate using DLVO theory. A: attraction; R: repulsion; P: particle; W: wall; H: gap between particles. ... 54 Figure 2.12 Schematic PES’s of attraction site and glass surface. Each two of the red lines represent the PES of glass surface, and the semi-circles denote the PES of attraction site. Coordinate system is shown in lower right panel. ... 56 Figure 2.13 An example of a particle trapped near the surface for an extended period of time. (A) Scattered particle distribution during a time of 30 s (1000 frames). (B) 2D scatter plot of X-Y. (C) 2D scatter plot of X-Z. (D) Proposed particle-center interaction and particle-surface interaction PES’s corresponding to the same particle. ... 58 Figure 3.1 Three dimensional particle distribution when diffusing in two cylindrical pores sequentially. (a) 3D view. (b) Top view. (c) Side view. (d) The top view of the particle distribution in a thin slice in the z-direction... 65 Figure 3.2 SEM images of longitudinal section of Whatman dia. 200 nm membrane filter. 66 Figure 3.3 Three dimensional particle distribution when diffusing in two cylindrical pores sequentially – Example 2. Viscous solvent. (a) 3D view. (b) Top view. (c) Sideview – along
Figure 3.5 Histograms of individual steps in the z-direction for particle diffusing in free solution. ... 70 Figure 3.6 Axial diffusion coefficients for particles in PEG coated pores. (a) Histograms of particle axial diffusion coefficients obtained from MSD method. (b) Histograms of particle axial diffusion coefficients obtained from individual steps. ... 71 Figure 3.7 Histograms of residence times of partilces in cylindrical pores. (a) Unmodified pores. (b) Unmodified pores with viscous buffer. (c) C18/PEG modified pores. There were numerous events that particles stayed transiently on the membrane surface or went into the pore for a very short distance. Only particles went ~500 nm below the membrane filter surface were counted... 72 Figure 3.8 Lateral distribution(2D histogram) of particle’s locations in 1% C18 modified nanopore. (a) top view. (b) side view. ... 74 Figure 3.9 Schematic of the time that the particle spends inside the proe. The total time can be devided into different segments according to different definitions. In this manuscript, the residence time is defined as the time the particle is in the pore. It can be further devided into: (1) 0
RS
t : the residence time of the particle in the pore in the absence of particle-wall interaction; (2) the withholding time tW, where withholding could happen as either transient immobilization or short range (~ 5nm) retention in the PES wells; and (3) the trapping time
T
t , i.e., the extra time that the particle spends in the pore due to the presence of particle-wall interfaction but not direct withheld by the pore wall. In adsorption and partition chromatography, the void time tM includes both the time the particle outside the pores and
0 RS
t ; the adjusted retention time tS or tR' includes both the withholding time tW and the trapping time tT. ... 77 Figure 3.10 Particle axial diffusion coefficient varies with C18 fraction. (a) Dz changes with C18 concentration. (b) plot of 0
ln( 1)
'
D RT
D vs. fC18. ... 78
Chapter 1 Background and Significance 1.1 Overview of Particle/Molecule-Surface Interactions
There are two interesting phenomena that probably have been observed in every optical lab that is doing single particle/molecule imaging: (1) small particles/molecules slow down significantly when they approach a surface so that they can be viewed or imaged clearly; (2) the samely charged small particles diffuse in loose pairs as if they like each other, which is contrary to the textbook knowledge that like charges repel each other. These indicate that particles/molecules behave differently as in the bulk solution when they are near a surface (or near the surface of another particle). So far, despite of numerous efforts devoted, there are controversies and debates regarding the origins of above phenomena. Understanding these interfacial phenomena is of vital importance to the development of industrial processes including emerging applications in renewable energy, environment protection, and human health.
1.1.1 Importance of Interfacial Studies
Understanding the interfacial phenomena between a liquid and a solid substrate is important to not only fundamental sciences but also emerging applications in renewable energy and human health. Especially of interests are nano-confined environments, e.g., pores, extended tubes, planar channels, etc., where molecules are surrounded by interfaces within a length scale of nanometers. Understanding mass transport, e.g., diffusion, adsorption, and specific binding in these confined environments is an important step for advanced applications in separations, micro- to nano-fabricated tools, heterogeneous catalysis, controlled drug release, enzymatic reactions, and trans-cell membrane biological processes, etc.1-15
1.1.2 Nanoparticles/Molecules Behave Differently on or near Interfaces
Mass transport in confined environments can be significantly different from those in the bulk solution. One prominent phenomenon is that mass transport near interfaces can be extraordinarily slow.16-24 For example, slow diffusion of molecules/nanoparticles has been reported in various porous media in multiple studies.16-24
groups showing that slow diffusion occurs in nanopores with a diameter > 20 nm even to hundreds of nanometers.20-24 These macroscopic phenomena suggest that the interfacial effect can be long-ranged.25 (2) How different is diffusion near interface compared to that in the bulk? The reported difference in diffusion coefficient varies largely in the literature: from just a few times to 4~5 orders of magnitude. (3) What causes this anomaly in nanoconfined environment? Is everything slowing down,16 or because of adsorption events on the interface, or other reasons? Hydrodynamic effect is thought to play an important role in the slowing down, too.
1.1.3 How Nanoparticles/Molecules Interact with Surfaces: Long-range or Short-range Interaction?
The long-range, like-charge attraction problem remains one of the most mysterious problems that stimulated a lot of healthy debating. It is against current dominant theory in colloidal science: the Derjaguin-Landau-Verwey-Overbeek (DLVO) theory.30,31 In DLVO theory, particle-particle or particle-wall interaction can be expressed as the sum of the short-ranged attractive van der Waals interaction and the long-short-ranged, charge-based repulsion. The potential energy of van der Waals attraction between a pair of polystyrene particles (VA, PP) is:32
131 2 2 2 2 2 2
, ) 2 ( 4 ln ) 2 ( 2 4 2
6 H a
aH H a H a aH H a A
VAPP
(1.1)
where A131 is Hamaker constant; the subscript 1 denotes the materials of the particles, which is polystyrene, and 3 denotes the medium, which is aqueous solution; H is the gap between particles; a is the radius of the particles. For polystyrene particle pairs in aqueous solution, Hamaker constant measured from micrometer-sized polystyrene particles is reported to be 0.4~1.3 × 10⁻²⁰ J.27,32 Thus, van der Waals interaction drops to the thermal energy level (3/2kBT) at a distance ~ 1/20~1/10 of the particle size, thus is usually viewed as short ranged. The charge-based repulsion derived from linearized mean field model will never be attractive:33
r r a a Z r u B ) exp( 1 ) exp( ) ( 2 2 (1.2)
as a function of electrolyte concentration. However, it cannot explain the long-range attraction observed experimentally.
The questioning about DLVO theory dates back to 1960s~1980s when charged latex particles show attractions in the long-range and self-assemble in bulk solution.28,29,34,35 Grier and coworkers confirmed this attraction force between the samely charged particle pairs, but only when the particle pairs are near a samely charged wall.33,36 Numerous theories have been proposed and simulation done to explain this phenomenon.37-4344,45 However, there is NOT a satisfactory answer. On the other side, the observation of like-charge attraction is challenged, with studies reporting no such attraction observed,46-48 or suggesting alternative reasons for the observed attraction, e.g., impurity or hydrodynamic interactions, etc.49
1.1.4 Size Matters
1.1.5 Super-resolution Optical Microscopy Provides a New Opportunity
Another main reason that above mentioned fundamental problems are unresolved is because of technical challenges: insufficient spatial and temporal resolutions. For small nanoparticles, conventional optical microscopy does not have the resolution to resolve these “long” distances, which is on the order of magnitude of 10s ~ 100s nm. The advent of
super-resolution optical microscopy, e.g., STORM50,51/PALM52 and STED microscopies,53 gives a new opportunity in this study. Compared to other high-resolution techniques like electron or scanning probe microscopies, optical microscopy allows us to observe dynamic processes in real time and in situ!
1.2 Three-dimensional Super Resolution Microscopy
In order to have a better understanding of the issues mentioned above, we develop a novel astigmatism-based 3D super resolution imaging technique that is ideal to study the “long-range” interaction on flat interfaces and in nanopores.
1.2.1 3D Point Spread Function and Model-based Correlation Imaging
To have the maximal difference of the image patterns along the axial position, we inserted a cylindrical lens with a focal length of 1.0 m between the microscope objective and the tube lens in an epi-fluorescence microscope (Figure 1.1A). Unique diamond-like intensity distributions can be observed at different sample positions in the axial direction (Figure 1.1B). The 3D point spread function (PSF) is shown in Figure 1.1C, which has symmetry similar to D2 point group with one side truncated. Note that the difference between patterns that have a 200 nm axial gap can be visually identified in a total range over 10 µm. When the particle diffused inside the pore, there was little lateral movement. However, we can identify the axial movement of the particle by the changing image pattern. When the particle diffused out of the pore, we can immediately identify the lateral movement of the particle with an expanded particle image pattern.
To quantitatively locate the particle position in the 3D space from the complicated image pattern, we developed a model-based correlation imaging approach.55,56 Specifically, a stack of images for an immobilized particle were collected at different z-positions and served as the calibration set. The particle image to be analyzed was compared with the particle image in the calibration set to find out its x, y, and z-positions. The closest match gave the highest correlation score, which was defined as the Pearson’s correlation coefficient p:
m i sample sample sample model modelmodel i I avg I i I avg
I m model sample p 1 )] ( ) ( [ )] ( ) ( [ 1 1 ) , (
(1.3)where the summation is over all the m pixels in the sample image; I is intensity; avg and σ denote the average and standard deviation of all intensities in the model or the sample,
correlation map was generated by shifting the sample image pixel by pixel, line by line, and frame by frame on the calibration set and a correlation score was calculated at each sample image position (Figure 1.2). The center of a nanoparticle was then computed from the 3D correlation score map by weighting all nearby p values:
m i m i i center Threshold i p Threshold i p X X 1 1 ] ) ( [ ] ) ( [ (1.4)Figure 1.1 Astigmatic imaging for 3D super localization. (A) Schematic of the imaging system. A cylindrical lens is inserted between the objective and the tube lens to generate an astigmatic image pattern for a point object. (B) Image patterns of an immobolized 85 nm particle placed at different z-positions, starting from the particle outside the focal plane toward inside the focal plane. The step size between images was 200 nm. The integration time was 300 ms. The complete calibration set contains 523 images with a step size of 20 nm, a span over 10 µm. (C) The 3D view of the astigmatic point spread function. The last image labeled (45, 45) was looking down with 45º angle from the diagonal of the x- and y -axes.
C
XZ
(45, 45)
2900 16200
YZ
XY
A
B
5 µm
Cylindrical lens Tube lens EMCCD
Objective
Exciter
Piezo stage Dichroic
Emitter
Figure 1.2 3D correlation score map shows a spheroidal shape.
1.2.2 Localization Accuracy and Precision
To quantitatively assess the tracking accuracy and precision, several issues must be addressed: (1) the drifting of the sample or the microscope stage; and (2) the levelness of the sample or the stage. We deem that these are universal issues in high precision measurements.
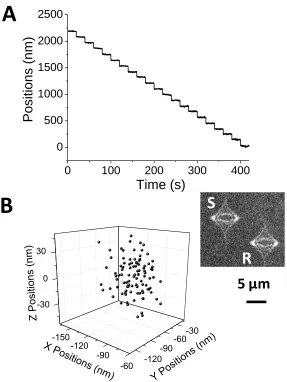
Figure 1.3 Super localization accuracy and precision with astigmatic imaging. (A) z-stepping experiment using a piezoelectric stage. A 200 nm particle was stepped in the z-direction with 100 nm steps. The integration time was 100 ms. 100 measurements were made at each z
position. (B) Variation of 100 super localized xyz positions of particle S relative to particle R. Particle size: 85 nm. Integration time: 30 ms. The localization precision was 15-20 nm for the
xy position, and 20 nm for the z-position, respectively.
We then assessed the localization accuracy by stepping the microscope objective in 100 nm steps. At each z position, 100 frames of images were collected and then analyzed. Figure 1.3A shows the recovered axial position of an immobilized 200 nm particle during the
B
A
-150 -120 -90 -60 -30 0 30 -120 -90-60 -30 Z Posi tions (nm ) Y Posi tions (nm) X Posi tions ( nm)S
R
5 µm
0 100 200 300 400
stepping experiment using a 100 ms integration time. It is clear that the sample (200 nm particles) position changed by ~100 nm in each step with little variation between measurements, which indicates that the localization method is accurate over a large range of
z-distance. Note that we can see glass transformation and stage drifting in the continuous stepping experiment, e.g., the total measured moving distance was 2200 nm for 20 steps as opposed to 2000 nm. However, if we only look at the moving distances between the moving steps, they gave a mean of 102 nm and a standard deviation of 6 nm. This stage drifting contributed ~160 nm movement in the z-direction during a total experimental time ~10 min. Considering the transformation of the thin coverglass (~150 µm) and the following recovery introduced by stepping, we deem this level of drifting is acceptable.
One way to eliminate the effect of the drifting both laterally and axially was to use referenced localization. In addition, using an immobilized particle as the reference also gave the absolute position of the membrane filter surface during the tracking experiment. Figure 1.3B shows 100 repeated measurements of an 85 nm particle S with respect to a reference particle R in the inset of Figure 1.3B. The standard deviations of the relative x, y and z
positions were 15, 20 and 20 nm, respectively, with an integration time of 30 ms for 85 nm particles. In the study, all reported translating particle coordinates were referenced with one or more particles permanently adsorbed on a membrane surface.
Finally, we address the validity of the reference system in the presence of unleveled sample slide. Since neither the microscope objective is absolutely vertical, nor the sample is absolutely horizontal, the relative “levelness” of the samples is defined with respect to the
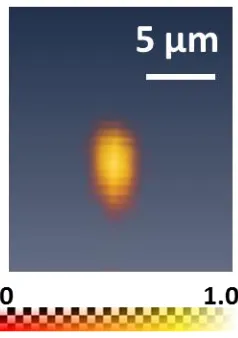
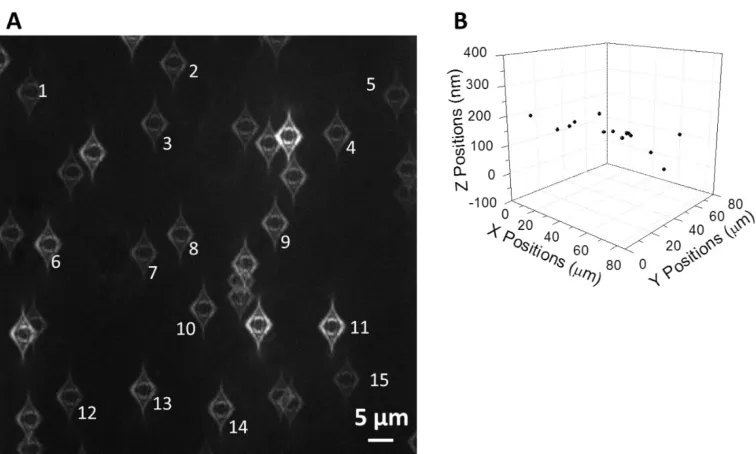
the z-direction for a pair of particles can be visually identified in the eyepiece or on the screen. Thus, we found that we were able to limit the sample slide tilting angle within 2.5 milli rad, i.e, the particles in the whole field of view in the camera (~80 µm across) can have ~200 nm difference in the z-position. Figure 1.4 shows a typical image when the tilting of the sample slide can be visualized. All the particles on the lower-right side have an image pattern with a thinner inside circle, which indicates that the cover glass is tilted that the lower-right corner is farther away from the objective. The x, y and z positions of 15 isolated particles in the same image show the slope across the sample slide to be 2.0 milli rad. Apparently, we were able to achieve better levelness in the experiment. Even with a tilting angle of 2.0 milli rad, the error introduced in the reference system by the tilted sample slide is small, within ~25 nm if we choose the sample and reference particles spacing to be ~10 µm.
1.2.3 Comparison with Other Super Resolution Optical Techniques
There are several advantages of this new method as compared to current existing techniques, such as the mostly used total internal reflection fluorescence (TIRF) microscopy. First, it works in all geometries as long as the sample is transparent. Second, it has a large working distance of 10 µm in the z-direction, while TIRFM only works in ~200 nm. The long working range is crucial to study “long-range” interactions, as will be seen in this study.
Third, using a reference system, the absolute z distance of a particle from the interface can be obtained without knowing the particle intensity (I0) when it is on the surface (z = 0). This is especially important in distinguishing transiently adsorption or diffusion because I0 is unknown in a dynamic experiment. Finally, the localization is pattern recognition-based. Thus, photo-bleaching has little effect on the localization precision but huge effect on intensity-based localization in TIRF.
Methods such as STED and STORM, though have better spatial resolution than our method, take long time to record one image, which fails to see the dynamic information of the studied system. Besides the cost to build a STED or STORM system is much higher, which cannot be afforded by most labs.
1.3 Gold Nanoparticle Luminescence
1.3.1 Origin of Luminescence and Involvement of Surface Plasmon Resonance
sp-band, and intra-band transitions, i.e., electron–hole recombination in sp band. Later, it was reported that in gold nanostructures,58-60 the luminescence is enhanced and cannot be accounted for just considering inter- and intra-band transitions. It was concluded that the luminescence must involve the surface plasmon resonances (SPR), which is the collective oscillation of valence electrons excited by light when the size of the metallic nanostructures becomes comparable to the wavelength of the light.
Currently, there are two mechanisms proposed in the literature regarding how SPR is involved in gold nanoparticle (AuNP) luminescence. In the first mechanism, excitation energy from hot electron-hole pairs is quickly transferred to the plasmon and the radiative decay of the excited plasmon yields luminescence. This mechanism can be loosely viewed as fluorescence resonance energy transfer (FRET) process.61-64 The second mechanism is based on antenna effect of surface plasmons. Here, plasmon does not emit directly but enhances the radiative recombination rate of electron-hole pair by local surface plasmon field.59,60,65,66 As compared to that from the bulk, the luminescence is amplified and shaped to have a profile resembling closely to the SPR spectrum. It is not clear so far which mechanism dominates. 1.3.2 One Photon Excitation and Two Photon Excitation
surface plasmon and the hot electron-hole pairs occurs and the luminescence comes directly from the emission of a surface plasmon. However, the blue spectral component near transverse SPR (TSPR) wavelength is weakly polarized, which suggests that it may have mixed contributions from both the TSPR emission and the inter-band transitions. Above observation was confirmed by Yorulmaz et al.68 In addition, they also systematically studied on the quantum yield of gold nanorods with different aspect ratios and the difference between luminescence and SPR scattering spectra. They found that for short rods, the luminescence is blue-shifted while for the long rods, it is red-shifted. Although the origin of the shifts is unclear, they suggested that the shift may be contributed from non-SPR emissions, i.e., inter-band and/or intra-inter-band luminescence reminiscent of those from the bulk gold.
Photoluminescence of AuNP can also be observed when using two photon excitation. The inherent spatial confinement of two photon luminescence (2PL) along with the brightness and stability offered by gold nanoparticles make it ideal for three-dimensional (3D) imaging and tracking studies.69,70 However, 2PL properties of gold nanoparticles are more complicated and so far inconsistent spectra were reported. For example, Imura et al66 and Bouhelier et al63 independently reported that the 2PL spectra of individual gold nanorods closely resembles corresponding SPR scattering peaks. On the other hand, distinctively different luminescence spectra from individual nanorods have been reported by Wang et al70 and Beversluis et al.60 The intra-band transitions may contribute to the difference in the observed 2PL spectra in the red to IR regions.60
one photon or two photon excitation. In our recent work of building a continuous-wave stimulated emission depletion (CW-STED) microscope that uses 488 nm excitation and 592 nm depletion,71 surprisingly, we observed fairly intense, up converted luminescence from gold nanospheres and short nanorods when they were illuminated by the CW 592 nm laser. These gold nanoparticles were clearly visible in the microscope eyepiece when illuminated by the 592 nm laser, giving a green image with a different shade than the normal down converted luminescence. Continued from this work, in Chapter 4 we investigate the origin of gold nanorod luminescence under multiphoton excitation condition.
1.3.3 Luminescence or Resonant Raman Scattering
be explained by a single photon process rather than a two-photon process, i.e., electronic Raman scattering from single-particle electron-hole pair excitations of the Au or Ag metal that are resonantly enhanced by the surface plasmon.78 The observed quasi-quadratic relationship between the signal and excitation power was explained by a two-temperature model.
1.3.4 Instrumentation
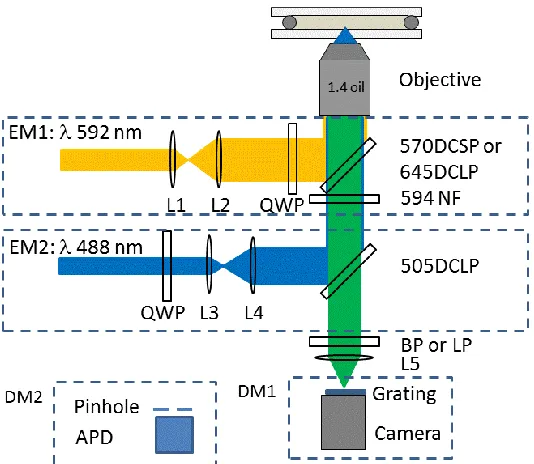
(SPCM-AQRH-15-FC, Perkin Elmer) serving as the detector. Both excitation laser lines were aligned to overlap in all xyz directions so that the same particles can be excited simultaneously/alternatively. The confocal image was acquired by scanning the sample using a piezo-stage (PI Nano, Physik Instrumente) mounted on a manual XY translational stage. The precision of the piezo-stage was 1.0 nm.
For multiphoton excitation study, the setup is very similar. But the excitation wavelength was provided by a femtosecond pulsed Ti-sapphire oscillator (80 MHz, 140 fs, 680-1050 nm, Coherent, Chameleon Ultra II) and varied from 720 nm to 920 nm or wherever the signals are too weak to collect. The laser power at sample was estimated to be ~150 GW/cm2. The emission was collected through a 680 nm shortpass filter. The excitation laser beam was circularly polarized to cancel out the effect of the particle orientation.
1.4 How Light Enhances the Catalytic Activity of Palladium-coated Gold Nanorods 1.4.1 Noble-metal Nanoparticle Catalysts
Compared to their inert bulk counterparts, noble-metal nanoparticles often have superior catalytic properties for a wide variety of organic and inorganic reactions including oxidation, carbon-carbon coupling, electron-transfer, and hydrogenation-dehydrogenation.79 For
example, small clusters of gold are catalytically active but bulk gold is very unreactive. Since
the discovery by Haruta in 1989,80 the research on Au nanoparticle catalysis has increased exponentially. Au nanoparticles supported on Co3O4, Fe2O3, or TiO2 have shown high reactivity and specificity for catalyzing petroleum processing, combustion reactions, CO2 and unsaturated hydrocarbon hydrogenation, and converting hazardous materials into harmless products including CO oxidation, water-gas shift reaction, and NO reduction, etc.81-83
1.4.2 Surface Plasmon Resonance (SPR) – Enhanced Catalytic Activity
At nanometer dimensions, noble-metal particles show special properties associated to surface plasmon resonance, where SPR refers to the optical excitation of the collective oscillations of conductive electrons in metallic lattice. The resonant photons are confined in the nanoparticles in such a manner that: (1) there is a large increase in its electromagnetic field in the near field and consequently, great enhancement of radiative properties including absorption and scattering by the nanoparticles; and (2) the photothermal effect is intrigued by the rapid dephasing of the coherent electron motion and energy transfer to the lattice.
microfluidic channel with a low-power laser source at their SPR wavelength - 532 nm, the conversion of ethanol into CO2, CO, and H2 was expedited.84 Scaiano and co-workers showed that resazurin in the presence of hydroxylamine was reduced to resorufin with great efficiency when the catalyst gold nanoparticles were excited at ~532 nm with a laser or LED source.85 Liu et al showed that by integrating plasmonic Au nanoparticles with TiO2, the photocatalytic splitting of water on TiO2 was increased 66 times under visible illumination close to the plasmon resonance wavelength.86
How the catalytic reactivity is enhanced in the presence of light illumination is still
unclear. A common opinion is to ascribe the increased catalytic reactivity to the photothermal effect, i.e., the reaction is thermally activated at high temperature generated by the noble-metal nanoparticles under plasmon resonance excitation.84,85,87 However, recent studies suggest that the enhanced reactivity may come from the enhanced local electromagnetic field under SPR conditions. For example: for the visible light-enhanced catalytic oxidation reactions on plasmonic silver nanostructures, it was proposed that the surface plasmon polaritons on the silver surface populate O2 antibonding orbitals to form a transient negative ion, which facilitates the rate-limiting O2-dissociation.88 Another example: for the photocatalytic water-splitting under visible illumination at gold SPR wavelength, it was concluded that the increased photocatalytic activity is because of the local electric field enhancement by gold nanoparticles.86
1.4.3 Photothermal Effect or Enhanced Local Electromagnetic Field?
increase the reactivity of surface sites in a delocalized manner, i.e., reactivity of all sites will be enhanced correspondingly. As a comparison, the local electromagnetic field generated by SPR will enhance the reactivity at certain “hot” spots sharply – where local electromagnetic
field can be magnified by 106 ~1014 times as observed in surface enhanced Raman scattering experiments (SERS).89,90 Apparently, a reactivity mapping of gold nanoparticle surface in the absence and in the presence of the SPR illumination will disclose which mechanism is more practical and help us better understand the mechanism of noble-metal nanoparticle catalysis. However, up to date, it is still challenging to differentiate surface active sites that are a few nanometers apart because of technical difficulties.
1.4.4 Palladium-coated Gold Nanorods
Chapter 2 Long-Range Trapping of Single Particles near Liquid-Solid Interface 2.1 Introduction
Molecular transport near a liquid-solid interface, i.e., adsorption/desorption, diffusion and migration, is the key process in both fundamental sciences and many advanced applications such as heterogeneous catalysis, chemical separations, controlled drug delivery and release, biological sensing, intracellular enzymatic reactions, macromolecular machinary, batteries and capacitors etc.25,93-101
Macromolecules and small nanoparticles (<100 nm) show similar transport behavior when they are near liquid-solid interfaces. Their Brownian motion slows down significantly, allowing them to be observed with high signal-to-noise ratio. Frequently, we can observe macromolecules or small particles hovering over a “sticky” region for extended period of time with intermittent pauses, as if they were “adsorbed transiently” on the interface. Movie 2.1 shows one example of an 85 nm carboxylated polystyrene particle diffusing near glass surface at pH 9.0. Such microscopic observation is correlated to macroscopically defined “retention” in chromatography and other interfacial phenomena.
overcome by thermal activities. The “hops” may happen between adsorption sites that are
separated by a distance of molecular length scale,102-104 or over an extended distance during which complete detachment and bulk diffusion of the adsorbates are involved.105 More recently, Schwartz and coworkers further show that two modes of surface diffusion, crawling mode and flying mode classified according to the displacement and time absent from the surface of the adsorbate molecules, co-exist.106 In these views, weak adsorption events are essential to retain the molecules/particles on or near the surface.
In this study, we tracked the 3D trajectory of 85 nm carboxylated polystyrene nanoparticles retained near a negatively charged glass surface. Using astigmatism-based imaging, we are able to localize these particles with a precision of 10~15 nm laterally and 20 nm axially at a frame rate of 30 ms (33 frames per second). Surprisingly, we found that these retained particles are mostly distributed in the solution with a maximum probability of several tens to hundreds of nanometers from the surface during their trapped movements near the surface. This type of retention of small particles distinctively different from the conventional “hopping” model, and may represent a new model of diffusion for nanometer-sized, charged particles “on” a samely charged surface. The long trapping distance extends
well beyond the range of van der Waals interaction, indicating this kind of retention does not fall in current theoretical frames. This observation gives us new insight in macromolecule/small nanoparticle-surface interactions involving various particular objects and surfaces including cell membrane.
2.2.1 Particles Are Remotely Retained by Attractive Site(s) near Surface
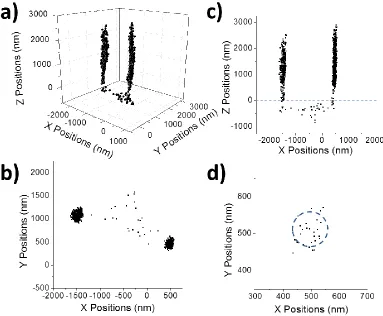
As mentioned earlier, the particles are retained at certain regions near surface. Using conventional optical microscopy, it is difficult to monitor the absolute distance of particles to the surface during retention. In this study, we used astigmatic imaging to track the 3D trajectories of a variety of strongly negatively charged nanoparticles, including 45 ~ 500 nm carboxylated polystyrene particles and 40 ~ 60 nm citrate capped gold nanospheres, diffusing near the aqueous solution – borosilicate glass surface. All of the negatively charged particles show similar behavior. For the sake of conciseness and clarity, we will base our discussion on 85 nm polystyrene particles, whose 3D distribution can be localized 33 frames per second with a ~20 nm resolution in all 3 dimensions.
Movie 2.2 shows an example of an 85 nm particle being trapped near the surface for over 12 s in 8.0 mM phosphate buffer adjusted for pH 9.0. In the tracking, one firmly adsorbed particle was chosen to serve as the reference to eliminate sample/stage drifting effect during the continuous image collection. The absolute 0 position of the z-axis was provided by the reference particle, and a positive z-value corresponded to the particle in the solution. The particle shows active movement in a confined space (1.0 × 1.0 × 0.7 m3) in all xyz
particles were ~12 m apart in this case, contributing a tilting error no more than ± 30 nm to
the particle’s z-position.
Figure 2.2 Center slice (A) and z-histogram (B) of particle I in Figure 2.1. The center slice was cut with a thickness of 100 nm in the x-direction.
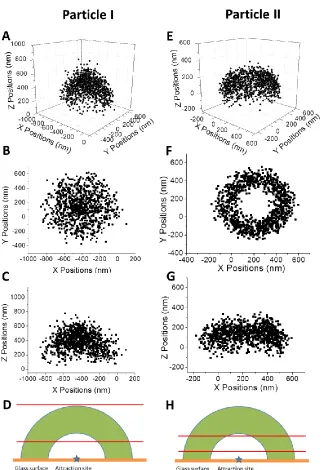
Besides the typical egg-shell-like distributions, there are 3D particle distributions with other shapes. Figure 2.1E-G shows the 3D distribution of another particle – particle II (Movie 2.3). This particle also moves actively in a confined space of 0.8 × 0.8 × 0.4 m3
0 150 300 450 600 750
0 30 60 90 120 150
Cou
nt
s
Z Positions (nm)
-600 -400 -200 0 200 400 600
-200 0 200 400 600 800 1000
Z P
os
itio
ns
(
nm)
Y Positions (nm)
A
above the interface. However, this particle shows a ring-like XY distribution and XZ distribution has its top part narrower than the bottom part: a typical truncated egg-shell with the top of the shell sliced off. This particle stayed ~200 nm above the surface most of the time (Figure 2.3B).
Figure 2.3 Center slice (A) and z-histogram (B) of particle II in Figure 2.1. The center slice was cut with a thickness of 100 nm in the x-direction.
-100 0 100 200 300 400
0 50 100 150 200 250
Cou
nt
s
Z Positions (nm)
-400 -200
0
200
400
-200
0
200
400
600
Z
Posi
tion
s (nm)
Y Positions (nm)
A
More interestingly, we found that in these retention events, the particles are predominantly retained in the solution several tens to hundreds nanometers away from the surface rather than “on” the surface. To keep the analysis consistent, we selected trajectories
from those 39 particles with symmetrical distribution and that the trapping lasted for more than 10 s. For all of those analyzed particles, they have a z-distribution with a most probable
z-distance several tens to several hundred nanometers from the surface. The histogram of the most probable z-distances from the interface for these 25 particles was plotted in Figure 2.5A. Note that the separation distances are “long” as compared to the interaction range of van der Waals force. For example, the van der Waals potential energy between glass surface and a ~85 nm polystyrene particle drops to below thermal energy (kBT) at a gap of 5~10 nm. (For a detailed calculation, please see the Supporting Information).
particles being retained near the surface as none of the 39 particles shows extended staying on the surface or gives a maximum z-probability of, or close to, zero.
We examined carefully that the retention of the particles above the surface is not due to an artifact. The coverglass used in the experiments has a surface roughness (root-mean-square) on the order of magnitude of 1 nm (for an AFM evaluation of thoroughly cleaned coverglass surface, see Figure 2.6). Surface protrusions or holes/grooves with a dimension similar to the trapping distance (~ 100 nm) should be excluded. The coverglass used in the experiments was thoroughly cleaned and examined carefully before and after experiments by dark-field microscopy to exclude the possibility of dirt particles/air bubbles that stick the fluorescent 85 nm particles. It is not caused by light trapping either as the particles are retained even the lights are turned off. Particles being tethered to the surface by floating polymer chains with sticky ends should also be excluded because: (1) the trapping distance changes as a function of ionic strength as we will see in the following discussion; and (2) the trapped phenomenon can also be observed for citrate-capped gold nanoparticles (for example, see Movie 2.4), which possibly indicates that long range trapping is universal for nanometer-sized, strongly charged particles.
Figure 2.6 AFM image and typical line profile of the surface of a thoroughly cleaned Corning coverglass.
2.2.2 Both the Attractive Site and the Surface Influence Particle Distribution.
The hemispherical particle distribution, e.g., Particle I in Figure 2.1, shows that the particle is attracted by an attracting center of the glass surface ~ 400 nm away from the glass surface. Importantly, the interior of the hemisphere is open (Figure 2.2A), indicating that the particle is repelled from approaching the attraction center. Thus, the particle is trapped in a potential energy well around the attraction center, which gives the particle long-range attraction and short-range repulsion on any radial direction from the attraction center. Meanwhile, the particle is excluded ~400 nm away from the surface, indicating that glass surface is also affecting the particle distribution. In this case, the interaction between the surface in whole and the particle is repulsive, which is natural since both the particle and the surface are negatively charged.
Particle II in Figure 2.1 shows a more interesting particle 3D distribution. It is most accurately described by a hemisphere with the top part being sliced off. The interior of the hemisphere is also open (Figure 2.3A), indicating that particle II is also trapped in an potential energy well that is generated by a point center. However, the top of the hemisphere is truncated, indicating the particle is also attracted by a flat surface, which is the glass surface in whole. That is, the particle is also trapped by the potential energy well generated by the glass surface in whole, with a long-range attraction and a short-range repulsion in the
z-direction. Considering the particle distribution with a maximum z-distance of ~200 nm from the surface, this attraction is also long distance as compared to van der Waals interaction.
the attraction site (see details in Supporting Information). Figure 2.1D and Figure 2.1H show the PES of particle I and particle II separately.
Apparently, the particle distribution is determined by both potential energy surfaces of the attraction center and the surface in whole. To characterize the interactions, we calculated the potential energy surfaces from the particle 3D distribution with respect to the attraction center and the glass surface. In calculating the PES generated by the attraction center, we assume that the particle is moving around the attraction site and the glass surface only affects the particle distribution in the z-direction. The probability of observing the particle at a distance R from the attraction center can be estimated from the particle distribution, from which the PES can be calculated (Supporting Information). Similarly, the PES generated by the glass surface can be calculated using the probability of the particle showing up at a distance z from the glass surface. Figure 2.7 shows one example of the calculated PES’s of particle II in Figure 2.1. Both PES wells are deep (>4 kBT), consistent with our observation that the particle is trapped by the surface for long time.
Figure 2.7 Potential energy surfaces of a trapped particle. (A) PES along the radial direction
R with respect to the attractive center on the glass surface; and (B) PES along the z-direction with respect to the glass surface.
cell chamber between a piece of the coverglass and a piece of glass slide separated by spacers. The buffers at different ionic strengths (8 µM, 80 µM, 0.8 mM and 8.0 mM) were flowed through and the trapped particle was imaged at different conditions. As the buffer concentration increases, the most probable R distance shows a trend of decrease (Figures 2.8A). The 3D distribution of the particle shows a shrinking trend both for the radial distribution with respect to the attraction center and the z-distribution with respect to the glass surface as the ionic strength increases (Figure 2.8B). This is consistent with the prediction of Derjaguin-Landau-Verwey-Overbeek (DLVO) theory, as when ionic strength increases Debye length would decrease.
2.2.3 pH Affects the Particle-Surface Interactions
Figure 2.8 Z positions of a trapped G85 particle as a function of log[buffer]. The sample was made in a flow cell and phosphate buffer with concentration of 8 µM, 80 µM, 0.8 mM, 8.0 mM and 0.8 mM were flowed in, successively. (A) radius shows a clear trend of decreasing when buffer concentration is increased. (B) shrinking trend of particle distrubution. Brown: 8 µM. Green: 80 µM. Blue: 0.8 mM. Orange: 8.0 mM.
-200 -100 0 100 200
-100 0 100 200 300 400 500
Z
Posi
tions
(nm
)
X Positions (nm)
-5 -4 -3 -2
100 150 200 250
Rad
iu
s
(
nm)
Log([buffer]/M)
A
2.2.4 Long-range Like-charge Attractions Serving as the Main Tapping Force
What force causes this trapping of the particles? Since weak adsorption does not apply in our case, how the particles are trapped on the interfaces need to be re-examined. Current dominant theory in colloidal science, Derjaguin-Landau-Verwey-Overbeek (DLVO) theory,30,31 predicts that the combined forces from short-ranged attractive van der Waals force and long-ranged repulsive electrostatic force generate a second potential energy minimum at a distance from the attractive site. The second minimum is separated from the first minimum at contact by an energy barrier that is higher than the thermal energy. This theory successfully explains the stability of the colloidal particles as a function of electrolyte concentration. However, it cannot explain the potential energy well over 100 nm from the surface because the van der Waals interaction is too weak to trap the particles (Supporting Information). Thus, particles must be retained near surface by long-range interactions that cannot be explained by DLVO theory.
but only in confined space, e.g., near a samely charged wall.33,36 On the other side, the like-charge attraction is challenged, with studies reporting no such attraction observed,46-48 or suggesting alternative reasons for the observed attractions, e.g., impurity or hydrodynamic interactions, etc.49
Similarly, if the long-range like-charge interaction exists between particle pairs, it should also be true for particle-surface interactions because of the similarity of the two problems. However, there is no consistency in the literature as reports of the existence25 and absence27 of such interactions were both published.
In our study, the interactions were between a negatively particle and an attractive site in the presence of a negatively charge glass wall. To the best of our knowledge, such a long range interaction between a particle and an attractive site has never been published in the
Based on the discussion above, it is reasonable to believe the interaction is caused by a similarly charged center of the surface.
In the literature, various theories and simulation method were proposed to explain the like charge attraction. Essentially, there are two types of views: “big dipole” interaction and “bonding” interaction. The former views the charge center and its ionic atmosphere as a big
dipole, while the latter views the counter ions acting as electron clouds that bond two “nuclei” together. In either view, there are significant amount of counter ions in between that
bridge the particles together. Grier et al. simplified this model by replacing the accumulated charge between the particles as a point charge q and reformulated the potential between two charged particles:40,41
r r a a Zq r r a a Z r
u B B exp( /2)
1 ) exp( 4 ) exp( 1 ) exp( ) ( 2 2 (2.1)
about Equation 2.1 is that the ions in the middle were considered twice. Removal of the exp(-κr) term can immediately lead to excellent fitting. To correct this, we propose to use an empirical κ’ to replace κ:
r r a a Zq r r a a Z r
u B B exp( ' /2)
' 1 ) ' exp( 4 ) ' exp( ' 1 ) ' exp( ) ( 2 2 (2.2)
The physical meaning of κ’ is that the presence of the second particle will effectively reduce the screen effect of the ions to the first particle.
2.2.5 Rugged PES near Surface
Such trapped diffusion events eventually ended with permanent adsorption or flying away. Trapped particles moving from one location to another can also be observed frequently. Movie 2.7 shows one such example that a particle was first trapped at one site for 18 seconds and then flew to another trapping site ~7 µm away. Note that the particle was indeed trapped in the solution rather than on a tilted surface. From time to time, freely diffusing particles near the trapped particle gave image patterns with a flatter center circle, indicating they can move to a position closer to the cover glass. The flying process took ~2 s and then the particle was trapped in the second spot for 13 s in the movie. The 3D trajectory for this particle is plotted in Figure 2.9A.
Trapped diffusion can happen at arbitrary time scale. A lot of times, we observed short time scale trapping events. For example, Movie 2.8 shows a freely diffusing particle being trapped transiently when it moved close to the surface. It started in the solution ~ 1 m from
diffused back into the bulk solution. The 3D trajectory shows that the trapped diffusion happened at ~ 200-400 nm above the surface during a period of 10 frames (Figure 2.9B). Note the trapped diffusion is distinctively different from the reversible adsorption (Movie 2.9 and Figure 2.9C).
Figure 2.9 Real time tracking of 85 nm particles moving in the vicinity of the aqueous solution-glass interface. (A) A trapped particle moving from one trapping location into another. (B) A particle transiently retained near the interface for ~0.3 s. (C) A paritcle transiently adsorbed on the interface for ~0.4 s. The green circle highlights the part of the trajectory of interest.
view of rugged surface in terms of potential energy that traps diffusion particles, which may partly explain the discrepancies in the literature of whether long range interaction exists. 2.2.6 “Trapped Diffusion” as an Important Mechanism for Surface Diffusion and Targeted
Binding
During the trapped diffusion, the particles showed some retardation but still moved actively in a sizable volume. For example, for a 85 nm particle freely diffusing in the bulk
solution confined between the glass slide and the cover glass with a gap of 7.5 m, the mean squared displacement in the xy plane was 3.8 ×10⁻¹³ m2 for each 30-ms frame (Figure 2.10A and Movie 2.10). During a period of ~200 frames, the particle moved wildly and virtually appeared at all z-positions between the glasses (Figure 2.10B). The movement of the freely diffusing particle is consistent with typical bulk diffusion. The apparent diffusion coefficient can be estimated from the mean square displacement according to Einstein-Stokes equation:
nDt
x
2
2
(2.3)where x2 is the mean square displacement; D is the diffusion coefficient; t is time interval; n is number of dimensions. The estimated D was ~ 3.3 × 10⁻¹² m2/s, which is similar to the theoretical value (5.1 × 10⁻¹² m2/s).
Figure 2.10 Movement of a freely diffusing and a trapped diffusing 85 nm particles. (A) Square displacement dxy for a freely diffusing particle. (B) Histogram of the z-positions of the freely diffusing particle in the bulk. (C) Square displacement dxy for a trapped diffusing particle. (D) Histogram of the z-positions of the trapped particle.
2.2.7 Implication for the Novelty of the Discovery
This trapped diffusion of particles near surface discloses a new mechanism of how nano-particular objects interact with a surface.
trapping rather than adsorption), and a plausible interpretation why it is retained (i.e., through long-range attractive interaction between like charges), are given. Such a fundamental understanding of this important phenomenon has not been in the literature.
Second, it discloses the movement of the retained particles. Macroscopically slow but microscopically fast. This is important to targeted binding on the solid surface. The potential energy minimum tens to hundreds of nm away from the surface practically provides a buffer zone so that the particle is temporarily retained near the surface with considerable mobility. It is imaginable that this potential energy well can enhance the probability of targeted binding. First, it pre-concentrates the analytes to a much smaller volume near the surface. Second, the analytes still have significant mobility that it can actively search the binding sites within a considerable area (~1 m2) on the surface. Such an approach is more efficient than random
diffusion-based binding especially when the guest particle concentration or the surface receptor density is low.
Third, it discloses that the surface is heterogeneous. There are multiple attractive sites
that “trap” nanoparticles near surface through long-range interactions. In our study, the
particles are interacting with the surface through a lot of attractive sites over a long-range. Our conclusion is that the surface is heterogeneous (containing multiple attraction sites) and the potential energy surface of the surface is more rugged (strong and weak sites).


![Figure 2.8 Z positions of a trapped G85 particle as a function of log[buffer]. The sample was made in a flow cell and phosphate buffer with concentration of 8 µM, 80 µM, 0.8 mM, 8.0 mM and 0.8 mM were flowed in, successively](https://thumb-us.123doks.com/thumbv2/123dok_us/1706749.1216748/60.612.125.393.83.553/figure-positions-trapped-particle-function-phosphate-concentration-successively.webp)