Copyright1999 by the Genetics Society of America
Bioinvasions of the Medfly
Ceratitis capitata: Source Estimation Using DNA
Sequences at Multiple Intron Loci
Neil Davies,*
,†Francis X. Villablanca*
,‡and George K. Roderick*
,†*Center for Conservation Research and Training, University of Hawaii, Honolulu, Hawaii 96822,†Department of Environmental Science, Policy and Management, University of California, Berkeley, California 94720-3112 and‡Department of Biological Science,
California Polytechnic State University, San Luis Obispo, California 93407 Manuscript received February 17, 1999
Accepted for publication June 1, 1999
ABSTRACT
The Mediterranean fruit fly, Ceratitis capitata, is a devastating agricultural pest that threatens to become established in vulnerable areas such as California and Florida. Considerable controversy surrounds the status of Californian medfly infestations: Do they represent repeated introductions or the persistence of a resident population? Attempts to resolve this question using traditional population genetic markers and statistical methods are problematic because the most likely source populations in Latin America were themselves only recently colonized and are genetically very similar. Here, significant population structure among several New World medfly populations is demonstrated through the analysis of DNA sequence variation at four intron loci. Surprisingly, in these newly founded populations, estimates of population structure increase when measures of subdivision take into account the relatedness of alleles as well as their frequency. A nonequilibrium, likelihood-based statistical test that utilizes multilocus genotypes suggests that the sole medfly captured in California during 1996 was introduced from Latin America and was less likely to be a remnant of an ancestral Californian population. Many bioinvasions are hierarchical in nature, consisting of several sequential or overlapping invasion events, the totality of which can be termed a metainvasion. Phylogenetic data from multilocus DNA sequences will be vital to understanding the evolu-tionary and ecological processes that underlie metainvasions and to resolving their constituent levels.
B
IOINVASIONS, especially those involving exotic tion has required the development of novel geneticmarkers and statistical analyses (reviewed byDavieset
insect pests, have been an undesirable element of
U.S. and world agriculture for more than a century al. 1999). We apply these new techniques to the medfly Ceratitis capitata; in particular, can these approaches
dis-(Elton 1958; Frank and McCoy 1991; Metcalf
1995b). Despite the substantial economic impact of bio- tinguish alternative hypotheses concerning the source of medfly infestations in California?
invasions (U.S.CongressOTA 1993), management
pol-icy remains largely reactive because it is extremely diffi- The medfly is arguably the world’s most threatening agricultural pest, attacking over 200 different fruits, veg-cult to predict which species will invade, when they will
do so, and what the ecological consequences will be etables, and nuts (Carey 1991; Sheppard et al. 1992;
(Lawton and Brown 1986; Daehler and Strong McPheron et al. 1994). From their likely origin in
Af-1993;Lodge 1993; New 1995; Kareiva 1996; Davies rica, medflies spread rapidly around the world (Figure andRoderick1999). Nearly all attempts at eradication 1). They were first reported from California in 1975 or control (sterile insect release, biological control, the (for a review see Metcalf 1995a) and sporadic out-use of transgenic plants) require the determination of breaks have occurred ever since (Figure 2); it has been invasion sources and demographic parameters, such as suggested that California may have had a resident popu-population size, structure, and rate of growth. For exam- lation for up to 50 yr at a size below the level of detection ple, very different management measures are required (Carey 1991). The economic risk associated with the when invasions involve a pest species with panmictic medfly is considerable: an endemic infestation in Cali-population structure compared to those that involve a fornia might cost in excess of $1 billion per annum species with sharply defined and genetically isolated (Siebert1994) and over $350 million has already been populations (Carey1991). Here we address the funda- spent trying to prevent such an outcome (Metcalf mental issue of how to determine the source of a bioinva- 1995b).
sion. Answering this apparently straightforward ques- The history of medfly invasions in California has been reviewed recently by several authors (McPheronet al.
1995;Roderick1996b;Gasparichet al. 1997;Haymer
Corresponding author: Neil Davies, Division of Insect Biology, Depart- et al. 1997) but the origin(s) of these infestations remain ment of Environmental Sciences, Policy and Management, 201
Well-uncertain and controversial. Early work focused on
man Hall, University of California, Berkeley, CA 94720-3112.
E-mail: [email protected] mtDNA, but the many advantages of mtDNA over
Figure1.—The biogeography of the medfly invasion.
clear loci (Moore1995;Roderick1996a) may not apply to medfly invasions (Roderick et al. 1998). First,
medflies exhibit lekking behavior, an extreme form of mating bias that reduces the effective population size of nuclear loci to levels similar to those of mtDNA (Hoelzer 1997). Second, restriction fragment length polymorphism (RFLP) analysis of mtDNA reveals low levels of genetic variation in New World populations, and medflies caught in Southern California prior to 1992 share a single mtDNA haplotype that is common throughout Central America and some other parts of the world (Sheppardet al. 1992;McPheronet al. 1994,
1995;Stecket al. 1996;Gasparichet al. 1997). Clearly,
the precise identification of origins is impossible on the basis of these mtDNA data alone, and the single vs. multiple origin of Californian medflies remains unre-solved (Gasparichet al. 1997).
Allozymes are variable in Mediterranean and African populations, but less so in populations outside of Africa (Gasperiet al. 1991;Malacridaet al. 1992;Baruffiet al. 1995). Fortunately, it is now possible to assess DNA
variation directly, and high levels of diversity have been documented among invading medfly populations using several DNA-based nuclear markers, including micro-satellites (B. McPheronandD. Prasher,personal com-munication), randomly amplified polymorphic DNA (RAPDs;Haymer et al. 1997), and introns (Gomulski
Figure2.—Chronology of recent medfly infestations in
Cali-et al. 1998; Villablancaet al. 1998). Villablanca et
fornia. Shaded regions are counties in which medflies have been
al. (1998) demonstrated that significantly more diversity
trapped, prompting control programs. For more
informa-tion see http://www.cdfa.ca.gov/pests/medfly/mediterranean is retained in invading populations at intron loci than
fly.html. is retained at mitochondrial or allozyme loci. The
polymerase (5 units/ml), and 1ml of genomic DNA.
Thermo-markers offers the possibility that potential sources
cycler parameters were 948for 30 sec, 558for 30 sec, and 728
might be resolved on a relatively fine geographic scale.
for 40 sec, repeated for 40 cycles. Parameters for Sod were 948
Here we examine variation at the four intron loci se- for 30 sec, 608for 1 min, and 728for 1.5 min for 40 cycles. quenced by Villablanca et al. (1998) to investigate As the PCR products in any reaction may include two alleles
from the target locus, amplifications were cloned to isolate a
whether these markers can distinguish invading medfly
single allele for sequencing. Following cloning,
double-populations in Central America and eastern South
stranded DNA was prepared for sequencing using
Quan-America, i.e., those that mtDNA studies indicate as the
tumPrep (Bio-Rad Laboratories, Hercules, CA) following the
most likely source of Californian medflies (Gasparich manufacturer’s guidelines. Sequences were obtained using an
et al. 1997). ABI 377 automated sequencer. Because of the large amount of sequencing that must be performed to recognize
heterozy-Three important questions are addressed by the
cur-gotes, we sequenced a single allele for most individuals.
rent study: First, does sequence variation at intron loci
Cloned PCR products may contain errors incorporated by
reveal significant population structure? Second, how do
DNA polymerases (Pa¨a¨boandWilson1988), and thus
differ-frequency and distance-based approaches compare in ent clones from the same PCR reaction are expected to differ their estimation of population subdivision? Finally, can byz1:1000 bases due to Taq polymerase copying errors. We sought to reduce this source of error by ignoring singletons,
we utilize genetic population structure to determine the
which are nucleotide positions that vary in only one allele
origin of a recent medfly outbreak in California? For
(sensuVillablancaet al. 1998).
the last question, we focus on the single fly (B-96) cap- Phylogenetic analysis:Phylogeography is a powerful means tured at Burbank, California, in 1996. Using a statistical of investigating the history of populations (Avise1994); how-test that assigns multilocus genotypes to potential source ever, phylogenetic analysis can be complicated for nuclear genes because of recombination (BegunandAquadro1992;
populations based on the frequency of alleles in those
Hudson1994) and the persistence of ancestral alleles (
Tem-sources (Rannala and Mountain 1997), we ask
pletonand Sing1993).Templeton et al. (1992) and
Tem-whether this fly was recently introduced to California, pletonandSing(1993) provided a means for recognizing or whether it represents a remnant of a previous infesta- and dealing with alleles produced by recombination. In effect,
the method focuses phylogenetic reconstruction on the most
tion. The results have direct consequences for medfly
recent substitutions before attempting to resolve deeper
management strategy: either more effort must be
di-nodes. Assuming that more recent changes are less likely to
rected toward eradication or interception policies
include homoplasy or recombination, sequences separated by
should be focused on the most common source, if it one substitution are linked first, and the resulting groups form
can be identified. the basis for linking alleles separated by two substitutions, and
so on. Details of the method are provided byTempleton
(1998) andTempletonandSing(1993).
MATERIALS AND METHODS Population analysis and assignment test:Population struc-ture was determined through the analysis of molecular
varia-Collections and laboratory analysis:Figure 1 details the re- tion (AMOVA) method ofExcoffieret al. (1992) as
imple-cent spread of medflies from their ancestral range in sub- mented by the computer program ARLEQUIN 1.1 (Schneider Saharan Africa (Hardy and Delfinado 1980; White and et al. 1997). Indices of population subdivision analogous to
Elson-Harris1992;McPheronet al. 1995;Metcalf1995a; standard F-statistics (Wright1951, 1965) are calculated for
Foote1997). Medfly samples were obtained from populations each locus and their significance assessed using permutation in California, Costa Rica, Guatemala, Mexico, Brazil, Peru, procedures that randomly redistribute individuals among pop-Greece, Hawaii, and Africa (Table 1). The Californian ulations. For each locus, this general approach was used to medflies were all collected in southern California between estimate two F-statistics,uandF.uis based on allele frequen-1992 and 1996 (Figure 2). No medflies were found in 1995 cies only (WeirandCockerham1984; seeExcoffieret al. and only a single individual (B-96) was captured during 1996. 1992), whileF also takes into account the genetic distance We treat all these Californian medflies as a single population among alleles (Excoffieret al. 1992), in this case the average for the purposes of statistical analysis. Under the null hypothe- Kimura 2-parameter distance.
sis that there is a resident medfly population in California, The computer program TFPGA (Miller1998) was used to we assume that these flies, captured in the same geographic calculate the averageu(WeirandCockerham1984) across area, represent a single biological population (Carey1991). all loci on the basis of allele frequencies. The averageFacross Extraction protocols and some of the sequences (from Cali- loci,FAMOVA, was the mean ofF values for the four loci, and fornia, Brazil, Malawi, Hawaii, and Greece) have been pub- its significance was assessed following Fisher’s method for com-lished previously (seeVillablancaet al. 1998). Briefly, DNA bining probabilities (seeSokalandRohlf1995). Population was isolated using a phenol-chloroform extraction and ethanol differentiation averaged over loci was also examined using the precipitation. Exon-primed, intron crossing (EPIC) primers exact test (RaymondandRousset1995) as implemented by (PalumbiandBaker1994;Palumbi1996) were constructed TFPGA (Miller1998). Again, both frequency and distance-to amplify introns from within four different nuclear loci: the based approaches were used. Exact tests were performed on first intron of Cu/Zn superoxide dismutase (Sod), muscle- the basis of the distribution among populations of (i) alleles specific actin (Actin), vitellogenin 1 gamma intron 2 (Vg), and and (ii) phylogenetically derived allele groups, or clades. In first chorion intron s36 (Chorion). Amplification and cloning the latter case, alleles in the same one-step clade of the Tem-were as inVillablancaet al. (1998) with the following modi- pleton networks were pooled. TFPGA was then used to calcu-fications. PCR conditions, previously optimized for the Perkin- late the averageuTempleton(WeirandCockerham1984) across Elmer (PE; Norwalk, CT) 480 thermocycler, were adjusted for all loci on the basis of allele frequencies and then across all use with the PE 9600 and 9700. Reactions consisted of 30ml loci on the basis of the one-step allele groups. Significance of water, 5ml 8 mmdNTPs, 5ml 103PE Taq buffer, 2.4ml of both statistics was assessed through 10,000 bootstrap
To determine the origin of the B-96 medfly,Rannalaand 2). For Latin American populations, onlyuanduTempleton
Mountain’s (1997) assignment test (seeDavieset al. 1999) were significant, and againu
Templetonwas twice as large as was employed using their computer program IMMANC u
. AMOVA utilizes the same statistical framework and
(http://allele.bio.sunysb.edu/). Assuming that loci are
inde-we present a comparison of locus by locusuandFAMOVA pendent, the likelihoods of drawing a test multilocus genotype
from a resident and from a potential source population are in Table 3. Consistent with the across-loci results,FAMOVA calculated. The difference in likelihood (lnl) is negative if is always.ufor all American populations but there is an individual is more likely to be an immigrant than a resident. no clear pattern when only Latin America populations Monte Carlo simulations are used to assess significance:
ran-are considered. In all cases, Chorion and Vg revealed the
dom genotypes are generated from allele frequency
distribu-most population differentiation.
tions conditioned on the observed allele frequencies (the
vari-ance of these distributions decreases with increasing sample The likelihood of drawing the B-96 fly from the
Cali-size). The probability of obtaining the observed value is as- fornian population was compared to the likelihood that sessed by comparison with the distribution of random values. it was an immigrant from a Latin American population Because the B-96 genotype was included in the Californian
(Table 4). Whether B-96 was more like an immigrant
population (and not the potential source) when estimating
than one would expect by chance was determined
the “resident” allele frequencies, the test is conservative with
respect to the null hypothesis that B-96 is a resident—in this through comparison of the observed lnlvalues with the
case of California (Davieset al. 1999). Currently, IMMANC lnlof 1000 multilocus genotypes randomly generated accepts only diploid data and we therefore analyzed our data from the Californian population. Despite the conserva-(which included only one of the two alleles possessed by each
tive nature of the test, Table 4 shows that the B-96
individual at each locus) by assuming that all (unobserved)
genotype was less likely (a ,0.05) to be a resident of
genotypes were homozygotes. Although this modification does
not alter the observed allele frequencies, it does artificially California than an immigrant from no less than four
reduce their variance in the simulation analysis, making the potential sources: Costa Rica, Guatemala, Mexico, or interpretation of significance values problematic. The geno- Peru. While the need to assume homozygosity in our type probabilities calculated in this way are only approximate
data makes the interpretation of significance values
dif-and the approximation will work best when the frequencies
ficult, the ancestral Californian population we sampled
of the sampled alleles are high (i.e., when genotypes have a
high probability of being homozygous). seems unlikely, according to this analysis, to be the source of the B-96 medfly. To assess which of the four Latin American populations was the most likely source,
RESULTS
we conducted further assignment tests. B-96 was as-sumed to be a resident of Costa Rica, Guatemala, Mex-A total of 237 medfly sequences were obtained for
four intron loci in 74 individuals (Table 1). Not every ico, and Peru, in turn. This null hypothesis was only rejected in one case: B-96 is more likely to be an immi-individual was sequenced for all four loci due to
prob-lems in obtaining PCR amplification, which were proba- grant from Costa Rica than a resident of Peru (a , 0.05). However, a Bonferroni correction for multiple bly due to the degraded state of some specimens. After
a correction for errors associated with cloning PCR comparisons would render this result insignificant. products (see above), 68 Actin sequences consisting of
293 bp revealed 19 alleles distinguished by 12
polymor-DISCUSSION
phic sites. Fifty-seven Chorion sequences consisting of
394 bp revealed 18 alleles distinguished by 14 polymor- Contemporary bioinvasions, such as those of the medfly, are often characterized by a unique set of demo-phic sites. Sixty Sod sequences consisting of 812 bp
re-vealed 38 alleles distinguished by 56 polymorphic sites graphic and genetic features that result from a small number of colonizing individuals and the rapid growth including four insertion or deletion events. Fifty-two
Vg sequences consisting of 409 bp revealed 32 alleles and spread of new populations. Together these charac-teristics make it difficult to determine the source of distinguished by 24 polymorphic sites including eight
indels. The phylogenetic relationships of the alleles are bioinvasions, partly because it is hard to distinguish po-tential source populations that were only recently estab-shown for each locus in Figure 3. No striking
phylogeo-graphic structure was evident from visual inspection of lished themselves (Davieset al. 1999). In this study, we
investigated sequence variation at nuclear intron loci the networks, suggesting that the distribution of alleles
represents the random sorting of ancestral polymor- to see if these markers could reveal population struc-ture, and whether they could be used to determine the phism.
Statistical analysis revealed substantial population origin of a recent medfly “outbreak.” Genetic analysis of DNA sequence variation at four intron loci, Sod, Vg, structure among American medfly populations (Latin
America plus California) and among Latin American Actin, and Chorion, revealed significant population
struc-ture among previously indistinguishable medfly popula-populations only (excluding California). For American
populations, both frequency and distance-based F-statis- tions (Gasparich et al. 1997) in California, Central
America, and eastern South America. Much of the subdi-tics were significant when combined across loci with
the distance-based estimates,FAMOVAanduTempleton, being vision was due to the Californian population, although
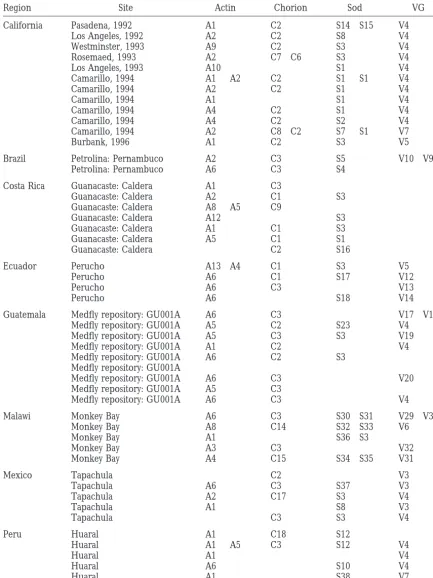
TABLE 1
Collection data
Region Site Actin Chorion Sod VG
California Pasadena, 1992 A1 C2 S14 S15 V4
Los Angeles, 1992 A2 C2 S8 V4
Westminster, 1993 A9 C2 S3 V4
Rosemaed, 1993 A2 C7 C6 S3 V4
Los Angeles, 1993 A10 S1 V4
Camarillo, 1994 A1 A2 C2 S1 S1 V4
Camarillo, 1994 A2 C2 S1 V4
Camarillo, 1994 A1 S1 V4
Camarillo, 1994 A4 C2 S1 V4
Camarillo, 1994 A4 C2 S2 V4
Camarillo, 1994 A2 C8 C2 S7 S1 V7
Burbank, 1996 A1 C2 S3 V5
Brazil Petrolina: Pernambuco A2 C3 S5 V10 V9
Petrolina: Pernambuco A6 C3 S4
Costa Rica Guanacaste: Caldera A1 C3
Guanacaste: Caldera A2 C1 S3
Guanacaste: Caldera A8 A5 C9
Guanacaste: Caldera A12 S3
Guanacaste: Caldera A1 C1 S3
Guanacaste: Caldera A5 C1 S1
Guanacaste: Caldera C2 S16
Ecuador Perucho A13 A4 C1 S3 V5
Perucho A6 C1 S17 V12
Perucho A6 C3 V13
Perucho A6 S18 V14
Guatemala Medfly repository: GU001A A6 C3 V17 V18
Medfly repository: GU001A A5 C2 S23 V4
Medfly repository: GU001A A5 C3 S3 V19
Medfly repository: GU001A A1 C2 V4
Medfly repository: GU001A A6 C2 S3
Medfly repository: GU001A
Medfly repository: GU001A A6 C3 V20
Medfly repository: GU001A A5 C3
Medfly repository: GU001A A6 C3 V4
Malawi Monkey Bay A6 C3 S30 S31 V29 V30
Monkey Bay A8 C14 S32 S33 V6
Monkey Bay A1 S36 S3
Monkey Bay A3 C3 V32
Monkey Bay A4 C15 S34 S35 V31
Mexico Tapachula C2 V3
Tapachula A6 C3 S37 V3
Tapachula A2 C17 S3 V4
Tapachula A1 S8 V3
Tapachula C3 S3 V4
Peru Huaral A1 C18 S12
Huaral A1 A5 C3 S12 V4
Huaral A1 V4
Huaral A6 S10 V4
Huaral A1 S38 V7
TABLE 1
(Continued)
Region Site Actin Chorion Sod VG
Kenya Nairobi A2 C3 S10 V2
Nairobi A3 S11 V6
Nairobi A14 A2 C4 S25 V2
Nairobi A7 C6 S26
Nairobi A7 C12 S27 V23
Nairobi A15 A16 C1 V24
Nairobi A7 C13 S11 V25
Nairobi A4 C6 S28 V26
Nairobi A17 C2 V27
Nairobi A18 C1 S29 V28
Hawaii Maui A19 A6 C10 C16 S6
Hawaii A4 A6 C11 S9 V22
Hawaii A2 C3 C2 S24 S6 V21
Greece Chios A2 C3 S20 S21 V15
Southern Peloponnese A2 C3 S22 S19 V16
American populations were treated alone. The ability a frequency of z1% (Lathrop et al. 1983). One can
attempt to correct for scoring mistakes prior to analysis, to discern differences among populations is a
prerequi-site for attempts to determine the origin of invading as we did for the errors associated with sequencing cloned PCR products. Alternatively, an error rate factor individuals, and intron variation appears to provide
enough resolution to distinguish the source of very re- can be incorporated into the analysis; such an approach was used byMarshallet al. (1998) in their multilocus
cent bioinvasions. An assignment test (Rannala and
Mountain1997) was applied to the single medfly cap- paternity test. A second source of error that should be considered is the implications of not sampling all the tured in California (at Burbank, Los Angeles County)
during 1996. The results suggested that the multilocus potential sources. Again with a focus on paternity test-ing, Marshall et al. (1998) presented a simulation
genotype of this fly was unlikely to have arisen from the
ancestral Californian population that we sampled; it was method to assess the likelihood that a more probable source remains unsampled. Finally, assignment tests fo-more likely introduced from Latin America. There was
less ability to distinguish sources within Latin America, cus on the origin of single multilocus genotypes, and we have applied such a test to a bioinvasion consisting although the demonstration of significant population
structure indicates that additional intron data is likely of a solitary fly. More often, however, bioinvasions con-sist of many invading individuals, each of which will to further reduce the number of potential sources.
Multilocus genotyping is clearly a powerful technique have its own associated likelihood of being from one source or another. With such multiple assignments, one and many different markers, including allozymes,
mtDNA, and microsatellites can be analyzed simultane- will be able to plot a distribution of likelihood statistics for the invading population as a whole, adding a new ously following the statistical methodology outlined
here (see also Davieset al. 1999). In most cases addi- level of complexity to source estimation. For example, a bimodal distribution would imply that the invading tional markers will increase the power of these tests,
although some markers may be incompatible with this population had two sources, but how can one assess the significance of such a conclusion, and how should one approach. RAPDs, for example, are very useful in
provid-ing high levels of genetic variation and their main advan- correct for multiple comparisons? We are currently ex-amining these issues with respect to some large medfly tage over introns and microsatellites is that they can be
applied with very little prior genetic knowledge of a infestations in California that have occurred since 1996. The final purpose of our investigation was to explore species (Williamset al. 1990). Unfortunately, it is not
clear how RAPD data can be incorporated into the same and compare the utility of frequency- and distance-based approaches in the study of invading populations. statistical framework as introns and other markers,
where genotypes can be identified at each locus. Phylogeographic structure (Avise 1989, 1994;
Roder-ickand Villablanca1996; Roderick andGillespie
RannalaandMountain’s (1997) assignment test
ap-plies statistical rigor to source estimation; however, fur- 1998) is not expected in recently founded populations because there has been little time for mutations to oc-ther modifications of the test are desirable. First,
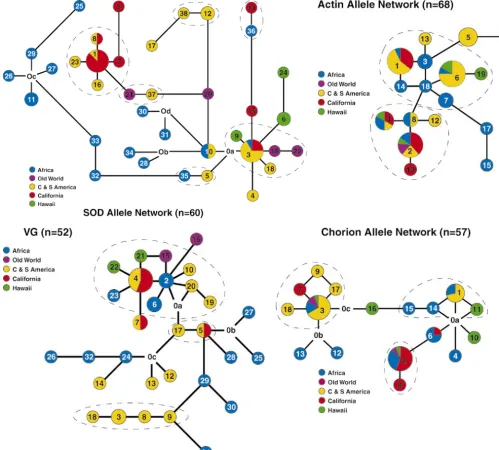
Figure3.—The haplotype networks as estimated by the method described by Templeton(1998) for a, Sod; b, Actin; c, Vg; and d, Chorion. Haplotype identities are noted within circles by a number and distances between haplotypes are proportional to the number of base pair differences between haplotypes. The size of the circles is proportional to the number of individuals sharing a particular haplotype. Haplotypes marked Ox are inferred haplotypes identified by parsimony. Dashed lines denote single-step clades (see text).
TABLE 2
F-statistics and exact tests for population differentiation over all loci
Frequency Distance
Region u Exact FAMOVA FTempleton ExactTempleton
Latin America 0.16** ,0.0001 0.27* 0.24** ,0.0001
and California
Latin only 0.08** ,0.01 0.10NS 0.16** ,0.01
TABLE 3 population structure among American medflies, but yielded larger F-statistics than those based on allele fre-Results of AMOVA for each locus
quencies alone. Various approaches have been devel-oped that utilize phylogenetic data to detect gene flow
Region Locus u F
(Slatkin 1994), yet current assignment tests do not
Latin America Actin 0.092 0.118 consider the relatedness of alleles. Commonly used
and California
multilocus markers such as microsatellites (Glenn
Chorion 0.321 0.421
1998) do not easily permit the phylogenetic analysis of
Sod 0.083 0.174
alleles; however, when sequence data are available, our
Vitellogenin 0.144 0.360
data suggest that frequency-based assignment tests
Latin only Actin 0.067 0.067
might waste useful information. A new test should assess
Chorion 0.086 0.005
the multilocus likelihood of sampling a given set of
Sod 0.071 0.033
alleles from a potential source population on the basis of
Vitellogenin 0.103 0.285
the distance between alleles as well as their frequencies.
Auis an F-statistic based on allele frequencies whileF is Interestingly, the inclusion of California increased based on the genetic distance among alleles.
distance- as well as frequency-based estimates of popula-tion subdivision. Californian medfly populapopula-tions are the most recent, so founder events have not eroded phylo-rather than their history in newly occupied areas (
Villa-geographic signal; indeed they appear to have enhanced blanca et al. 1998; Davieset al. 1999). For example,
it. The average relatedness of alleles in derived popula-McGuiganet al. (1998) reported significant differences
tions might be increased simply by sampling from a in haplotype frequencies over a fine geographic scale
single, phylogenetically heterogeneous population. Di-among Australian frog populations; however, a smaller
versity within a species could be converted into diver-and insignificant F-statistic was obtained when the
ge-gence between populations when the species becomes netic distance among alleles was considered as well.
fragmented because founder events sample only a small McGuigan et al. (1998) suggested that the barriers to
proportion of the ancestral variation and tend to in-gene flow had not been in place long enough to
influ-clude alleles of the dominant phylogenetic clade. Phylo-ence the distribution of genetic relatedness. We
ex-geographic structure among recently founded popula-pected American medflies to show a similar pattern;
tions might also occur if each derived population was however, the opposite was true: distance estimates of
founded from a different population of a phylogeo-population subdivision not only revealed significant
graphically structured source.
More work is clearly needed to explore the phyloge-netic consequences of invasions and a better under-TABLE 4
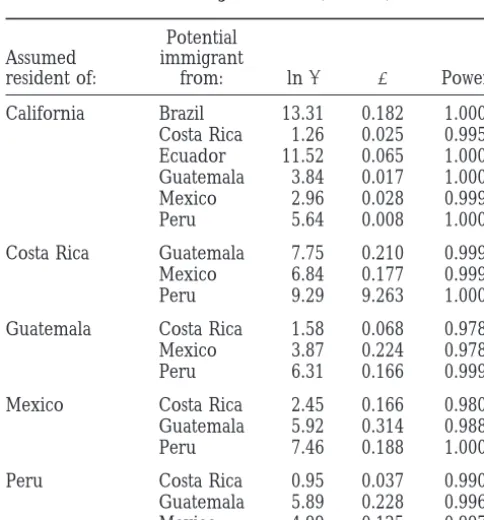
standing of invasion genetic patterns will provide a Results of assignment test (see text)
deeper insight into the ecological and evolutionary pro-cesses that underlie bioinvasions. It is important to
con-Potential
sider in such studies that invasions often involve a
hierar-Assumed immigrant
chy of events, the totality of which might be termed a
resident of: from: lnl a Power
metainvasion. The metainvasion begins with a primary
California Brazil 13.31 0.182 1.000
invasion, when a species first colonizes a new area from
Costa Rica 1.26 0.025 0.995
its ancestral source. Subsequently, secondary and
ter-Ecuador 11.52 0.065 1.000
tiary invasions arise as the newly established populations
Guatemala 3.84 0.017 1.000
Mexico 2.96 0.028 0.999 themselves seed new areas. The genetic changes that
Peru 5.64 0.008 1.000 result from these events are complex and phylogenetic analyses may be informative at some levels but not
oth-Costa Rica Guatemala 7.75 0.210 0.999
ers. A primary invasion of the medfly occurred from
Mexico 6.84 0.177 0.999
Peru 9.29 9.263 1.000 Africa to the Mediterranean. The invasion of Latin
America may be another primary invasion, direct from
Guatemala Costa Rica 1.58 0.068 0.978
Africa, or a secondary invasion from the Mediterranean.
Mexico 3.87 0.224 0.978
Californian medfly infestations thus represent
second-Peru 6.31 0.166 0.999
ary or tertiary events in the global medfly metainvasion.
Mexico Costa Rica 2.45 0.166 0.980
Indeed, California may be subject to repeat invasions
Guatemala 5.92 0.314 0.988
that could superimpose one another. The phylogeny of
Peru 7.46 0.188 1.000
alleles as well as their frequencies in each population
Peru Costa Rica 0.95 0.037 0.990 may need to be considered to unravel the history of
Guatemala 5.89 0.228 0.996
the global medfly metainvasion and to distinguish its
Mexico 4.99 0.125 0.997
colonized regions may arise as a second-hand signal LITERATURE CITED
resulting from multiple introductions or be due to the Avise, J. C.,1989 Gene trees and organismal histories: a
phyloge-netic approach to population biology. Evolution 43: 1192–1208.
combination of different levels of the metainvasion—as
Avise, J. C.,1994 Molecular Markers, Natural History, and Evolution.
here we combined California with Latin America.
Chapman and Hall, London.
Whether the source (most probably in Africa) or sources Baruffi, L., G. Damiani, C. R. Guglielmino, C. Mandi, A. R.
Mala-cridaet al., 1995 Polymorphism within and between
popula-of Latin American medflies is phylogeographically
struc-tions of Ceratitis capitata: comparison between RAPD and
multi-tured or simply a phylogenetically heterogeneous
popu-locus enzyme electrophoresis data. Heredity 74: 425–437.
lation will be determined by future genetic analysis of Begun, D. J.,andC. F. Aquadro,1992 Levels of naturally occurring
DNA polymorphism correlate with recombination rates in D.
intron variation already under way in our laboratory.
melanogaster. Nature 356: 519–520.
We are also addressing these questions theoretically
Carey, J. R.,1991 Establishment of the Mediterranean fruit fly in
through simulation studies. California. Science 253: 1369–1373.
Daehler, C. C.,andD. R. Strong, Jr.,1993 Prediction and
biologi-To conclude, powerful genetic tools are now available
cal invasions. Trends Ecol. Evol. 8: 380–381.
to investigate the source of contemporary bioinvasions,
Davies, N.,andG. K. Roderick, 1999 Determining pathways of
and the statistical methods for analyzing these data con- marine bioinvasion: genetical and statistical approaches, in First
Conference on Marine Bioinvasions, edited byJ. Pederson.Plenum
tinue to become more sophisticated. In the future, the
Press, Boston (in press).
challenge will be to integrate such genetic results with
Davies, N., F. X. VillablancaandG. K. Roderick,1999
Determin-ecological and interception data to fully elucidate the ing the source of newly founded populations: multilocus
genotyp-ing in nonequilibrium population genetics. Trends Ecol. Evol.
process of range expansion exemplified by the medfly
14:17–21.
and other invasive species. It seems likely that the origin
Elton, C.,1958 The Ecology of Invasions by Animals and Plants.
Chap-of Californian medfly infestations can be determined man and Hall, London.
Excoffier, L., P. SmouseandJ. Quattro,1992 Analysis of
molecu-through the use of multilocus genotyping techniques
lar variance inferred from metric distances among DNA
haplo-such as microsatellites and methods haplo-such as single-strand
types: application to human mitochondrial DNA restriction data.
conformation polymorphism (SSCP;Lessa1992;Ortı´ Genetics 131: 479–491.
Foote, D.,1997 Selection in populations of the Mediterranean fruit
et al. 1997) that rapidly screen intron variation. In the
fly (Ceratitis capitata) in Hawaii. Ph.D. Thesis, University of
Califor-case of Californian medflies, source populations should
nia, Davis.
be monitored for a suite of markers, and the database Frank, J. H.,andE. D. McCoy,1991 The immigration of insects
to Florida, with a tabulation of records published since 1970.
of allele frequencies regularly updated as these dynamic
Florida Entomologist 75: 1–28.
populations evolve due to drift or the introduction of
Gasparich, G. E., J. G. Silva, H.-Y. Han, B. A. McPheron, G. J. Steck
new alleles through gene flow. (At the moment little is et al., 1997 Population genetic structure of Mediterranean fruit
fly (Diptera: Tephritidae) and implications for worldwide
coloni-known about how the genetic make-up of source
popula-zation patterns. Annal. Entomol. Soc. Amer. 90: 790–797.
tions varies with time.) With adequate baseline data
Gasperi, G., C. R. Guglielmino, A. R. MalacridaandR. Milani,
from source populations, new medfly infestations in 1991 Genetic variability and gene flow in geographical
popula-tions of Ceratitis capitata (Wied.) (medfly). Heredity 67: 347–356.
California or elsewhere could be rapidly genotyped and
Glenn, T.,1998 Microsatellite Manual v. 6. Smithsonian Institution
assigned to a source. Due to its economic significance,
,gopher:// nmnhgoph . si . edu : 70 / 0ftp%3Aonyx.si.edu @
the medfly infestation has become a model system for protocols/MsatManV6.rtf., Washington, DC.
Gomulski, L. M., K. Bourtzis, S. Brogna, P. A. Morandi, C.
Bonvi-the study of contemporary bioinvasions and has several
ciniet al., 1998 Intron size polymorphism of the Adh1 gene
important lessons for other cases where limited funding
parallels the worldwide colonization history of the Mediterranean
is likely to restrict the amount of research effort. The fruit fly, Ceratitis capitata. Mol. Ecol. 7: 1729–1742.
Hardy, D. E.,andM. D. Delfinado,1980 Diptera: Cyclorrhapha III,
genetic analysis of new bioinvasions should begin with
Series Schizophora Section Acalypterae, exclusive of Family Drosophilidae.
mtDNA and allozymes; however, highly variable nuclear
University Press of Hawaii, Honolulu.
regions, such as introns, should also be considered. Haymer, D. S., M. HeandD. O. McInnis,1997 Genetic marker
analysis of spatial and temporal relationships among existing
Multilocus genotyping provides a rapid method of
de-populations of the Mediterranean fruit fly. Heredity 79: 302–309.
termining the origin of invasions, whether using
nonse-Hoelzer, G. A.,1997 Inferring phylogenies from mtDNA variation:
quencing methods of screening intron variation and/ mitochondrial-gene trees versus nuclear-gene trees revisited.
Evo-lution 51: 622–625.
or other types of markers. While the routine screening
Hudson, R. R., 1994 How can the low levels of DNA sequence
of new infestations may not require the expense of
se-variation in regions of the Drosophila genome with low
recombina-quencing, for a full understanding of the bioinvasion tion rates be explained. Proc. Natl. Acad. Sci. USA 91: 6815–6818.
Kareiva, P.,1996 Developing a predictive ecology for
non-indige-process, DNA sequences at multiple loci are an
invalu-nous species and ecological invasions. Ecology 77: 1651–1652.
able and versatile tool.
Lathrop, G. M., A. B. Hooper, J. W. HuntsmanandR. H. Ward,
1983 Evaluating pedigree data. I. The estimation of pedigree We thank M. Soedarjo and B. Thorsby for their invaluable work in
error in the presence of marker mistyping. Am. J. Hum. Genet. the lab. We are grateful to B. Rannala and J. Mountain for providing
35:241–262. us with their computer program and for discussing its application to
Lawton, J. H.,andK. C. Brown,1986 The population and commu-our study. We also thank S. R. Palumbi and A. Bohonak for comments
nity ecology of invading insects. Phil. Trans. R. Soc. Lond. B 314: on previous drafts of this article. Financial support was provided by the
607–617.
California Deparartment of Food and Agriculture, U.S. Department of Lessa, E. P.,1992 Rapid surveying of DNA sequence variation in Agriculture National Research Initiative and Agricultural Research natural populations. Mol. Biol. Evol. 9: 323–330.
Service, and National Science Foundation awards 9510822 (to F.X.V.), Lodge, D. M.,1993 Biological invasions: lessons for ecology. Trends Ecol. Evol. 8: 133–137.
Malacrida, A. R., C. R. Guglielmino, G. Gasperi, L. BaruffiandR. Assessment of Their Biology and Management, edited by B. A. McPheronandG. J. Steck.St. Lucie Press, Delray Beach, FL.
Milani,1992 Spatial and temporal differentiation in colonizing
populations of Ceratitis capitata. Heredity 69: 101–111. Roderick, G. K., N. Davies, A. J. BohonakandF. X. Villablanca,
1998 The interface of population genetics and systematics:
inva-Marshall, T. C., J. Slate, L. E. B. KruukandJ. M. Pemberton,1998
Statistical confidence for likelihood-based paternity inference in sion genetics of the Mediterranean fruit fly (Ceratitis capitata), pp. 489–499 in Pest Management—Future Challenges. Proceedings of natural populations. Mol. Ecol. 7: 639–655.
McGuigan, K., K. McDonald, K. ParrisandC. Moritz,1998 Mito- the Sixth Australasian Applied Entomological Research Conference, ed-ited byM. P. Zalucki, R. A. I. DrewandG. G. White.University chondrial DNA diversity and historical biogeography of a wet
forest-restricted frog (Litoria pearsoniana) from mid-east Australia. of Queensland, Brisbane, Australia.
Schneider, S., J.-M. Kueffer, D. RoessliandL. Excoffier,1997 Mol. Ecol. 7: 175–186.
McPheron, B. A., G. E. Gasparich, H. HanandG. J. Steck,1994 Arlequin. http://anthropologie.unige.ch/arlequin, University of Geneva, Geneva, Switzerland.
Mitochondrial DNA restriction map for the Mediterranean fruit
fly, Ceratitis capitata. Biochem. Genet. 32: 25–33. Sheppard, S. W., G. J. SteckandB. A. McPheron,1992 Geographic populations of the medfly may be distinguished by mitochondrial
McPheron, B. A., W. S. SheppardandG. J. Steck,1995 Genetic
research and the origin, establishment, and spread of the Mediter- DNA variation. Experientia 48: 1010–1013.
Siebert, J. A., 1994 Economic impact of an embargo by Japan, ranean fruit fly, pp. 93–107 in The Medfly in California: Defining
Critical Research, edited byJ. G. Morse, R. L. Metcalf, J. R. Carey Korea, Taiwan and Hong Kong of selected California exports due to a Mediterranean fruit fly infestation. Dept. Agric. and Res. andR. V. Dowell.University of California, Center for Exotic
Pest Research, Riverside. Econom., University of California, Berkeley.
Slatkin, M., 1994 Cladistic analysis of DNA sequence data from
Metcalf, R. L.,1995a Biography of the Medfly, pp. 43–48 in The
Medfly in California: Defining Critical Research, edited byJ. G. Morse, subdivided populations, pp. 18–34 in Ecological Genetics, edited byL. A. Real.Princeton University Press, Princeton, NJ.
R. L. Metcalf, J. R. Carey andR. V. Dowell.University of
California, Center for Exotic Pest Research, Riverside. Sokal, R. R.,andF. J. Rohlf,1995 Biometry. W. H. Freeman and Company, New York.
Metcalf, R. L.,1995b The need for research on exotic pests in
California, pp. 5–39 in The Medfly in California: Defining Critical Steck, G., G. E. Gasparich, H.-Y. Han, B. A. McPheronandW. S. Sheppard,1996 Distribution of mitochondrial DNA haplotypes Research, edited byJ. G. Morse, R. L. Metcalf, J. R. Careyand
R. V. Dowell.University of California, Center for Exotic Pest among Ceratitis capitata populations worldwide, pp. 291–296 in Fruit Fly Pests: A World Assessment of Their Biology and Management, Research, Riverside.
edited byB. A. McPheronandG. Steck.St. Lucie Press, Delray
Miller, M. P.,1998 Tools for Population Genetic Analysis, Northern
Beach, FL. Arizona State University, Flagstaff.
Templeton, A. R.,1998 Nested clade analysis of phylogeographic
Moore, W. S.,1995 Inferring phylogenies from mtDNA variation:
data: testing hypotheses about gene flow and population history. mitochondrial-gene trees versus nuclear-gene trees. Evolution 49:
Mol. Ecol. 7: 381–397. 718–726.
Templeton, A. R.,andC. F. Sing,1993 A cladistic analysis of
pheno-New, T. R.,1995 Introduction to Invertebrate Conservation Biology.
Ox-typic associations with haplotypes inferred from restriction endo-ford University Press, Oxendo-ford.
nuclease mapping. IV. Nested analyses with cladogram
uncer-Ortı´, G., M. P. HareandJ. C. Avise,1997 Detection and isolation
tainty and recombination. Genetics 134: 659–669. of nuclear haplotypes by PCR-SSCP. Mol. Ecol. 6: 575–580.
Templeton, A. R., K. A. CrandallandC. F. Sing,1992 A cladistic
Pa¨a¨bo, S.,andA. C. Wilson,1988 Polymerase chain reaction reveals
analysis of phenotypic associations with haplotypes inferred from cloning artifacts. Nature 334: 387–388.
restriction endonuclease mapping and DNA sequence data. III.
Palumbi, S. R.,1996 Nucleic acids II: the polymerase chain reaction,
Cladogram estimation. Genetics 132: 619–633. pp. 205–247 in Molecular Systematics, edited byD. HillisandC.
U.S. Congress OTA,1993 Harmful Non-Indigenous Species in the
Moritz.Sinauer, Sunderland, MA.
United States. U.S. Government Printing Office, Washington,
Palumbi, S. R.,andC. S. Baker,1994 Contrasting population
struc-DC. ture from nuclear intron sequences and mtDNA of humpback
Villablanca, F. X., G. K. RoderickandS. R. Palumbi,1998 Inva-whales. Mol. Biol. Evol. 11: 426–435.
sion genetics of the Mediterranean fruit fly: variation in multiple
Rannala, B.,andJ. L. Mountain,1997 Detecting immigration
us-nuclear introns. Mol. Ecol. 7: 547–560. ing multilocus genotypes. Proc. Natl. Acad. Sci. USA 94: 9197–
Weir, B. S.,andC. C. Cockerham,1984 Estimating F-statistics for 9201.
the analysis of population structure. Evolution 38: 1358–1370.
Raymond, M.,andF. Rousset,1995 An exact test for population
White, I. M.,andM. M. Elson-Harris,1992 Fruit Flies of Economic differentiation. Evolution 49: 1280–1283.
Significance: Their Identification and Bionomics. CAB International,
Roderick, G. K.,1996a Geographic structure of insect populations: London.
gene flow, phylogeography, and their uses. Annu. Rev. Entomol. Williams, J. G. K., A. R. Kubelik, K. J. Livak, J. A. Rafalskiand 41:263–290. S. V. Tingey,1990 DNA polymorphisms amplified by arbitrary
Roderick, G. K.,1996b Population genetic studies of tephritid flies primers are useful as genetic markers. Nucleic Acids Res. 18: of economic importance, pp. 267–271 in Fruit Fly Pests: A World 6531–6535.
Assessment of Their Biology and Management, edited by B. A. Wright, S.,1951 The genetical structure of populations. Ann. Eu-McPheronandG. J. Steck.St. Lucie Press, Delray Beach, FL. gen. 15: 323–354.
Roderick, G. K.,andR. G. Gillespie,1998 Speciation and phylo- Wright, S., 1965 The interpretation of population structure by geography of Hawaiian terrestrial arthropods. Mol. Ecol. 7: 519– F-statistics with special regard to systems of mating. Evolution 19:
531. 395–420.
Roderick, G. K.,andF. X. Villablanca,1996 Genetic and statistical