CERAMIC FOAM PRODUCTION AND AIR POLLUTANT
EMISSIONS: DEMONSTRATING COMPLIANCE WITH AIR
PERMIT REGULATIONS
By
Alesia Griesmyer
Submitted to the Graduate Faculty of North Carolina State University in
partial fulfillment of the requirements for the degree of
Master of Environmental Assessment
Raleigh, North Carolina
TABLE OF CONTENTS
ABSTRACT……….3
ACKNOWLEDGMENTS………3
INTRODUCTION………..3-10
METHODS………10-17
RESULTS………..17-19
DISCUSSION………...19-25
CONCLUSION……….25-26
REFERENCES………..26-28
ABSTRACT
SELEE Corporation, a ceramics manufacturing company in Hendersonville, NC, operates
under a synthetic minor air quality permit with The North Carolina Division of Air
Quality (NCDAQ), under the NC Department of Environmental Quality. Upon issuing a
new air permit in early 2018, NCDAQ added a requirement for the facility to do
emissions testing for compliance determination. The stationary emission source in
question is subject to demonstrating a minimum of 90% destruction efficiency of volatile
organic compounds (VOCs). Many VOCs can be linked to harmful effects to human
health and the environment, and therefore must be properly controlled. This paper
ACKNOLEDGEMENTS
I would like to express my appreciation for my advisor at North Carolina State
University, Dr. Jennifer Richmond-Bryant, for the ongoing support and guidance through
the completion of my professional project. Special thanks are extended to my colleagues
at SELEE Corporation who assisted in providing data and background knowledge
INTRODUCTION
In 1970, the United States government signed into law the Clean Air Act (CAA), giving
the U.S. Environmental Protection Agency (EPA) authority to establish limits to
pollutants that can be emitted to the air. Section 112 of the CAA addresses emission of
Hazardous Air Pollutants (HAPs). There are 187 HAPs listed in the CAA, which are
considered to have harmful effects on human health and the environment (U.S. Code
Title 42 Part A).
Many industrial activities, particularly the burning of fuel such as gasoline, coal, or
natural gas, are known to emit Volatile Organic Compounds (VOCs), many of which are
classified as HAPs (Kamal, 2016). VOCs classified as HAPs are subject to regulation
based on their toxicity to humans, plants, and animals. There are a large number of
different compounds defined as VOCs, some of which include acetaldehyde, acrolein,
benzene, cresol, formaldehyde, hexane, styrene, toluene, and xylene (Pjetraj, 1996). As a
result of the toxicity of VOCs, many states in the U.S. have developed HAPs programs
for VOC regulations (Moretti, 2002). Environmental and occupational exposure to VOCs
can be linked to many health effects (Sarkhosh, 2017). For this reason, regulatory actions
are taken to reduce and monitor emissions. This paper is about the process of
demonstrating compliance with VOC emission regulations and maintaining proper
conditions of emissions control equipment to ensure optimal efficiency and protection of
human health and the environment.
Under the CAA, each state must ensure compliance with air pollution regulations,
including the NAAQS and HAPs. The North Carolina Division of Air Quality (NCDAQ),
under the authority of the U.S. EPA, works to protect citizens and improve ambient air
quality by enforcing state and federal air pollution regulations. The CAA requires
facilities to obtain a permit to build or add a major stationary source of air pollution. As
of 2016, more than two thousand facilities in North Carolina operate under an air quality
permit (Kuprov, 2016). North Carolina has a state-specific Toxic Air Pollutant (TAP)
control program that regulates 97 chemicals emitted from stationary sources. As
Figure 1: Federal HAPs and North Carolina TAPs
1State specific Acceptable Ambient Levels (AALs) for each of these 97 TAPs are
established to protect human health. North Carolina uses AALs to set Toxic Permit
Emission Rates (TPERs) for TAPs. Pursuant to 15A NCAC 2Q .0711 “Emission Rates
Requiring a Permit”, facility wide emissions may not exceed the TPER for any of the
TAPs listed in 15A NCAC 2Q .0711(a). If facility-wide operations have emissions
exceeding any of the listed TPERs, the facility is required to conduct dispersion modeling
and obtain an air quality permit. Dispersion modeling must demonstrate that ambient
concentrations of the affected air toxics will not exceed the applicable AALs (NCDEQ,
2018). It is important that facilities maintain compliance with emission limits in order to
continue operations, avoid costly fines, and protect human health and the environment.
An initial performance test (often referred to as a stack test) is required for sources
subject to National Emission Standards for Hazardous Air Pollutants (NESHAPs) to
demonstrate compliance with stationary source standards (NCDEQ, 2018). Continued
compliance is then demonstrated through monitoring of control device operating
parameters which are established during the initial performance (stack) test. A stack test
measures the amount of specific regulated pollutants or surrogates emitted from a source
to demonstrate compliance with destruction and removal efficiency requirements.
Controlling VOCs is an expensive process for companies, costing the industry millions of
dollars a year (Copeland, 2016). It can be difficult to test for VOCs because of the large
number of different compounds that fall into this broad category. The most commonly
used methods for quantifying VOCs are Methods 18, 25, and 25A in the Code of Federal
Regulations (40 CFR 60). Controlled and uncontrolled total hydrocarbons are measured
as carbon to determine total gaseous organic concentrations. Additional EPA Reference
Methods may be used to determine important factors such as stack gas velocity and
moisture content of the stack gases. The choice in method(s) used depends upon the
intended use of the data (EPA, Clean Air Act National Stack Testing Guidance, 2009).
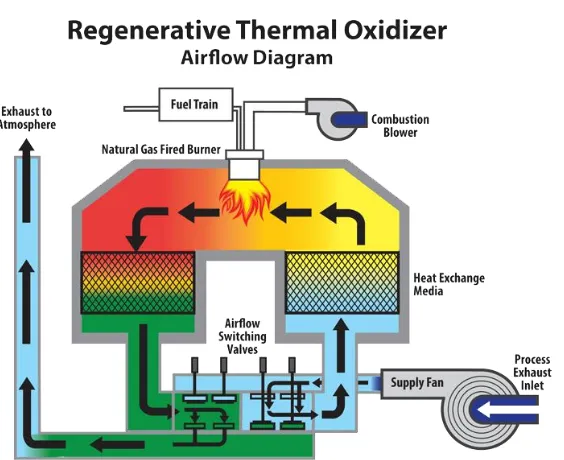
A Regenerative Thermal Oxidizer (RTO) is used to reduce VOCs released to the
environment through thermal destruction of the pollutants. RTO’s control pollution
emitted from a stack by thermally oxidizing the pollutants through exposure to high
temperatures. RTOs are commonly used emission control devices because of their ability
to repurpose thermal energy during operation to reduce costs and energy consumption of
the system (Sorrels, 2017). The basic RTO equipment components and emission control
process is illustrated below in Figure 2.
Figure 2: RTO Process Diagram
2Process emissions are captured in the furnace, ducted to the RTO, and pulled into the
RTO system through an inlet supply fan (Sorrels, 2017). The gas is then directed into the
energy recovery chambers where it is pre-heated. The process gases are progressively
heated as they flow through the ceramic heat exchange media toward the combustion
chamber. In the combustion chamber, high temperatures created by a natural gas fired
burner thermally oxidize contaminants. This purified air then passes through a second
chamber of ceramic media where thermal energy is released as the gases cool. The outlet
gas is then exhausted to the atmosphere through a stack (Venkatesh, 2003). RTOs have
high pollutant removal rates and high thermal efficiency. The level of VOC reduction is
determined by the time waste gases (process emissions) spend in the thermal combustion
chamber. The shorter the residence time, the higher the temperature must be to achieve
the same results. Effective RTO operation also requires uniform flow and temperature
between the chambers where pollutants are oxidized. Thermal efficiency of an RTO
relies on two sets of heat-absorbing ceramic media, which capture and utilize energy
from combustion to heat incoming air (Shelley, 1999). The first set of ceramic media
heats the inlet gas, while the other set recovers thermal energy generated during
combustion. The direction of gas flow between the two chambers is reversed every
couple of minutes (Sorrels, 2017). Improper airflow and temperature control can
substantially decrease the efficiency of an RTO. Often, RTO media will begin to plug
with residue, restricting the flow of air. This causes the air to pass through a smaller area
(also called channeling), resulting in increased velocity of the air and lower residence
time in the RTO chamber (Xiaowen, Ruixin, Jiao, & Xinfei, 2018). It is important to
conduct routine inspection and maintenance of incinerators to address issues like these.
Failure to conduct routine inspection of RTO components can lead to decreased
efficiency, higher emissions, and civil penalty from the state for non-compliance with
permit requirements.
The overall purpose of this project is to determine that the SELEE corporation is in
compliance with Air Quality Permit Number 03973R39 Condition A8. This permit
condition requires emission testing of the RTO serving a Roller Hearth Furnace to
determine the destruction efficiency of VOC emissions. The SELEE Corporation
headquarters, located in Hendersonville, NC, operates a 184,000 square foot
manufacturing facility. SELEE Corporation and NCDAQ cannot be sure that this process
complies with requirements until a stack test is complete. The source is subject to
demonstrating a minimum of 90% destruction efficiency of VOCs. In order to determine
compliance, annual inspection and maintenance of the emission control device will be
conducted, followed by stationary source sampling at the RTO to measure emissions pre
and post control. Further analysis of past and present data can indicate if equipment
condition, age, or volume of production throughput have had an impact on emissions
over time. This project has three specific objectives: (1) assess the current condition of
the RTO media and internal structural integrity; (2) analyze stack testing data from
measurements of destruction efficiency at the maximum-normal production rate and
ascertain if SELEE is in compliance with permit condition A8; and, (3) compare current
stack testing and RTO media data with a previous test from 2007 to determine how
compliance has changed over time.
collected during normal operation. SELEE Corporation is expected to pass the stack test
by meeting or exceeding the minimum requirement of 90% destruction of VOCs.
SITE DESCRIPTION
SELEE Corporation has an average of 150 employees working across five production lines. Each production line specializes in making a different type of ceramic foam filter used for filtration of molten metals in various industries. Most of the products manufactured at SELEE are sold to foundries where metal is molten and purified by means of filtration. The ceramic foam structure of SELEE’s products allows metals to flow through the pores, while impurities are captured by the ceramic matrix and removed from the metal product. Each manufacturing line relies on a drying and high temperature firing process. There are ten furnaces at the facility, each with slightly different applications and operating conditions.
The natural gas-fired roller hearth and associated RTO analyzed in this project are used by the Cast Shop department at SELEE. This department specializes in making large ceramic filters (up to 26” across) which are used exclusively for filtering molten aluminum. The furnace has a series of rollers that allow product to be loaded at one end and removed after firing at the other end. It takes about 30 minutes for a part to travel from entrance to exit of the furnace. This high
temperature firing process emits a range of pollutants at levels that require the facility to operate under a Synthetic Minor Air Quality Permit with NCDAQ. The air quality permit issued to SELEE by NCDAQ covers operation of each furnace at the site. In addition to furnaces, several dryers, dust-generating activities venting to the outdoors, and control devices are described in the air quality permit with specific operating conditions that must be maintained.
During the 2018 compliance inspection at SELEE Corporation, a NCDAQ inspector expressed concern with the deteriorating condition and potential increased emissions of the Cast Shop production line. At the time of the 2018 inspection, SELEE was conducting a review of emissions for an upcoming permit renewal, which is required for all Synthetic Minor permitted facilities every five years. The source in question was last subject to stack testing requirements in 2006; therefore, upon issuing the permit renewal, NCDAQ included the requirement that SELEE perform stack testing before January 2020 to demonstrate that the source is still in compliance with emission limits.
demonstrate that SELEE is maintaining compliance with emissions limits established in the air permit.
Air quality permit No. 03973R39, found in Appendix A, was issued to SELEE Corporation on February 13, 2018 and is valid until January 31, 2026. Permit condition A8 describes testing requirements for the Cast Shop RTO. Under provisions of North Carolina General Statute 143-215.108 and in accordance with 15A NCAC 2D .0605, SELEE is required to demonstrate compliance with emission limits for a natural gas-fired RTO serving a natural gas-fired roller hearth furnace. High temperature firing of polyurethane foam is the primary emission source in the process. The polyurethane foam completely burns off when it reaches a firing temperature of about 300 °F. The furnace typically operates at a temperature of about 1450 °F in the hottest zone. It takes around 30 minutes for a part to travel from the entrance to the exit of the kiln with a typical roller speed of 62 cm per second. The process is permitted to burn 194 pounds of
polyurethane foam per hour and 450,000 pounds per year, increased from 400,000 pounds per year when the 2015 permit was issued.
It is important to note that another processing furnace (the HR-50) has emissions that are also ducted to this RTO. This furnace was permitted for use in production of metal foam products by NCDAQ in 2004. The batch style furnace typically operates once or twice a week.
A variety of pollutant emissions are generated during the high temperature firing process. Emission sources include the natural gas used for firing and the polyurethane foam burnout. Table 1 shows the pollutants generated by each source, how they are categorized as air pollutants, and some of the known human health impacts.
Table 1: Pollutant emissions for natural gas and polyurethane foam
Pollutant Source VOC HAP TAP Health impacts3
Acetaldehyde Foam Yes Yes Yes Upper respiratory irritation.
Acrolein Foam Yes Yes Yes May cause eye, nose, and respiratory tract irritations.
Acrylonitrile Foam Yes Yes Yes Probable human carcinogen. Affected organ systems include developmental, hematological, neurological, and reproductive.
Benzene Foam Yes Yes Yes Known human carcinogen. Affected organ systems include blood forming, immune, and nervous.
Pollutant Source VOC HAP TAP Health impacts3
Chlorine Foam No Yes Yes Skin, eye, and respiratory irritation.
CO Natural
Gas
No No No Respiratory, cardiovascular, and nervous system effects. Deadly at certain concentrations.
Dichlorobenzene Natural Gas
Yes Yes Yes Developmental effects. Liver, eye, renal and respiratory damage.
Ethyl Benzene Foam Yes Yes No Eye and throat irritation
Ethylene Glycol Monoethyl Ether
Foam No Yes Yes Developmental and renal effects.
Formaldehyde Natural Gas
Yes Yes Yes Probable human carcinogen. Skin and digestive system irritation. Immune and respiratory system effects.
Hexane Natural
Gas
Yes Yes Yes Neurological effects
Hydrogen chloride (HCl)
Foam No Yes Yes Lung irritation, shortness of break, eye and skin irritation
Cyanide (HCN) Foam Yes No Yes Nervous, reproductive, cardiovascular, and endocrine system effects. Deadly at certain concentrations.
NOX Natural
Gas
No Yes No Respiratory irritation
Phenol Foam Yes Yes Yes Body weight effects
PM Foam No No No Lung irritation and lung tissue damage
SO2 Natural
Gas
No No No Irritation to skin and mucous membranes of eye, nose, throat and lungs
Styrene Foam Yes Yes Yes Neurological effects
Toluene Diisocyanate (TDI)
Foam Yes Yes Yes Wheezing and shortness of break.
Toluene Foam & Natural Gas
Yes Yes Yes Immune and nervous system effects
METHODS
RTO INSPECTION & MAINTENANCE
Inspection and maintenance (I&M) requirements are part of an air quality permit, Section 11B. Incinerators are subject to periodic I&M as recommended by the manufacturer, but at a minimum I&M must be performed on an annual basis (each 12-month period following initial inspection). This inspection includes internal checks of each heat exchanger and associated inlet/outlet values to ensure proper function and structural integrity. This process is important to maintain proper function of the unit because the high operating temperatures can easily lead to internal corrosion and if problems are not discovered in a timely manner, they can halt production or result in issues of non-compliance. Annual I&M methods include checks of the following common points of failure:
Inspection of internal structural integrity including condition of burners, insulation, roof, valves, and seals. Ensure that all components are operating optimally to control air pollution, as detailed below for each component.
o Valves and fan are thoroughly cleaned. The fan used to put air through the media to exhaust is a good parameter to track and help identify if the media is starting to plug with residue. The harder the fan must pull (increasing hertz), the more plugged the media is. Typical fan speed should be around 30 hertz for the SELEE RTO. If it gets to about 50+ hertz, it is a sign that we need to investigate further and a media changeout might be necessary.
o Check for gaps in media or insulation that if not sealed can lead to uneven heating and heat damage to the support structure. Ceramic fiber insulation is used in the media and combustion chambers to protect the structure from potential heat damage.
o Inspect the support face for signs of structural damage. These walls must support the thousands of pounds of ceramic media, high temperatures, and chemical off gas from combustion. It is inspected for heat marks, discoloration, warped steel, and condensation buildup, which can be signs of gaps in insulation or uneven heating. The external face temperature can also be measured as an indication of gaps in insulation. You do not want the exterior walls to exceed around 150 °F.
o Switching valve inspection to detect excessive wear and tear or alignment issues. This valve is very important for efficiency and proper function of the unit. If the valve is mis-aligned or worn out, a proper seal will not be maintained and emissions can begin to flow back into the furnace, venting inside the building. SELEE has installed an indicator that will alarm if there are alignment issues because this is such a common problem.
accumulation of particles or other residue that will impede air flow. Broken ceramic media on the RTO floor is also something to check for. If problems are discovered, further investigation is required to determine if the media will need to be removed and replaced.
Complete removal and disposal of the old media which typically takes about 8 hours by hand with two to three operators, is not typically done on an annual basis but on average about every 3 years or when necessary following inspection. Around 16 super sacks of media are removed from the unit during the 2019 I&M. Samples of the spent ceramic media were saved for chemical analysis using Ray Diffraction (XRD) and X-Ray Fluorescence (XRF) to determine if any unusual or unexpected compounds were captured or formed in the ceramic media matrix.
New, replacement media is sorted and weighed. A conveyor is used to help feed the new media into the RTO. The total weight of new media was around 6,000 lbs. To replace media, put coarsest, large pieces of foam at the bottom of each can with the finest, smallest pieces on top. It is very important that the total weight of the media be the same in each can. Materials were weighted before being added.
Confined space entry protocol, lock-out and tag out procedures, and respiratory protection are important health and safety procedures that must be followed when entering the RTO for I&M. Employees wear a positive pressure supplied air respirator, tested and certified by NIOSH, to protect against potential particulate and chemical contaminants in the air while performing work. A confined space entry permit is issued following specific checks to ensure hazardous conditions are controlled and emergency procedures are in place. Lock out and tag out procedures for de-energizing the equipment are followed to ensure that accidental start-up will not happen while employees are working inside the confined space of the RTO.
STACK TEST SAMPLING METHODS
The sampling and analytical procedures used during the stack test were those established by the US EPA and NCDEQ. A protocol submittal form (PSF) was submitted to NCDAQ detailing the planned approach for the stack test to ensure these methods were acceptable. This plan was adhered to throughout the sampling. A copy of the PSF can be found in Appendix B. The PSF included proposed test methods and calculations for calibration gas concentration and process rate. A target process rate for the test must be included on the PSF, and it is very important this calculation is accurate and followed the day of the test. Schematics of the RTO and proposed locations for sampling ports were also included.
Stack testing was performed with assistance of a third-party company, Integrity Air, based out of Charlotte, NC. US EPA reference methods used for sampling and analytical procedures are provided below in Table 2.
Table 2: Sampling and Analytical Procedures
Reference Method Parameter
2 Volumetric Flow Rate & Assignment of Inlet Molecular Weight
3 Assignment of RTO Exhaust Molecular
Weight
4 Moisture Content
25A Total Organic Compounds (VOC)
Concentration
These test methods are available in the Code of Federal Regulations Volume 40, Part 60. A brief synopsis of each test method is described in the following section.
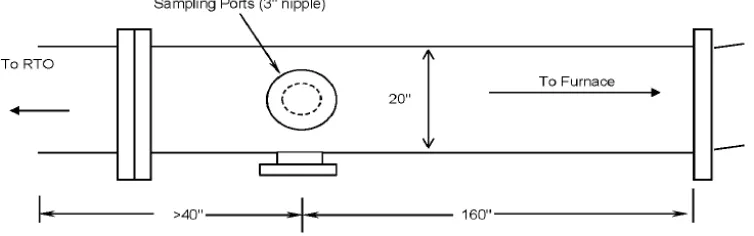
Method 1 provides guidance for selecting sampling port locations when testing gas streams flowing in ducts, stacks, and flues. This method is not allowed to be used on stacks less than 12 inches in diameter or if the gas flow is cyclonic (swirling). A cross section of the stack is divided into several equal areas and traverse points are then located within each of the equal areas. Any bend or change in the stack that will cause flow disturbance and must be considered for selection of sampling site location (CFR Title 40, §60.547). During the 2019 stack test, duct diameters were measured and recorded prior to sampling. Traverse points were chosen with respect to sampling port locations. The RTO stack diameter measures 18”, which in accordance with
Figure 4: Thermal Oxidizer Exhaust
Method 2 was used for determination of the average flow rate of the stack gas. Average temperature and average velocity head were measured to calculate volumetric flow rate. This must be done for each test run, prior to, during, and after the test. A velocity traverse was
conducted at the beginning and end of each test run. The average of the two measurements is used to calculate the volumetric flow rate for the run (CFR Title 40, §60.583). Atmospheric and static pressure of the stack were also measured for each set of velocity head readings to identify
Method 3 was used to determine the carbon dioxide and oxygen concentrations and dry molecular weight of the gas stream. A single-point grab sample was extracted from the stack for analysis of the percent CO2 and O2 using an Orsat analyzer. The dry molecular weight for the inlet and outlet of the RTO was determined and assigned prior to the test and included on the PSF to NCDAQ. Prior to testing, the RTO inlet was assigned a value of 29.0 lb/lb-mole according to Section 8.6 of method 2 and the RTO outlet (exhaust) was assigned a value of 30.0 lb/lb-mole according to Section 1.3 of Method 3. Thorough leak-checks of the Orsat analyzer were performed on site before sampling.
Method 4 was used to determine moisture content of the RTO inlet and exhaust gas. This measurement is important to be able to correct the mass emission rate to a dry basis. A probe heated to 248 °F (+/- 25°F) was used along with a moisture condensing train to measure the moisture content at the inlet and outlet of the RTO. Moisture was removed from the sample gas stream and determined volumetrically based on the net gain of water vapor condensed. At the end of each test run, the moisture could be calculated using the equations in Method 4, Section 12.
Method 25A was used to determine the total hydrocarbon concentrations and emission rates of each test run. Sampling was performed using a VIG Industries Model 20 dual FIA analyzer. Propane was used as the calibration gas. Sampling ranges were set to 0-100 ppm propane at the RTO exhaust and 0-1,000 ppm propane at the RTO inlet. Under Method 25A, the sampling time for each run must be at least 1 hour. Following calibration, a background measurement of VOC concentration is taken upstream and downstream of the RTO. The difference in the pre and post control concentrations is used to determine VOC destruction efficiency (CFR Title 40, §60.547). Standard conditions used for calculations were 68 °F and 29.92 in. Hg.
Field data collected during the test included kiln and RTO temperatures, roller speed, and process throughput rate for each 1-hr test run. This information was manually recorded and was later submitted to the stack testing company and NCDAQ for inclusion with the stack testing report.
QUALITY CONTROL
Quality control (QC) for the stack test was achieved using a combination of specific established for each EPA test method, together with administrative controls that ensured consistent processes were used in terms of operations during the test.
The stack testing company used for the emissions testing, Integrity Air, is accredited as ASTM D7036 by the Stack Testing Accreditation Council. This is a quality management standard for emissions testing and enables data to be delivered in a defined and documented level of quality. The Integrity Air staff is also certified by the Source Evaluation Society as Qualified Source Testing Individuals (QSTI).
QC of production parameters was important in ensuring that accurate foam loading numbers were recorded, and operating conditions were maintained as they were specified in the PSF. If
submitted to NCDAQ, it would likely mean that SELEE would have an invalid test and need to re-sample. Coordination with the product coordinator for this production line to determine scheduling of the product that would be fired during the test was done weeks in advance of the test. Operators were instructed the morning of the test to maintain operations and notify personnel of any production issues. Kiln and RTO temperatures, as well as operational speed, were
monitored manually and were verified afterwards using data collected through SELEE’s SCADA data recording system.
DATA ANALYSIS
Objective 1: Assess the current condition of the RTO media and the RTO structural
integrity via qualitative and quantitative data analysis
Visual analysis of RTO media and internal conditions was done as part of the required annual I&M. The RTO media removed during the 2019 I&M was analyzed using the XRD and XRF analyses. The weight percent of identified components in the used media was compared with that of new, clean media to identify any major differences in compound ratios or new compounds that had formed in the media pores. Photographs of the spent media were taken to use for comparison with the media when it was clean and first put into the RTO during the 2016 changeout. Visual analysis of the internal structural integrity was conducted and followed by measurement of operational parameters such as thermocouple overtemperature sensor settings and gas valve leak testing. These measurements were compared with baseline, expected measurements to determine if there were issues that needed to be addressed with the internal structure and/or function of the system. Inspection of the exterior of the RTO was done to identify any areas with excessive heat damage due to deteriorating internal insulation, which would cause visible hot spots on the roof and/or rust on the exterior metal surface. Additionally, the metal duct work leading to and from the unit was inspected to identify any areas with warping of the metal due to excessive heat or build-up.
Objective 2: Compliance determination via stack testing
Measurements obtained during stack testing were analyzed relative to permit conditions to determine if control destruction efficiency requirements were met during the maximum-normal production rate. Detailed sampling results for each 1-hr sampling run, as well as the overall average, were compared with air permit condition A8 to determine if VOC emissions were in compliance.
also used to calculate emissions for other environmental reports, including the Toxic Release Inventory (TRI) report for EPA. Calculations are done using a Microsoft Access database.
Objective 3: Assess changes in conditions from 2007 to 2019 using stack testing data
and RTO media analysis.
Historical I&M records including internal inspection photos were obtained from the maintenance department. Data from the 2007 stack test were compared with the 2019 test results to determine if similar methods were used, how operating conditions compared, and what can be learned from the 2007 test to inform interpretation of the 2019 test results. Findings from the 2019 I&M were visually compared with photos from prior I&M events. Written records were obtained and reviewed to identify any trends in wear and tear of the RTO, media condition, or operating conditions.
TIMELINE OF ACTIVITIES
The following activities describe the overall process followed for the stack test. It was very important that certain steps were complete in the order described below and within a certain time frame. For example, the PSF had to be sent to NCDAQ for review at least 45 days prior to allow them time to review the test plan and make any necessary adjustments.
January 2019: Initial coordination/planning with stack test company (Integrity Air)
Late January/Early February: Prepared and submitted PSF to NCDAQ
February 18-22nd: Inspection and maintenance of RTO & associated furnace conducted
Early March (3/6/19): Notified NCDAQ of stack test date/time to allow them to be present during the test
3/21/19: Set-up equipment/calibration/initial emission readings were taken
3/22/19: Stack test performed
3/23/19: Prepared report of furnace loading, and temperature data taken during stack test
Early April: Stack test results reviewed/report finalized
Late April: Report sent to NCDAQ
RESULTS
CONDITION OF THE RTO MEDIA AND THE RTO STRUCTURAL
INTEGRITY
Visual analysis of the media removed from the RTO showed signs of plugging and physical degradation. Media on the bottom layers had crumbled from physical stress and the weight of media on top. There was visible discoloration from emission particulates and soot.
XRD analysis indicated three main phase components present in the RTO media removed during inspection: 41.9% Zirconia (ZrO2), 37.3% Arkelite (the cubic phase of ZrO2), and 30.9% Corundum (Al2O3).
XRF analysis identified the presence of three main compounds in the removed media: Al2O3, SiO2 and ZrO2.
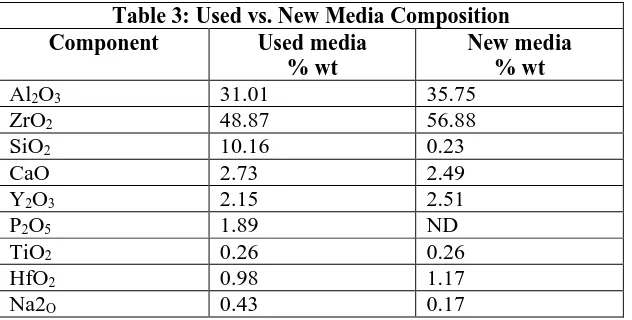
Comparison of the XRF results from the used media with those from a new sample of the same media shows a change in chemical composition. A side-by-side comparison of the major components is provided in Table 3.
Table 3: Used vs. New Media Composition
Component Used media
% wt
New media % wt
Al2O3 31.01 35.75
ZrO2 48.87 56.88
SiO2 10.16 0.23
CaO 2.73 2.49
Y2O3 2.15 2.51
P2O5 1.89 ND
TiO2 0.26 0.26
HfO2 0.98 1.17
Na2O 0.43 0.17
The most notable difference in composition of the used vs. new RTO media is seen in the level of SiO2, which increased more than 40-fold as SiO2 collected in the media overtime during incineration.
Inspection of the RTO itself found no issues with internal structural integrity. As part of preventative maintenance, valves and gaskets were replaced, the fan and stack inlet were cleaned, thermal couples were checked and cleaned, and all bearings were greased.
VOC EMISSION COMPLIANCE
A summary of the results for VOC sampling during each 1-hr run are shown in Table 4. Results for the 4 sampling runs were consistent overall. The Destruction Rate Efficiency (DRE) of VOCs was calculated using the following equations:
Emission rate pre-control (Ein) and post-control (Eout)=
𝑄𝑆𝑇𝑃𝐶𝐷𝑀𝐶
𝑉𝑀𝑆𝑇𝑃
DRE (%)= 100 ∗ 𝐸𝑖𝑛−𝐸𝑜𝑢𝑡 𝐸𝑖𝑛
Where Q STP is flow at standard conditions, CD is total hydrocarbon concentration in ppm measured as carbon (dry), MC is the molar weight of carbon, and 𝑉𝑀𝑆𝑇𝑃 is the ideal gas constant. Total dry hydrocarbon concentration and flow at standard conditions were calculated using equations specified in Method 25A. Results show that emissions for the process were in compliance with permit condition A8.
Table 4: Summary of VOC Results- Cast Shop Roller Hearth Furnace RTO
Run Inlet Outlet (exhaust) DRE
ppm C, dry Organic
Loading Rate Lbs/hr
ppm C, dry Emission
rate lb/hr
%
1 1005.5 3.68 10.8 0.051 98.6
2 993.8 3.72 18.7 0.090 97.6
3 981.6 3.57 19.8 0.095 97.3
4 882.4 3.28 16.1 0.074 97.7
Average 965.8 3.56 16.35 0.078 97.8
All recent air quality permits issued to SELEE Corporation have used emission factors established with NCDAQ during previous stack testing for annual reporting of emissions as required by the air permit.
2007 AND 2019 HYDROCARBON DESTRUCTION EFFICIENCY AND
RTO MEDIA CONDITION
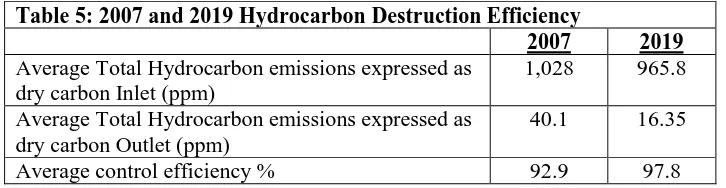
Average sampling results for the 2007 and 2019 stack tests are summarized in Table 5. The average total hydrocarbon concentration, pre- and post-control, was higher during the 2007 stack test than during the 2019 test. DRE (control efficiency) was much lower in 2007, close to the permit limit of 90%, putting the 2007 emissions at risk of non-compliance.
Table 5: 2007 and 2019 Hydrocarbon Destruction Efficiency
2007 2019
Average Total Hydrocarbon emissions expressed as dry carbon Inlet (ppm)
1,028 965.8
Average Total Hydrocarbon emissions expressed as dry carbon Outlet (ppm)
40.1 16.35
The RTO ceramic media used in 2007 was a different material and chemical composition than the ceramic media used in 2019. Photographs and maintenance reports from the 2007 inspection revealed that both types of ceramic media showed signs of physical and chemical degradation when removed from the chamber for replacement.
DISCUSSION
CONDITION OF THE RTO MEDIA AND THE RTO STRUCTURAL
INTEGRITY
The SiO2 found in in the ceramic media at 10.15 % wt likely originated from components used in the ceramic slurry including aluminosilicates and silicas (such as kyanite and wollastonite), which are common components in ceramic products (Davis, 2000). These components accumulated as particulate matter in the ceramic media matrix over time. Minor components such as P2O5 at 1.89 % wt were likely due to contamination from production of another product fired in the furnace that contains some phosphoric acid in the ceramic slurry. All other chemical components in the new and used media were within a similar % wt range. The old RTO media, shown in Figure 5, illustrates how incomplete combustion of gas and particulates from the firing process can cause discoloration of the ceramic media. The plugging of media is disruptive to the function of the RTO because it leads to uneven airflow through the chambers, reduced residence time, and decreased overall efficiency. The media is structured so that the underlying layers have larger, coarse pores (flow channels) and the finest, smallest pore pieces on top (Konowalski, 2018).
VOC EMISSION COMPLIANCE RESULTS
The oxidation of VOCs occurs when organic molecules interact with oxygen at high temperatures (Cooper, 1994). The three most important factors for RTO destruction
efficiency are time, turbulence, and temperature. A high temperature is critical for activation of the oxidation reactions, which must proceed quickly to promote nearly complete
destruction of VOCs. The quick rate of reactions means that enough time must be provided at the desired temperature. Turbulence promotes good mixing between the VOC molecules and the oxygen molecules. Plugged and/or damaged media can impact these important factors because it disrupts airflow through the RTO chamber, leading to poor mixing, decreased residence time as air quickly passes through channels in the media, and lower temperatures in the chamber due to uneven heating of the media (Davis, 2000). Interpretation of how the old media impacted VOC emissions is limited because the media was removed and replaced prior to stack testing. There is no way to know if emissions were in compliance with permit
requirements prior to the stack test, but visual examination of the media during routine inspection indicated that changing the media would be beneficial. Replacing the RTO media prior to the stack test was recommended because it is such an important component of RTO efficiency and would help ensure positive test results. There is no set timeframe for when media replacement is required, but if it becomes plugged or damaged, it is possible tat emissions will increase.
The ceramic media acts as a “BTU thermal heat sink” to heat the low-temperature VOCs entering the inlet of the RTO (Cannon, 2003). The flow path of combustion air through the RTO reverses every 4 minutes. This allows the ceramic media to absorb and store the BTU’s of combustion to continually preheat the incoming VOCs. SELEE’s RTO uses a poppet valve, which is most common in the industry, to rapidly switch the direction of flow (Cannon, 2003). Control of the valve is done automatically using a Programmable Logic Control (PLC) system. This integral, programmable system allows the RTO to operate at high thermal efficiency and effectively destroy VOCs.
The PLC also monitors static pressure of the unit. Monitoring static pressure can be an early indication if the media begins to plug with particulates. As the media begins to plug, airflow is restricted, and the pressure differential rises. Normal static pressure during the stack test was another indication that the media was in good condition and working effectively at VOC destruction.
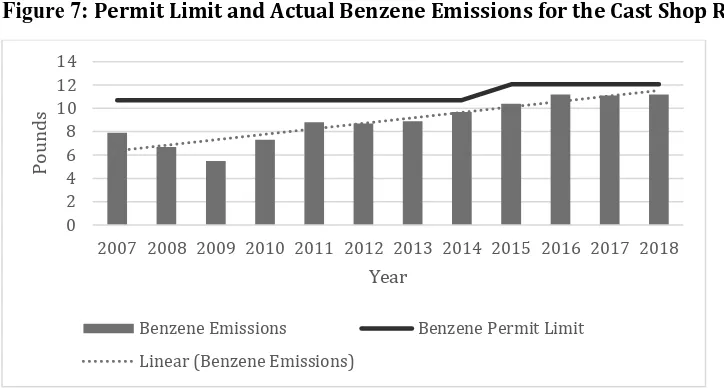
NCDAQ on an annual basis. Figure 7 shows the permitted benzene emissions and actual emissions for the Cast Shop RTO between 2007 and 2018.
Figure 7: Permit Limit and Actual Benzene Emissions for the Cast Shop RTO
Benzene is listed as a TAP under 15A NCAC 02Q.0711 with a facility wide toxic pollutant emission rate (TPER) limit of 8.1 lb/yr. Benzene emissions from SELEE exceed the TPER, which is why there are source specific limits and additional reporting requirements in the permit. Additionally, anytime SELEE adds a new emission source or makes a modification to a source, dispersion modeling must be performed to demonstrate compliance with the AALs listed in 15A NCAC 02D .1104 (NCDEQ, 2018). Sources of benzene emissions are the burning of polyurethane foam and natural gas; therefore, production volumes must be closely monitored. This emission limit is the reason why Section 9A of the air quality permit puts a restriction on the pounds of polyurethane foam that can be fired in the Cast Shop furnace during any calendar year. It is important to note that benzene emissions were not specifically measured during the stack test, only total hydrocarbons. Currently, the reporting of benzene emissions is based on calculations using published emissions factors for polyurethane foam and natural gas, based on production volume.
The number, concentration and type of VOC sources, flowrate, and temperature of the waste gas stream are important factors to consider when selecting an oxidizer. In order to avoid a fire in the ceramic bed chambers of the RTO, the waste air gases must be kept below 25% of the Lower Explosive Limit (LEL). Small fluctuation in the concentration of pollutants is acceptable, up to 40% LEL, but it is ideal to have a steady flow rate and hydrocarbon concentration (Goldshmid, 2005). The Cast Shop furnace runs at a steady loading rate, meaning there is a steady flow rate and concentration of VOCs in the waste gas stream. The steady, high flowrate of waste gas entering the RTO, combined with the low concentration (<0.25 LEL) makes a RTO an effective type of thermal oxidizer for this application.
0 2 4 6 8 10 12 14
2007 2008 2009 2010 2011 2012 2013 2014 2015 2016 2017 2018
Poun
ds
Year
2007 AND 2019 HYDROCARBON DESTRUCTION EFFICIENCY
RESULTS AND RTO MEDIA CONDITION
One limitation to comparing the 2007 and 2019 results is that no XRD or XRF data were collected for chemical analysis of the media in 2007; however, it can be seen from the photographs in Figure 6 that there are differences in the media. Further investigation by reviewing environmental reports found that the media used in 2007 was a silicon carbide ceramic composition made of 71% SiC, 28% SiO2, and 1% other.
Figure 6: 2007 and 2019 RTO Media
Table 6: 2007 and 2019 Operating Parameters
2007 2019
Average RTO Temp (°F) 1467 1604
Average Roller Speed cm/min 60.5 62.6
Average Production Rate (Lbs/hr Foam Burnout) 172.7 103.9
It is important to recognize that the permitted process rate for this furnace is higher than the maximum normal production rate. The graph in Figure 8, below, shows the Cast Shop production line annual throughput relative to the permitted production throughput between 2007-2018. The permit limit was raised from 400,000 pounds per year to 450,000 pounds per year in 2014. Beyond concern for compliance, SELEE should be mindful of the impact increased production has on pollution to the surrounding community. NCDAQ raised the permitted limit for this process, but this comes with an increased health risk for nearby individuals exposed to air pollution. For this reason, it is important that SELEE continues to work at improving emission control equipment to achieve the highest possible destruction efficiency of pollutants emitted from the process.
Figure 8: CS Furnace Production Throughput vs. Permitted Production Throughput
Increased production over the past ten years has resulted in higher VOC emissions. Although still in compliance with permit conditions, it is important to consider the greater risk this poses to human health and the environment. Benzene is a known human carcinogen and chronic exposure to benzene increases the risk of leukemia, birth defects, and respiratory effects. The increased risk occurs at low levels of exposure with no evidence of threshold level (Macey, 2014). In a study conducted near an oil and gas production facility (Macey, 2014) suggested nearby residents and employees exposed to VOCs including benzene showed immediate health symptoms and illness. Within days, exposed children exhibited alterations in liver enzymes and blood properties. It is in the best interest of SELEE Corporation and the community to be mindful of these harmful health effects from exposure to air pollutants. The risks must be considered in terms of ethics,
environmental stewardship, and social responsibility when making decisions regarding production volume, new sources of pollution, and future investment in emission control equipment.
CONCLUSION
Several recommendations can be made for overall improvement and continued assurance of compliance with air permit regulations:
0 50,000 100,000 150,000 200,000 250,000 300,000 350,000 400,000 450,000 500,000
2007 2008 2009 2010 2011 2012 2013 2014 2015 2016 2017 2018
Poun ds of Foa m Year
The facility (or third-party contractor) should inspect the roof and the entire RTO exterior for hot spots once a week. Repainting the roof periodically will make it easier to identify when hot spots develop in the future. Monitoring hot spots is important because it is the best indication of early signs of RTO internal structural issues with insulation or heating. Additionally, weekly walks around the RTO should include checking for a warped metal exterior or damaged fasteners that can indicate buildup within the duct work or uneven heating at connections/joints.
The facility should maintain a schedule of completing a thorough annual inspection and maintenance of the system. This included visual inspection of the media to determine if it needs to be replaced. This evaluation should also include checking the pressure drop across the RTO heat exchanger beds. Increased pressure drop, together with loss of airflow capacity, are indications that the RTO media may be plugged or performing poorly. Performing a “bake out” to clean the build up from colder surface at the bottom of the RTO is recommended annually during the shut-down inspection period. At a minimum, the media is recommended to be completely removed and replaced every 3-5 years.
Continued upgrades to the PLC system and other controls that allow for early
indication of potential issues regarding air flow and temperature of the system will be beneficial to identify potential problems early in the process. Any equipment
malfunctions resulting in increased emissions lasting longer than 4 hours must be reported to NCDAQ as stated in Section 6 of Air Permit No. 03973R39. Using Predictive Analysis Features (PAFs) will help measure media bed pressure drop and temperature and will alert the maintenance group to any potential issues. PLCs allow review of temperature, pressures, fan speeds, and subsystem performance to quickly identify problems. Remote access can reduce travel cost and downtime, delivering in real time data on equipment issues (Konowalski, 2018).
The facility must maintain electronic records of foam throughput and emissions data for review and proof of compliance during air quality audits. It is in the best interest of SELEE and NCDAQ to ensure permit conditions are set with reasonable
consideration of maximum, normal production throughput. This includes accurate tracking of the number and size (to calculate total foam weight) of parts fired in each furnace. The facilities Emissions Data Base (EDB) in Microsoft Access is a useful and accurate tool that uses emission factors to calculate emissions for any given time period using production throughput data.
Positive VOC emissions test results support the facility continuing to use randomly packed zirconia ceramic scrap in the RTO as a cost effective and high efficiency option for media. Switching to structured ceramic block would cost up to 7 times more and would be less durable (Cannon, 2003). Additionally, since SELEE
manufactures these ceramic parts in house and can use scrap as the RTO media, it is both cost effective and environmentally responsible as they are given a second life before the landfill.
The 2019 stack test helped assure corporate stakeholders, employees, and compliance
REFERENCES
Agency for Toxic Substances and Disease Registry (2011, March 3). Toxic Substances Portal. Retrieved April 20, 2019, from https://www.atsdr.cdc.gov/substances/indexAZ.asp 40, U. C. (n.d.). Part 60 Standards of performance for new stationary sources. Retrieved from
https://www.ecfr.gov/cgi-bin/text-idx?SID=e0af095397820bfc0305a1e9a7a9d1b4&node=40:8.0.1.1.1&rgn=div5
Cannon, B. (2003). Dual-Chamber RTO Oxidizers Provide Cost-Effective VOC Compliance for Metal Finishers and Coaters. Metal Finishing. Volume 101, Issue 1, Pg 52-56.
Retrieved from https://doi.org/10.1016/S0026-0576(03)80022-3
Cooper, D. (1994). Air Pollution Control-A Design Approach (2nd ed.), C.D. Cooper and F.C. Alley, Waveland Press.
Copeland, C. (2016). Clean Air Permitting: Implementation and Issues. Congressional Research Service.
Davis, W. (2000). Air Pollution Engineering Manual. Pg. 681-687. John Wiley & Sons, Inc. Hoboken, NJ.
Donley, E, & Lewandowski. (1996). Optimized Design and Operating Parameters for
Minimizing Emissions During VOC Thermal Oxidation. Metal Finishing, Vol. 98, Issue 6. Retrieved from https://doi.org/10.1016/S0026-0576(00)80443-2
Edokpolo, Yu, & Connell. (2019). Use of toxicant sensitivity distributions (TSD) for development of exposure guidelines for risk to human health from benzene, Environmental Pollution, Volume 250, Pages 386-396, Retrieved from https://doi.org/10.1016/j.envpol.2019.04.001.
EPA. (1986). Risk assessment guidelines of 1986. Prepared by Office of Health and
Environmental Assessment, Office of Research and Development. Washington, DC: Environmental Protection Agency. doi:EPA/600/8-87/045
EPA. (2009). Clean Air Act National Stack Testing Guidance. Retrieved from
https://www.epa.gov/sites/production/files/2013-09/documents/stacktesting_1.pdf Ferrand, B. (2008). RTO valve adjustment method and media fill. Retrieved from SELEE
Corporation electronic library database (internal communication).
Goldshmid, Y. (2005). Destroying organic wastes: Thermal oxidizer basics. Chemical Engineering Progress, 101(5), 40-47. Retrieved from
https://proxying.lib.ncsu.edu/index.php/login?url=https://search-proquest-com.prox.lib.ncsu.edu/docview/29239326?accountid=12725
Kamal,M., Razzak, S., & Hossain, M, (2016). Catalytic oxidation of volatile organic
Konowalski, C. (2018). Regenerative Thermal Oxidizer Advances. Process Heating, 25(11), 20-23. Retrieved from https://proxying.lib.ncsu.edu/index.php/login?url=https://search-proquest-com.prox.lib.ncsu.edu/docview/2137388185?accountid=12725
Kuprov, R. (2016). 2015 Special Toxics Study Report. UT Division of Air Quality. Retrieved from https://deq.utah.gov/legacy/pollutants/h/hazardous-air-pollutants-study/index.htm Macey, G., Breech, R., Chernaik, M., Cox, C., Larson, D., Thomas, D., & Carpenter, D. (2014). Air
concentrations of volatile compounds near oil and gas production: a community-based exploratory study. Retrieved from
https://ehjournal.biomedcentral.com/articles/10.1186/1476-069X-13-82
Moretti, E. C. (2002). Reduce VOC and HAP emissions. Chemical Engineering Progress, 98(6), 30. Retrieved from
https://proxying.lib.ncsu.edu/index.php/login?url=https://search-proquest-com.prox.lib.ncsu.edu/docview/221627560?accountid=12725
NCDEQ, N. C. (2018). Quidelines for Evaluating the Air Quality Impacts fo Toxic Pollutants in North Carolina. Retrieved from https://deq.nc.gov/about/divisions/air-quality/air-quality-permits/modeling-meteorology/modeling
Pjetraj, M. (1996). Influence of VOC measurement and reporting methods on regulatory policy and emissions estimates. Retrieved from
https://files.nc.gov/ncdeq/Air%20Quality/enf/sourcetest/voc/VOCweb.pdf Registry, A. f. (2011, March 3). Toxic Substances Portal. Retrieved April 20, 2019, from
https://www.atsdr.cdc.gov/substances/indexAZ.asp
Sarkhosh, M., Shamsipour, A., Yaghmaeian, K., Nabizadeh, R., Naddafi, K., & Seyed, M. M. (2017). Dispersion modeling and health risk assessment of VOCs emissions from municipal solid waste transfer station in tehran, iran. Journal of Environmental Health Science & Engineering, 15
doi:http://dx.doi.org.prox.lib.ncsu.edu/10.1186/s40201-017-0268-0
Shelley, S., & Pennington, R. L. (1999). Get more from your regenerative thermal oxidizer: Optimize key variables to maximize thermal and economic efficiency. Chemical Engineering, 106(5), 137. Retrieved from
https://proxying.lib.ncsu.edu/index.php/login?url=https://search-proquest-com.prox.lib.ncsu.edu/docview/194452339?accountid=12725
Sorrels, L. J. (2017). Incinerators and oxidizers. Research Triangle, NC: Air Economics Group, U.S. Environmental Protection Agency. Retrieved from
https://www.epa.gov/sites/production/files/2017-12/documents/oxidizersincinerators_chapter2_7theditionfinal.pdf
U.S. Code Title 42 Part A. (n.d.). Air quality and emission limitations § 7401- 7431 .