QUEUEING THEORY BASED MODEL AND NETWORK ANALYSIS FOR PREDICTING THE TRANSMISSION AND CONTROL OF EBOLA VIRUS
DISEASE
CHINYERE OGOCHUKWU DIKE
A thesis submitted in fulfilment of the requirements for the award of the degree of
Doctor of Philosophy
Faculty of Science Universiti Teknologi Malaysia
iii
DEDICATION
Dedicated to
My darling husband, Dr. Ikeme John Dike, and my lovely children Okey and Ike whose love, dream, sacrifice, support and encouragement;
My brother and wife, Mr and Mrs Obiajulu Peter Nwofor, whose hospitality, And
My late lovely father, Chief E. C. Nwofor and my beloved mother Mrs E. C. Nwofor, who initiated the educational foundation;
ACKNOWLEDGEMENT
I would like to express my sincere appreciation and gratitude to my supervisor Dr. Zaitul Marlizawati Zainuddin for her inspiring guidance, encouragement, and valuable suggestions throughout the period of this research work. Her unwavering guidance, support, and valuable advice during the initial exploration, the background search and writing of this thesis led to the completion of this research work. Also, her dedication and technical expertise proved to be the key elements to my doctoral research.
Special appreciation goes to my darling husband Dr. I. J. Dike and my lovely children Okey and Ike for their love, patience and support during the period of this research. I am indebted to my immediate younger brother and wife Mr and Mrs Obiajulu Peter Nwofor. I am always on transit in their house in Abuja while going and coming back from Malaysia. To my research colleagues, I am grateful especially Ernest Ituma Igba, Nasiru Zakari Muhammad, Hassan Suleiman Jibrin and Yakubu Aliyu Tanko.
v
ABSTRACT
Ebola Virus Disease (EVD) is a complex epidemic killer disease. Recently, the disease has caused serious loss of life, waste of economy and material resources in West Africa nations. Literature shows that mathematical theories and models such as agent-based model, models based on ordinary differential equation for assessment studies and intervention measures have been proposed by several researchers to handle the outbreak of the disease. But, agent-based model comes with high computational cost, and model based on ordinary differential equation describes reality with varying accuracy. Therefore, there is the need for a mathematical model that can describe the real nature of the disease, reduce computational cost and better prediction of its behaviour. This study presents the modelling and analysis of EVD transmission and control using queueing theory technique. Data collected from WHO Ebola Data and Statistics of the recent outbreak in Guinea, Liberia and Sierra Leone from December 2013 to July 2015 is used in the study. The SEILICDR (Susceptible,
Exposed, Likely Infected, Confirmed Infected, Dead/Recovery) Ebola epidemic model is proposed to accommodate all the transmission phases and be able to explain EVD transmission and control reliably. The EVD transmission patterns and possible control measures are determined using the basic properties of queueing theory. The SEILICDR based compartmental model is obtained, where SEILICDR represent the
compartments within the countries. In addition, the SEILICDR based network model
is also developed to characterize every interpersonal contact that can potentially lead to disease transmission. Findings indicate that the spread of EVD follows an irregular and random pattern. Also, the SEILICDR model shows that the Quasi-Stationary
ABSTRAK
Penyakit Virus Ebola (EVD) adalah wabak penyakit pembunuh kompleks. Terkini, penyakit ini telah menyebabkan kehilangan nyawa yang serius, pembaziran ekonomi dan sumber bahan di negara-negara Afrika Barat. Literatur menunjukkan bahawa teori dan model matematik seperti model berasaskan ejen, model berdasarkan persamaan pembezaan biasa untuk kajian penilaian dan langkah intervensi telah dicadangkan oleh beberapa penyelidik untuk menangani penularan wabak penyakit ini. Tetapi, model berasaskan ejen memerlukan kos komputeran yang tinggi, dan model berdasarkan persamaan pembezaan biasa menggambarkan realiti dengan ketepatan yang berubah-ubah. Oleh itu, terdapat keperluan untuk model matematik yang dapat menggambarkan sifat sebenar penyakit ini, mengurangkan kos komputeran dan dapat meramalkan perilakunya dengan lebih tepat. Kajian ini membentangkan pemodelan dan analisis penyebaran dan kawalan EVD menggunakan teknik teori giliran. Data yang dikumpul daripada Data Ebola dan Statistik WHO untuk wabak terkini di Guinea, Liberia dan Sierra Leone dari Disember 2013 hingga Julai 2015 digunakan dalam kajian ini. Model wabak Ebola SEILICDR (Mudah terdedah, Terdedah, Dijangka dijangkiti, Disahkan dijangkiti,
Mati/Pemulihan) adalah dicadangkan untuk mewakili semua fasa penyebaran dan dapat menjelaskan penyebaran dan kawalan EVD dengan pasti. Corak penjangkitan dan langkah-langkah kawalan EVD ditentukan dengan menggunakan sifat-sifat asas teori giliran. Model SEILICDR berasaskan petak diperolehi di mana SEILICDR
mewakili petak dalam setiap negara. Sebagai tambahan, model rangkaian berasaskan SEILICDR juga dibangunkan untuk mencirikan setiap hubungan interpersonal yang
berpotensi membawa kepada jangkitan penyakit. Dapatan kajian menunjukkan bahawa penyebaran EVD mengikut corak yang tidak seragam dan rawak. Model SEILICDR juga menunjukkan bahawa penghampiran Quasi-Stationary Distribution
vii
TABLE OF CONTENTS
CHAPTER TITLE PAGE
DECLARATION ii
DEDICATION iii
ACKNOWLEDGEMENT iv
ABSTRACT v
ABSTRAK vi
TABLE OF CONTENTS vii
LIST OF TABLES xii
LIST OF FIGURES xv
LIST OF ABBREVIATIONS xviii
LIST OF SYMBOLS xxi
LIST OF APPENDICES xxvii
1 INTRODUCTION 1
1.1 Overview of the Research Problem 1
1.2 Motivation 3
1.3 Background of the Research 7
1.3.1 Outbreak, Transmission and Control 7
1.3.2 Intervention 7
1.3.3 Queueing Analysis 8
1.4 Statement of the Problem 11
1.5 Research Questions 11
1.6 Objectives of the Study 12
1.7 Scope of the Research 12
1.9 Thesis Organisation 14
2 LITERATURE REVIEW 17
2.1 Introduction 17
2.2 Epidemic Diseases 17
2.3 History and Effects of Ebola Virus Disease 18 2.4 Review of Related Literature on Ebola Virus Disease
Transmission and Control 20
2.4.1 Implication and Control of Ebola 21
2.4.2 Incidents and Deaths 21
2.4.3 Modelling 23
2.4.4 Clinical Diagnosis and Effectivesness of Numerous
Intervention 28
2.4.5 Global Alert on Ebola Virus Disease 333 2.4.6 Effects of Ebola on Convalescent 344
2.5 Research Gap 41
2.6 Summary of Literature Review 42
3 METHODOLOGY 43
3.1 Introduction 43
3.2 Research Plan 43
3.3 Research Design and Procedure 47
3.3.1 Step 1: Framing of Question 48
3.3.2 Step 2: Structure the Problem 49
3.3.3 Step 3: Data Collection/Data Presentation 49 3.3.4 Step 4: Queueing Analysis of Disease Control 51 3.3.5 Step 5: Development of Mathematical Model of
Disease Transmission 51
3.3.6 Step 6: Compartmental Epidemiological Model 52 3.3.7 Step 7: Network Epidemiological Model 55 3.3.8 Step 8: Running and Testing Model 57
3.3.9 Step 9: Model Validation 57
ix
3.4 Operational Framework 59
3.5 Theoretical Framework 60
3.6 Summary 62
4 BASIC PROPERTIES OF QUEUEING TECHNIQUE FOR
EBOLA VIRUS DISEASE TRANSMISSION AND CONTROL 63
4.1 Introduction 63
4.2 Ebola Data for Guinea, Liberia, and Sierra Leone 63 4.3 Test for Exponentiality Using M/M/1 Queueing Model 65 4.4 Generation of Basic Properties of Queueing Theory
from EVD Data (Guinea, Liberia, and Sierra Leone) Using
M/M/1 Queueing Model 67
4.5 Mathematical Formulation of Queueing Theory
Governing Equation 67
4.6 Application of the Queueing Technique to EVD Problem 73 4.7 Analysis of Guinea, Liberia and Sierra Leone 2014
EVD Outbreak 76
4.8 Summary 84
5 DEVELOPMENT OF SEILICDR MODEL 85
5.1 Introduction 85
5.2 Development of SEILICDR Model 85
5.3 The SIS and SEIS Based Quasi-Stationary Distribution 86 5.4 Quasi-Stationary Distribution of the Proposed
SEILICDR Model 93
5.5 SEILICDR Model for the Number of Exposed, Likely
Infected and Confirmed Infected Person’s Marginal Joint
Quasi-Stationary Distribution (QSD) 100
5.6 Analysis of the developed SEILICDR Model for
Adequate Description of All the Transmission Phases
and Behaviours of EVD Using Queueing Theory 102
5.6.1 Results 103
5.8 Summary 112
6 SEILICDR COMPARTMENTAL MODEL 113
6.1 Introduction 113
6.2 Development of SEILICDR Compartmental Model 114
6.2.1 Timeline of Spread of Recent EVD Outbreak
in Guinea 118
6.2.2 Timeline of Spread of Recent EVD Outbreak
in Liberia 120
6.2.3 Timeline of Spread of Recent EVD Outbreak
in Sierra Leone 121
6.2.4 Discussion on Model Fit Result for the SEILICDR
Model 123
6.2.4.1 Validation of the SEILICDR Compartmental
Model 128
6.3 Application of the SEILICDR Compartmental Model in EVD
Cases 129
6.3.1 Derivation of Basic Reproduction Number 130 6.3.1.1 Discussion on Result of the Derivation
of Basic Reproduction Number 135 6.4 Application of Queueing Theory to SEILICDR
Compartmental Model 139
6.5 Summary 144
7 SEILICDR NETWORK MODEL 146
7.1 Introduction 146
7.2 SEILICDR Queueing Networks 147
7.2.1 Multiple Channel Open Jackson Queueing
Networks 147
7.2.2 Contact Network 148
7.2.3 Urban Contact Network 148
7.3 Transmissibility of EVD 153
xi
7.4.1 Validation of SEILICDR Network Model 162
7.5 Summary 162
8 CONCLUSIONS AND RECOMMENDATIONS 164
8.1 Introduction 164
8.2 Summary/Conclusion 164
8.3 Contributions 171
8.4 Limitations 172
8.5 Recommendations for Future Work 172
REFERENCES 174
LIST OF TABLES
TABLE NO. TITLE PAGE
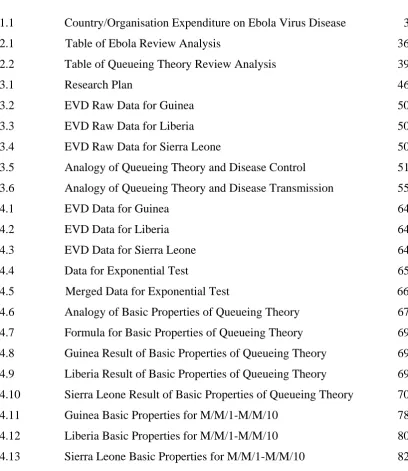
1.1 Country/Organisation Expenditure on Ebola Virus Disease 3 2.1 Table of Ebola Review Analysis 36
2.2 Table of Queueing Theory Review Analysis 39
3.1 Research Plan 46
3.2 EVD Raw Data for Guinea 50
3.3 EVD Raw Data for Liberia 50
3.4 EVD Raw Data for Sierra Leone 50
3.5 Analogy of Queueing Theory and Disease Control 51 3.6 Analogy of Queueing Theory and Disease Transmission 55
4.1 EVD Data for Guinea 64
4.2 EVD Data for Liberia 64
4.3 EVD Data for Sierra Leone 64
4.4 Data for Exponential Test 65
4.5 Merged Data for Exponential Test 66 4.6 Analogy of Basic Properties of Queueing Theory 67 4.7 Formula for Basic Properties of Queueing Theory 69 4.8 Guinea Result of Basic Properties of Queueing Theory 69 4.9 Liberia Result of Basic Properties of Queueing Theory 69 4.10 Sierra Leone Result of Basic Properties of Queueing Theory 70
4.11 Guinea Basic Properties for M/M/1-M/M/10 78
4.12 Liberia Basic Properties for M/M/1-M/M/10 80
xiii
5.1 Exposed, Likely Infected, Confirmed Infected, Nunber of Infected Persons and their Standard Normal Value for
Guinea 2014 – 2015 EVD 102
5.2 Exposed, Likely Infected, Confirmed Infected, Nunber of Infected Persons and their Standard Normal Value for
Liberia 2014 – 2015 EVD 103
5.3 Exposed, Likely Infected, Confirmed Infected, Nunber of Infected Persons and their Standard Normal Value for
Sierra Leone 2014 – 2015 EVD. 103
5.4 Stochastic SEILICDR epidemic model for Approximation 104
6.1 2015 Guinea Population by District 119
6.2 2008 Liberia Populations by District 121
6.3 2004 Sierra Leone Populations by District 122
6.4 Calculation of Estimated Cumulative Infected (RMSE) for Guinea 125 6.5 Estimated Number of Cumulative Infected, Confirmed
Infected, Likely Infected, Exposed, Number of Death, Recovery People and Root Mean Square Error (RMSE) of
Prediction for Guinea 125
6.6 Estimated Number of Cumulative Infected, Confirmed Infected, Likely Infected, Exposed, Number of Death, Recovery People and Root Mean Square Error (RMSE)
of Prediction for Liberia 126
6.7 Estimated Number of Cumulative Infected, Confirmed Infected, Likely Infected, Exposed, Number of Death, Recovery People and Root Mean Square Error (RMSE) of
Prediction for Sierra Leone 126
6.8 Calculation of Estimated Confirmed Infected (RMSE) for Guinea 127
6.9 Table of Comparative Analysis 128
6.10 Disease Commencement days and Intervention Time 134
7.1 Urban Network and their Probabilities 151
7.2 Critical Transmissibility, Transmissibility and Probability
7.3 Probability of Infected in the Three Countries for both
xv
LIST OF FIGURES
FIGURE NO. TITLE PAGE
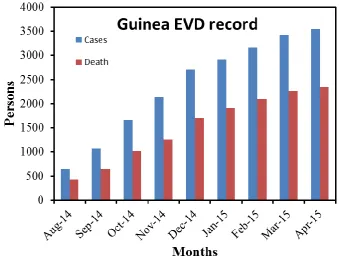
1.1 Record of EVD in Guinea. 4
1.2 Record of EVD in Liberia. 5
1.3 Record of EVD in Sierra Leone. 6
1.4 Scenarios Leading to Research Problem 10
3.1 Stages of Disease Transmission and Queueing Theory 55
3.2 Operational Framework of Research 60
3.3 Theoretical Framework of Research 61
4.1 Guinea Transmission Pattern of the Disease 77
4.2 Guinea Number of Infected Persons per Hour 77
4.3 Guinea. (a) Probability of Infection (b) ANS against Centre (c) AWTR against Centre (d) AWTS against Centre
(e) ENP against Centre 78
4.4 Liberia Transmission Pattern of the Disease 79
4.5 Liberia Number of Infected Persons per Hour 9
4.6 Liberia (a) Probability of Infection (b) ANS against Centre (c) AWTR against Centre (d) AWTS against Centre
(e) ENP against Centre 81
4.7 Sierra Leone Transmission Pattern of the Disease 81 4.8 Sierra Leone Number of Infected Persons per Hour 82 4.9 Sierra Leone (a) Probability of Infection (b) ANS against Centre
(c) AWTR against Center (d) AWTS against Centre
(e) ENP against Centre 83
5.2 Guinea Contour Diagram of Exposed and Likely Infected
Persons 106
5.3 Guinea Contour Diagram of Likely Infected and Confirmed
Infected Persons. 106
5.4 Liberia Stochastic SEILICDR Epidemic Model (histogram). 107
5.5 Liberia Contour Diagram of Exposed and Likely Infected Persons 107 5.6 Liberia Contour Diagram of Likely Infected and Confirmed
Infected Persons 108
5.7 Sierra Leone Stochastic SEILICDR Epidemic Model (histogram). 108
5.8 Sierra Leone Contour Diagram of Exposed and Likely Infected
Persons 109
5.9 Sierra Leone Contour Diagram of Likely Infected and
Confirmed Infected Persons 109
6.1 A Schematic of the Transitions between Different States
of EVD for SEIR Model 114
6.2 A Schematic of the Transitions between Different States
of EVD for SEILICDRModel 115
6.3 EVD Affected Districts in Guinea 119
6.4 EVD Affected Districts in Liberia 120
6.5 EVD Affected Districts in Sierra Leone 122
6.6 SEILICDR Model Fit Result for 2014 Ebola Epidemic Data
for Guinea 123
6.7 SEILICDR Model Fit Result for 2014 Ebola Epidemic Data
for Liberia 124
6.8 SEILICDR Model Fit Result for 2014 Ebola Epidemic Data
for Sierra Leone 124
6.9 Map of the Affected Countries: (a) Showing Cases,
(b) Showing Severity 120
6.10 Progression of Infection from Susceptible (S) Individuals through the Exposed ( ),E Likely Infected ( ),IL Confirmed Infected ( ),IC and Controlled Dead/Recovery
D R
/
xvii
6.11 Trend of EVD Epidemic in SEILICDR Compartments for
Guinea 137
6.12 Trend of EVD Epidemic in SEILICDR Compartments for
Liberia 137
6.13 Trend of EVD Epidemic in SEILICDR Compartments for
Sierra Leone 138
6.14 Normal Distribution Curve for Guinea (a) Number of Exposed, (b) Number of Likely Infected, (c) Number of Confirmed
Infected, (d) Number of Death/Recovery 141
6.15 Normal Distribution Curve for Liberia (a) Number of Exposed, (b) Number of Likely Infected, (c) Number of Confirmed
Infected, (d) Number of Death/Recovery 142
6.16 Normal Distribution Curve for Sierra Leone (a) Number of Exposed, (b) Number of Likely Infected, (c) Number of
Confirmed Infected, (d) Number of Death/Recovery 143
7.1 Urban Contact Network 149
7.2 Degree of Contact in the Network Stations 152
LIST OF ABBREVIATIONS
AIDS - Acquired Immunodeficiency Syndrome ANS - Average Number in the System
AWTR - Average Waiting Time for Recovery AWTS - Average Waiting Time in the System B - Bcell- humoral immunity
BD - Birth Death
BDsa - Birth Death Sampled Ancestors
BDss - Birth Death Super Spreader
BDEI - Birth Death Exposed Infected
BDSIR - Birth Death Susceptible Infected Removed CDC - Centre for Disease and Control
CFR - Case Fatality Ratio CI - Confidence Interval
CIA - Central Intelligence Agency CNN - Cable News Network
CS/s - Compartmental Size per second DFE - Disease Free Equilibrium DRC - Democratic Republic of Congo E - Exposed
EBOV - Ebola Virus
EFSA - European Food Safety Authority
EGARCH - Exponential Autoregressive Conditional Heteroskedatic EHF - Ebola Haemorrhagic Fever
ENS - Expected Number in the System ETUs - Ebola Treatment Units
xix
FCFS - First Come First Served
GI/M/S - General Independent/Memoryless/Server HHCs - Household Contacts
HIV - Human Immunodeficiency Virus HPD - Highest Posterior Density
I - Infected
IBT - International Business Times IgG - Antibodies called Immunoglobulin MATLAB - Matrix Laboratory
MCMC - Markov Chain Monte Carlo
MGARCH-DCC- Multivariate Generalize Autoregressive Conditional Heteroskedatic-Dynamic Correlation Coefficient M/G/1 - Memoryless/General/1 (Number of Server is 1) M/G/N - Memoryless/General/N (Number of Server is N)
M/M/./. - Memoryless/ Memoryless /. (Number of Server is .)/ Capacity (.)
M/M/1 - Memoryless/ Memoryless /1 (Number of Server is 1)
M/M/1/K - Memoryless/ Memoryless /1 (Number of Server is 1)/Capacity (K)
M/M/S - Memoryless/ Memoryless /S (Number of Server is S)
M/M/s/K - Memoryless/ Memoryless /s (Number of Server is s)/Capacity (K)
PGF - Probability Generating Functions PPR - Prevalence Proportion Ratios QC - Quarantine Centre QSD - Quasi-Stationary Distribution REBOV - Reston Ebola Virus
RMSE - Root Mean Square Error RR - Rate Ratio
S - Susceptible
SD - Standard Deviation
SEIDbDIR - Susceptible Exposed Infected Dead Buried Dead Infected
SEILICDR - Susceptible Exposed Likely Infected Confirmed Infected Dead
Recovered
SEIHFR - Susceptible Exposed Infected Hospitalized Funeral Removed SEIR - Susceptible Exposed Infected Removed
SEIS - Susceptible Exposed Infected Susceptible SIR - Susceptible Infected Removed
SIIR - Susceptible Latent Infected Removed SIS - Susceptible Infected Susceptible SLLN - Strong Law of Large Numbers T - Tcell-mediated immunity USD - United States Dollar
UNICEF - United Nations of Children’s Fund WHO - World Health Organization
xxi
LIST OF SYMBOLS
$ - United States Dollar
Ro - Basic Reproduction Number
- Probability of InfectionT - Time
I t - Number of Infective at time t
S t - Number of Susceptible at time t
- States Space
- Infection/Transmission Rate
- Recovery rate
- Effective Contact Rate
k - Infective Individual
Rc, Reor Rt - Effective Reproduction Number 1k - Average Incubation Period
N - Total Effective Population Size
C
I N - Probability that Contact is made with Infectious Individual
CD4 T - Assist Other White Blood Cells in Immunologic Process
CD8 T - Destroy Virus Infected Cells and Tumour Cells L*(t,.) - Joint Distribution of the Number of Jobs Present at
time t
Vo(t,.) - Sojourn Time of a Tagged Job Placed in the
System at t under various initial conditions in terms of the Laplace transform with respect to t
d
T - Total Delay in the System
m
T - Average Time an Individual that is Infected Spends in the System
r
T - Recovery Time
N - Number of Infected Individuals in the System
E N - Expectation of Number of Individuals Infected in the System at Time t
E T - Expectation of Total Delay in the System
N t - Number of Individuals Infected in the System at Time t
A
N t - Number of Individuals Infected that Arrives at the System up to Time t,
D
N t - Number of Individuals Infected that Departs from the System up to Time t
m
T
- Mean Time an Infected Individual Spends in the System
nP
- Inter-arrival Probability Density Function1/λ - Mean of Inter-arrival Probability Density Function 1/λ2 - Variance of Inter-arrival Probability Density
Function i
Y - Sum of Poisson Random Variables for Independent Random Variables
n S
P - Partial Sum
n
N
- Number of Infected Individuals at Timen
Ω1 - System that Every Exposed Individual EntersΩ2 - Each Infected Individual Leaves Ω1 and Enters
another System Ω2
Hrs - Hours
- Small Change
Q - Quasi-Stationary Distribution
,
m n
xxiii
Exposed,
n
Infected Personsm - Exposed
n - Infected Person
E t - Number of Exposed at Time
t
T
I t - Total Number of Infected Persons at Time
t
T k
P - Total Probability for kth Infective
X X1, 2,...
- Series of Nonnegative, Independent andIdentically Distributed Random Variable
- Infinity
m t - Mean-Value or the Renewal Function
- Probability that Specific Person is in Infectious Statelim t
- Limit as t tends to infinity
e - exponential
, L C m n n
- Limiting Ratio of time in which there werem
exposed, nL Likely Infected and nC Confirmed Infected Persons not being in the Absorbing State but Conditioning in the Processk
- Total Number of Infectious Persons for Quasi- Stationary DistributionL
n - Number of Likely Infected
C
n - Number of Confirmed Infected
E I I, ,L C
- The State Space of Number of Exposed, Likely Infected and Confirmed Infected Persons
LI t - Number of Likely Infected at Time
t
C
I t - Number of Confirmed Infected at Time
t
, L,C m n n
P - Probability of the Joint Quasi-Stationary
Distribution
! - Factorial
C
I N
Enter the Exposed State
1k - Average Incubation Period
L
- Rate at which Individual Move from Likely Infected to Confirmed Infected StateC
- Rate at which Individual Move from Confirmed Infected to Death or Recovery State
- Beginning of Intervention Time
- Control of Rate of Transmission0
t - Initial Outbreak Time
f x - Function of
x
F
- Rate of Appearance of New Infections in the CompartmentV - Rate of Transfer of Individuals into and out of Compartment
1
- Rate at which Individual Progress from Exposed to. Likely Infectious Individuals2
- Rate at which Individual Progress from Likely Infected to Confirmed Infectious Individuald - Death Rate
1
- Control Rate for Exposed Individuals2
- Control Rate for Confirmed Infectious Individualsq
- Successful Control Infectious individuals
p
1
q
- Unsuccessful Control Infectious Individuals .E - Differential of Exposed
.
L
I - Differential of Likely Infected
.
C
I - Differential of Confirmed Infected
.
S - Differential of Susceptible
.
/
D R - Differential of Dead/Recovery
- Spectral Radius of Matrix 1xxv
0
x - Jacobian Matrix
0
( )
Df x - Derivative
f x
Evaluated at the Disease Free EquilibriumE
P - Probability of Exposed
L I
P - Probability of Likely Infected
C I
P - Probability of Confirmed Infected
S
P
- Probability of Susceptible/
D R
P
- Probability of Dead/RecoveryT
- TransmissibilityC
T - Critical Transmissibility or Epidemic Threshold
c
- Mean Degree2
c - Mean Square Degree
0
G h
- Probability Generating Functions for a Degree 1c - Excess Degree
c
- Mean Degree Absolute valuee
c - Mean Excess Degree Absolute Value
e - Average Size of an Outbreak Absolute Value
E - Probability of a Full-Blown Epidemic
l - Probability that the Person at the End of an Edge or Line Does Not Have the Disease
c
r - Probability that a Patient Zero with Degree
c
will Start an Epidemic or Probability that Transmission of the Disease Along at Least One of the Edges Originating from the New Node or Vertex will Lead to an Epidemic1T - Probability that the Disease Does Not Get Transmitted Along the Edge
a Full- Blown Epidemic, for Any One of its
c
Edges
1
1 N 1 ci i r
- Probability that an Outbreak of Size N will Kindle an Epidemicc
xxvii
LIST OF APPENDICES
APPENDIX TITLE PAGE
A Generation of Basic Properties of Queueing Theory from EVD Data (Guinea, Liberia and Sierra Leone)
Using M/M/1 Queueing Model 186
B MATLAB Code for SEILICDR Epidemic Model and
Contour Diagram for Guinea, Liberia and Sierra Leone 193 C Proposed SEILICDR Compartmental Model Code
(Before and After Intervention for Guinea, Liberia and
Sierra Leone) 197
D Critical Transmissibility, Transmissibility and
Probability of Network Infected 201
CHAPTER 1
1INTRODUCTION
1.1 Overview of the Research Problem
Ebola Virus Disease (EVD) is a disease caused by infection with the virus of the family Filoviridae, genus Ebola virus (Feldmann et al., 2011). It is one of the greatest challenges mankind has faced since inception of the world. The toughness of the challenge might be linked to the ways the disease transmits from place to place and from person to person.
Transmission is the unbroken sequence of event by a system. According to Lahm et al. (2007) and Walsh et al. (2003), Ebola outbreaks and transmission among humans has been associated with direct exposure to fruit bats and mortality among other wild animals, which tend to succumb to the infection. Once there is an outbreak, it can easily be transmitted from person to person. Subsequently, humans need to adopt some control measures to avoid further transmission and possible eradication of the disease. The quest to provide some control measures has attracted some researchers to develop various EVD transmission and control models.
A model is a physical, mathematical, or logical representation of a system, entity, phenomenon, or process. EVD models such as SIR (Susceptible, Infected, Removed), and others such as SEIR (Susceptible, Exposed, Infected, Removed), SEIDbDIR (Susceptible, Exposed, Infected, Dead Buried, Dead Infected, Removed),
2
derived from basic epidemiological model SIR, were used by researchers. Researchers use Removed to mean those who recuperate or die from the illness. In the proposed research there is provision for Death and Recovery phases. However, these models are not suitable to be used because they do not accommodate the transmission phases of Ebola. Thus, model that would accommodate the transmission phases and be able to explain EVD transmission and control reliably in the real world is needed. According to WHO (2014a), WHO (2014b), WHO (2015a), CDC (2014a), Goeijenbier el al. (2014), Hass (2014), Alan (2013) and Singh (2014), EVD transmission phases are: Susceptible, Exposed, Likely Infected, Confirmed Infected, Dead, Recovery (SEILICDR). Therefore, in this study, the SEILICDR model of EVD
transmission is proposed through queueing theory. Queueing theory is the mathematical study of waiting lines, or queues (Sztrik, 2012). It deals with the analysis of serving customers arriving to a facility with a fixed number of servers (Hernandez-Suarez et al., 2010). M/M/1 queueing model is applied which refers to the way the disease is transmitted, that is, infection is from one stage to another. For example, in SEILICDR model an infected individual has to pass through the
/
L C
1.2 Motivation
Ebola Virus Disease currently has no known effective treatment or vaccine. Stadler et al. (2014) argued that supportive care and disease containment is the only available focus of relief efforts in bringing down the case fatality in case of any outbreak. Ebola outbreak has affected adversely the economy of the affected West African countries. Nwaoga (2014) revealed that Nigeria government spent USD11.875 million (United States Dollar) on the fight against EVD as of August 2014. Furthermore, United State government has committed USD175 million, partnering with the United Nations and other international partners to help the government of Guinea, Liberia, Sierra Leone, Nigeria, and Senegal. On the other hand, World Health Organisation (WHO) has spent USD1 billion so far (WHO, 2014c). The United Nations of Children’s Fund (UNICEF) spent USD65 million in Liberia, USD61 million in Sierra Leone, and USD55 million in Guinea (UNICEF, 2014a, b). Additional USD10 million was also mapped out to the neighbouring countries to get them prepared for potential spread of the disease within their borders, with the remaining USD9 million required for regional coordination efforts (WHO, 2014c; UNICEF, 2014a,b). Table 1.1 shows expenses of countries and organisations on combating Ebola Virus Disease.
Table 1.1 : Country/Organisation Expenditure on Ebola Virus Disease
Country/Organisation Amount $(USD)
Nigeria 11.875million
United State, United Nations, and other partners
175 million
WHO 1 billion
UNICEF 65 million (Liberia)
61 million (Sierra Leone) 65 million (Guinea)
4
The high death rate is another worry. Information gathered from WHO (2014a) and WHO (2015a) Ebola Data and Statistics showed that in February 2015 there were 3155 total cases and 2091 total death. In March 2015, there were 3429 total cases and 2263 total death and in April, there were 3548 total cases and 2346 total death for Guinea as shown in Figure 1.1.
Figure 1.1 : Record of EVD in Guinea.
Figure 1.2: Record of EVD in Liberia.
6
Figure 1.3 : Record of EVD in Sierra Leone.
Therefore, it has been shown in Table 1.1, Figures 1.1, 1.2, and 1.3 that a study for evident transmission of EVD is extremely important in order to find out the best ways to minimise the disaster caused by the disease. For example, in Figure 1.3 Sierra Leone has smaller number of death/cases compared to Guinea in Figure 1.1 and Liberia in Figure 1.2 because the outbreak started later which is May 2014 in Sierra Leone, December 2013 in Guinea and March 2014 in Liberia.
1.3 Background of the Research
As a result of the above mentioned problems, some researchers have carried out studies in finding possible means of eradicating EVD transmission in the affected areas. The studies can be divided into three criteria.
1.3.1 Outbreak, Transmission and Control
Siettos et al. (2015) developed an agent-based model to study the 2014 Ebola virus epidemic outbreak, transmission and control in Liberia and Sierra Leone. They employed equation free approach to assign estimates to key epidemiological variables. Their data was derived from WHO Ebola Data and Statistics. The proposed model was found reliable for future EVD prediction in Liberia and Sierra Leone. However, equation free algorithms are generally not accurately expressed. In addition, all agent-based approach comes with high computational cost (Kelso & Milne, 2011).
Gomes et al. (2014) assessed the international spreading risk associated with the 2014 West African Ebola outbreak. They used the global epidemic and mobility model to generate stochastic individual based simulation. They found out that the extension of the outbreak is more likely occurring in African countries, increasing the risk of international dissemination on a longer time scale. However, it is difficult to use the approach for complex simulation and as such Gomes et al. (2014) used short term data only in their study.
1.3.2 Intervention
8
forecasted the progression of Ebola. The researchers also looked at the effectiveness of numerous interventions such as increased contact tracing, improved infections control practices and the use of a hypothetical pharmaceutical intervention to improve survival of hospitalized patients. They found out that there is increasingly severe epidemic with no sign of having reached the peak as at 31st December 2014. However, ordinary differential equation based models describe reality with varying accuracy (Isberg, 2012).
1.3.3 Queueing Analysis
The theory of queues and its analysis by the method of imbedded Markov chain was proposed by Kendall (1953). He used the technique to show the relationship between M/G/1 queues and; birth and death process. Subsequently, Kitaev (1993) proposed a processor-sharing model to find the relation between birth and death processes and the M/G/1 queues with processor sharing. Furthermore, Ball and Donnelly (1995) used M/G/1 theory to find total cost of the epidemic. Hernandez-Suarez et al. (2010) applied queueing theory to SIS (Susceptible, Infected, Susceptible) and SEIS (Susceptible, Exposed, Infected, Susceptible) epidemic models. However, their concern was on general epidemic. It is good to mention that each epidemic has its own special characteristics.
As can be seen, researchers have developed various epidemic based model of Ebola virus, mainly for Liberia and Sierra Leone. Their models were derived from the original SIR model proposed in 1932 as cited in Bashar et al. (2015). Some of the researchers extended the model to accommodate latent property of the Ebola virus during incubation period. But their models did not cover all the necessary EVD transmission phases.
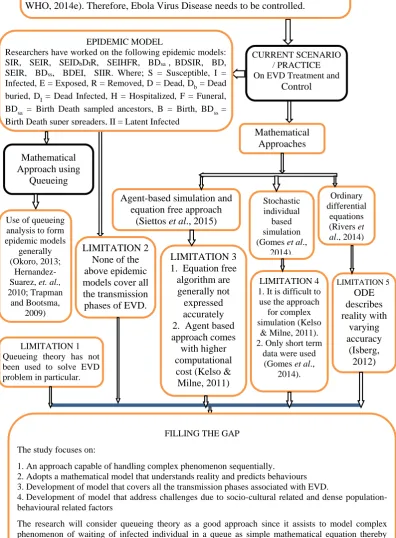
10
EPIDEMIC MODEL
Researchers have worked on the following epidemic models: SIR, SEIR, SEIDbDIR, SEIHFR, BDsa , BDSIR, BD,
SEIR, BDss, BDEI, SIIR. Where; S = Susceptible, I =
Infected, E = Exposed, R = Removed, D = Dead, Db = Dead buried, DI = Dead Infected, H = Hospitalized, F = Funeral, BDsa = Birth Death sampled ancestors, B = Birth, BDss = Birth Death super spreaders, II = Latent Infected
LIMITATION 5 ODE describes reality with varying accuracy (Isberg, 2012) Mathematical Approaches MOTIVATION
Ebola virus epidemic has led to the death of many people in West Africa and affected the economy of the affected countries adversely. The outbreak constitutes a Public Health Emergency of International Concern (WHO, 2014d; WHO, 2014e). Therefore, Ebola Virus Disease needs to be controlled.
LIMITATION 4 1. It is difficult to use the approach
for complex simulation (Kelso
& Milne, 2011). 2. Only short term
data were used (Gomes et al.,
2014).
LIMITATION 3 1. Equation free algorithm are generally not expressed accurately 2. Agent based approach comes with higher computational cost (Kelso & Milne, 2011)
CURRENT SCENARIO / PRACTICE On EVD Treatment and
Control
FILLING THE GAP The study focuses on:
1. An approach capable of handling complex phenomenon sequentially.
2. Adopts a mathematical model that understands reality and predicts behaviours 3. Development of model that covers all the transmission phases associated with EVD.
4. Development of model that address challenges due to socio-cultural related and dense population- behavioural related factors
The research will consider queueing theory as a good approach since it assists to model complex phenomenon of waiting of infected individual in a queue as simple mathematical equation thereby reducing computational cost, describe the real nature of the disease, predicts its behavior and helps in capacity planning decision (Damon, 2016)
Ordinary differential
equations (Rivers et al., 2014)
Agent-based simulation and equation free approach
(Siettos et al., 2015)
Stochastic individual based simulation (Gomes et al.,
2014).
LIMITATION 2
None of the above epidemic models cover all the transmission phases of EVD. Mathematical
Approach using Queueing
Analysis
Use of queueing analysis to form epidemic models
generally (Okoro, 2013;
Hernandez-Suarez, et. al.,
2010; Trapman and Bootsma,
2009)
LIMITATION 1 Queueing theory has not been used to solve EVD problem in particular.
1.4 Statement of the Problem
Ebola Virus Disease is a complex and unprecedented epidemic killer disease. Recently, the disease has caused serious loss of life, waste of economy and material resources in West African nations like Nigeria, Senegal, Liberia, Sierra Leone and Guinea (WHO, 2014d). A lot of mathematical theories and models such as agent-based model, model agent-based on ordinary differential equation for necessary assessment studies and intervention measures have been proposed by several researchers on ways to handle outbreak of the disease (Chowell and Nishiura, 2014). The researcher is of the opinion, that if EVD and its effects are not carefully studied and managed, it will claim immeasurable number of lives and properties within West Africa and her neighbours in no distant time. Therefore, a model that is capable of explaining the real nature of EVD transmission is needed.
As a result of the transmission mode and deadly nature of the disease, this study proposes an EVD transmission and control model based on queueing theory that considers all the transmission phases in order to understand the real nature of the disease and predict its behaviour. A queueing theory based compartmental model that explains individual queues of EVD and a queueing theory based network model to explain network of EVD queues in the three most affected countries are developed. Compartmental model is based on subdividing the population under consideration into various sections, while queueing network model is an interconnected collection of stations and contact network is applied. Therefore contact exist in designated stations which involves use of urban contact network such as household, shopping centre, religious centre, schools, workplaces and hospitals in a given community.
1.5 Research Questions
12
1. How would queueing theory be applied to determine Ebola Virus Disease transmission pattern?
2. How would all transmission phases and behaviours of EVD be described through developed queueing theory based SEILICDR (Susceptible, Exposed,
Likely Infected, Confirmed Infected, Dead, Recovery) model?
3. How would SEILICDR based compartmental model using the queueing theory
approach be obtained for EVD analysis?
4. How would SEILICDR based network model using the queueing theory
approach be obtained for EVD analysis?
1.6 Objectives of the Study
The aim of the study is to develop queueing theory based EVD transmission and control model. The specific objectives are:
1. To determine Ebola Virus Disease transmission patterns and possible control measures using the basic properties of queueing theory.
2. To develop SEILICDR (Susceptible, Exposed, Likely Infected, Confirmed
Infected, Dead, Recovery) model, for adequate description of all transmission phases and behaviours of EVD using queueing theory.
3. To obtain SEILICDR based compartmental model using the queueing theory
approach for EVD analysis.
4. To obtain SEILICDR based network model using the queueing theory
approach for EVD analysis.
1.7 Scope of the Research
Ebola Virus Disease transmission patterns and possible control measures will be determined using the basic properties of queueing theory. A three dimensional model of SEILICDR Ebola epidemic will be developed, solved and analysed to
develop, solve and analyse the compartmental model and network model in determining the EVD transmission dynamics and control measures. The study considered the three most affected countries in West Africa (Guinea, Liberia and Sierra Leone). The EVD data documented by the World Health Organisation was trusted in finding the input parameters of the model.
1.8 Significance of the Research
Previous researchers applied models on one and two dimensional approach, on the other hand this study developed SEILICDR model which is three dimensional.
Likewise other studies applied an agent-based model and equation free approach, the global epidemic and mobility model, and ordinary differential equations which cannot understand the real nature of the Ebola Virus Disease and predict its behaviour. Alternatively, this study adopted queueing theory which can make better predictions.
The real nature of the disease was understood through the use of the developed model and its behaviour was predicted. It also determined the Ebola Virus Disease transmission patterns. These findings will be of benefit to the World Health Organisation, institutions of higher learning, nations of the world especially West African nations.
The research findings will form part of essential EVD database for World Health Organisation. The organisations will refer to the information provided in the research findings in taking decisions concerning future EVD outbreak whenever it occurs.
14
Nations of the world, especially West African nations will utilize the model to combat EVD outbreak anytime it occurs. They will use the model to predict possible transmission pattern of the disease and also proffers controlling measures to address the outbreak.
1.9 Thesis Organisation
The thesis is classified into eight chapters. The organisation is as follows: Chapter 1 consists of overview of the research problem, motivation, background of the research, statement of the problem, research questions, objectives of the study, scope of the research and significance of the research. This chapter gives understanding on the research work under consideration.
Chapter 2 provides comprehensive literature review based on the research topic. The literature reviewed covers the general overviews on Ebola Virus Disease transmission and control. The chapter further describes the brief history of Ebola Virus Disease, outlined possible effects of Ebola Virus Disease, control measures and other epidemic diseases. This chapter provides a description, summary, and critical evaluation of surveys books, scholarly article, and any other sources relevant to a particular issue about the study, area of research, or theory in relation to research problem being investigated.
Chapter 4 discusses the generation of the basic properties of queueing process from EVD data (Guinea, Liberia and Sierra Leone) using M/M/1 queueing model, test of exponentiality, queueing theory governing equation, application of queueing technique to EVD problem and analysis of Guinea, Liberia and Sierra Leone 2014 EVD outbreak. This chapter determines Ebola Virus Disease transmission patterns and possible control measures using the basic properties of queueing theory.
Chapter 5 covers the development of SEILICDR model, SIS and SEIS based
Quasi-Stationary Distribution; Quasi-Stationary Distribution of the proposed SEILICDR model; SEILICDR model of the number of Exposed, Likely Infected and
Confirmed Infected persons for marginal joint Quasi-Stationary Distributions; analysis of the developed SEILICDR model for adequate description of all
transmission phases and behaviours of EVD using queueing theory and validation of the proposed SEILICDR model.
Chapter 6 discusses the development of the SEILICDR compartmental model;
application of the SEILICDR compartmental model in EVD cases using Guinea,
Liberia, and Sierra Leone as case studies; and application of queueing theory approach to SEILICDR compartmental model. This model explains traditional
epidemiological analysis that is based on subdividing the population under consideration into various sections. Application of compartmental model to Ebola Virus Disease (EVD) will result in estimating of the fundamental quantity called the basic reproduction number, R0 which is the number of secondary infections produced by a typical cases of an infection in a population that is totally Susceptible. The value above one means outbreak should flicker to large-scale epidemic. The model is validated using Chi-Square.
Chapter 7 highlights SEILICDR queueing networks, multiple channel open
16
persons. The model is validated using urban contact network analysis, since it offers a high degree of realism.
Chapter 8 provides the summary of the research work and conclusion of the entire research work based on the results obtained in Chapters 4, 5, 6 and 7. It also discusses the contributions, limitations of the study and recommendations for future research work.
EPIDEMIC MODEL Researchers have worked on the following epidemic models:
SIR, SEIR, SEIDbDIR,
SEIHFR, BDsa , BDSIR, BD,
SEIR, BDss, BDEI, SIIR.
Where; S = Susceptible, I = Infected, E = Exposed, R = Removed, D = Dead, Db =
Dead buried, DI = Dead
infected, H = Hospitalized, F = Funeral, BDsa = Birth death
sampled ancestors, B = Birth, BDss = Birth dead super
REFERENCES
Alan, M. (2013). Hunter's Tropical Medicine and Emerging Infectious Diseases. (9th ed). New York: Saunders.
Althaus, C. L., (2014). Estimating the Reproduction Number of Ebola Virus (EBOV) During the 2014 Outbreak in West Africa. Public Library of Science Currents Outbreaks.
Doi:10.1371/currents.outbreaks.91afb5e0f279e7f29e7056095255b288.
Anderson, R. M. and May, R. M. (1991). Infectious Diseases of Humans. Oxford: Oxford University Press.
Anderson, H. and Britton, T. (2000). Stochastic Epidemics in Dynamic Populations: Quasi- Stationarity and Extinction. Journal Mathematical Biology. 41: 559-580. Astacio, J., Briere, D., Guillen, M., Martinez, J., Rodriguez, F., and
Valenzuela-Campos, N. (1996). Mathematical Models to Study the Outbreaks of Ebola. https://dspace.library.com 1996. Retrieved October, 2014.
Baize, S., Pannetier, D., Oestereich, L., Rieger, T., Koivogui, L., Magassouba, N., Soropogui, B., Sow, M. S., Keïta, S., Clerck H. D., Tiffany, A., Dominguez, G., Loua, M., Traore, A., Kolie, M., Malano, E. R., Heleze, E., Bocquin, A., Mely, S., Raoul, H., Caro, V., Cadar, D., Gabriel, M., Pahlmann, M., Tappe, D., Schmidt-Chanasit, J., Impouma, B., Diallo, A. K., Formenty, P., Herp M. V., and Gunther, S. (2014). Emergence of Zaire Ebola Virus Disease in Guinea. The New England Journal of Medicine. 371(15): 1418-25.
Ball, F. and Donnelly, P. (1995). Strong Approximations for Epidemic Models. Stochastic Processes and their Applications. 55: 1-21.
175
Bashar, S., Percy, M., and Singhai, R. (2015). Predicting the 2014 Ebola Outbreak in
West Africa Using Network Analysis. News.
updatephotos.com/ebola_breakout_in_africa. Retrieved May 2015.
BBC News (2014). Test Positive for Ebola in Liberia (2 of 5), Liberian Observer, 31 March 2014. http://www.liberianobserver.com. Retrieved 9 October, 2016. BBC News (2016). Ebola: Mapping the Outbreak. www.bbc.com/news/world-africa.
Retrieved October 2016.
Blower, S. M., Small, P. M. and Hopewell, P. C. (1996). Control Strategies for Tuberculosis Epidemics: New Models for Old Problems. Science. 273: 497. Bolch, G., Greiner S., De Meer H., Trivedi K. S. (2006). Queueing Networks and
Markov Chains. (2nd edition). USA: John Wiley. ISBN 978-0-7923-9650-5. Brauer, F. and Castillo-Chavez, C. (2012). Mathematical Models in Population
Biology and Epidemiology. (2nd ed.). London: Springer.
Briand, S., Bertherat, E., Cox, P., Formenty, P., Kieny, M. P, Myhre, J. K., Roth C., Shindo, N., and Dye, C. (2014). The International Ebola Emergency. New England Journal of Medicine. 371(13): 1180-3.
Bwaka, M. A., Bonnet, M., Calain, P., Colebunders, R., Roo, A. D., Guimard, Y., Katwiki, K. R., Kibadi, K., Kipasa, M. A., Kuvula, K. J., Mapanda, B. B., Massamba, M., Mupapa, K. D., Muyembe-Tamfum, J., Ndaberey, E., Peters, C. J., Rollin, P. E., and Enden, E.V. (1999). Ebola Haemorrhagic Fever in Kikwit, Democratic Republic of Congo: Clinical Observations in 103 Patients. The Journal of Infectious Diseases. 179: 1-7.
Castillo-Chavez, C. and Feng, Z. (1997). To Treat of Not to Treat: The Case of Tuberculosis. Journal of Mathematical Biology. 35: 629*
CDC (2014a). Ebola Hemorrhagic Fever Signs and Symptoms. http://www.cdc.gov/vhf/ebola/symptoms/index.html. Retrieved 28 May 2016.* CDC (2014b). Outbreaks Chronology: Ebola Virus Disease.Centers for Disease
Control and Prevention (CDC), Atlanta, USA. https://www.cdc.gov. Retrieved 10 March 2015.
CDC (2014c). Previous Updates: 2014 West Africa Outbreak.
CDC (2015). Review of Human-to-Human Transmission of Ebola Virus. Center for Disease Control and Prevention, MMWR, Morbidity and Mortality Weekly Report. www.cdc.gov. Retrieved November, 2015.
Central Intelligence Agency (2016). CIA world Factbook. https:www.cia.gov/library/publications/the-world-factbook/. Retrieved 2nd January 2017.
Chigbu, U. E., and Ntiador, A. M. (2014). Ebola in West Africa: Implications on Community Interaction in Urban Nigeria. International Journal of Education and Research. 2(10): 329-346.
Chowell, G., Hengartner, N. W., Castillo-Chavez, C., Fenimore, P. W., and Hyman, J. M. (2004). The Basic Reproduction Number of Ebola and the Effects of Public Health Measures: The Cases of Congo and Uganda. Journal of Theoretical Biology. 229(1): 119-26.
Chowell, G., and Nishiura, H. (2014). Transmission Dynamics and Control of Ebola Virus Disease (EVD): A Review. Medicine for Global Health. BMC Medicine.12(1): 196.
CHRD (2015). Centre for Health Research and Diagnostics Guinea. www.dwu.ac.pg>index.php>centre. Retrieved 2nd January 2017.
CNN (2014). Ebola: Patient Zero was a Toddler in Guinea-CNN.com.
http://edition.cnn.com/2014/10/28/health/ebola-patient-zero/index.html. Retrieved 9 October 2016.
Cooper, R. B. (1981). Introduction to Queueing Theory (2nd Edition). Elsevier North Holland, Inc. New York: Oxford.
Damon, V. (2016). The Pros and Cons of Queueing Theory. http://classroom.synonym.com/pros-cons-queueing-theory-8535781.html.
Retrieved 9 October, 2016.
Darroch, J. N. and Seneta, E. On Quasi-stationary Distribution in Absorbing Continuous-time Finite Markov Chains (1967). Journal of Applied Probability. 4: 192-196.
177
Dowell, S. F., Mukunu, R., Ksiazek, T. G., Khan, A. S, Rollin, P. E., and Peters, C. J. (1999). Transmission of Ebola Haemorrhagic Fever: A Study of Risk Factors in Family Members, Kikwit Democratic Republic of the Congo 1995. The Journal of Infectious Diseases. 179: S87-S91.
Driessche, P. V. D and Watmough, J. (2001). Reproduction Numbers and Sub-threshhold Endemic Equilibria for Compartmental Models of Disease Transmission. Mathematical Biosciences. 180: 29-48.
IBT (2014). Ebola Outbreak Blamed on Infected Bushmeat; First Family to Catch Virus Hunted Bats. International Business Times. http://au.ibtimes.com/articles/570107/20141020/bushmeat-ebola-outbreak-fruit-bats.htm#.VEaivSihFnU. Retrieved 9 October 2016.
European Food Safety Authority. (2014). An Update of the Risk of Transmission of Ebola Virus (EBOV) Via the Food Chain. EFSA Journal. 12(11): 3884.
Feldmann, H., and Geisbert, T. W. (2011). Ebola Haemorrhagic Fever. Lancet. 377: 849-62.
Fisman, D., Khoo, E., Tuite, A. (2014). Early Epidemic Dynamics of the West African 2014 Ebola Outbreak: Estimates Derived with a Simple Two-Parameter Model. Public Library of Science Currents Outbreaks. Doi: 10. 1371/currents.outbreaks.89c0d3783f36958d96ebbae97348d571.
Francesconi, P., Yoti, Z., Declichs, S., Onek, P. A., Fabiani, M., Olango, J., Andraghetti, R., Rollin, P. E., Opira, C., Greco, D., and Salmaso, S. (2003). Ebola Haemorrhagic Fever Transmission and Risk Factors of Contacts, Uganda. Emerging Infectious Diseases. www.cdc.gov/eid. 9(11). Retrieved October, 2014.
Surveillance Elucidates Ebola Virus Origin and Transmission during the 2014 Outbreak. Science. 345(6202): 1369-72.
Google (2015). EVD Affected Districts in Guinea, Liberia and Sierra Leone. (https://www.google.com). Retrieved 9 October 2016.
Grady, D., and Fink, S. (2014). Tracing Ebola's Breakout to an African
2-Year-Old. The New York Times.
http://www.nytimes.com/2014/08/10/world/africa/tracing-ebolas-breakout-to-an-african-2-year-old.html. Retrieved 9 October, l2016.
Goeijenbier, M., van Kampen, J. J., Reusken, C. B., Koopmans, M. P. and van Gorp, E. C (2014). Ebola Virus Disease: A Review on Epidemiology, Symptoms, Treatment and Pathogenesis. Nethlands Journal of Medicine. 72(9): 442–8. Gomes, M. F. C., Piontti, A. P., Rossi, L., Chao, D., Longini, I., Halloran, M. E., and
Vespignani, A. (2014). Assessing the International Spreading Risk Associated with the 2014 West African Ebola Outbreak. Public Library of Science Currents Outbreaks. doi: 10.1371/currents.cd818f63d40e24aef769dda7df9e0da5.
Graw, F., Leitner, T., and Ribeiro, R. M. (2012). Agent-Based and Phylogenetic Analyses Reveal How HIV-1 Moves between Risk Groups: Injecting Drug Users Sustain the Heterosexual Epidemic in Lativa . Elsevier, Epidemics. 4: 104-116. Guinea Age Structure (2016). www.indexmundi.com/guinea/age_structure.html.
Retrieved 2nd January 2017.
Guinea Unemployment Rate (2017).
https://www.google.com/webhp?sourceid=chrome-instant&ion=1&espv=2&ie=UTF-8#q=guinea+unemployment+rate. Retrieved 2nd January 2017.
Haas, C. N. (2014). On the Quarantine Period for Ebola Virus. Public Library of
Science Currents Outbreaks.
doi:10.1371/currents.outbreaks.2ab4b76ba7263ff0f084766e43abbd89.
Hernandez-Suarez, C. and Castillo-Chavez, C. (1999). A Basic Result on the Integral for Birth-Death Markov Processes. Mathematical Biosciences. 161: 95-104. Hernandez-Suarez C. M., Castillo-Chavez C., Lopez O. M., and Hernandez-Cuevas
K. (2010). An Application of Queueing Theory to SIS and SEIS Epidemic Models. Mathematical Biosciences and Engineering. 7(4): 809-823.
http://www.ibtimes.com/ebola-patient-zero-179
emile-ouamouno-guinea-first-contract-disease-1714698. Retrieved 9 October 2016.
IRF (2010). International Religious Freedom Report 2010: Liberia. United States Department of State. http://www.state.gov/g/drl/rls/irf/2010/148698.htm. Retrieved October 9, 2016.
Isberg E. (2012). Are Differential Equations the Proper Tool to Describe Reality? www.researchgate.net. Retrieved 19 May, 2015.
Johnston, W. M. (2015). Statistics on the 2014 - 2015 West Africa Ebola Outbreak. http://www.johnstonsarchive.net>policy>westafrica. Retrieved 18 September 2016.
Kelso, J. K. and Miline, G. J. (2011). Stochastic Individual-Based Modelling of Influenza Spread for the Assessment of Public Health Interventions. 19th International Congress on Modelling and Simulation, Perth, Australia. 12-16 December 2011. http://mssanz.org.au/modsim2011.
Kendall, D. (1953).Stochastic Processes Occurring in the Theory of Queues and their Analysis by the Method of the Imbedded Markov Chain. The Annals of Mathematical Statistics. 24: 338-354.
Khan, A. S., Tshioko, K., Heymann, D. L., Guenno, B. L., Nabeth, P., Kerstiens, B., Fleerackers, Y., Kilmarx, P. H., Rodier, G. R., Nkuku, O., Rollin, P. E., Sanchez, A., Zaki, S. R., Swanepoel, R., Tomori, O., Nichol, S. T., Peters, C. J., Muyembe-Tamfum, J. J., and Ksiazek, T. G. (1999). The Reemergence of Ebola Haemorrhagic Fever, Democratic Republic of the Congo, 1995. The Journal of Infectious Disease. 179: S76-S86.
Kiskowski, M. A. (2014). A Three-Scale Network Model for the Early Growth Dynamics of 2014 West Africa Ebola Epidemic. Public Library of Science
Current Outbreaks.
Doi:10.1371/currents.outbreaks.c6efe8274dc55274f05cbcb62bbe6070.
Kitaev, M. (1993). The M/G/1 Processor-Sharing Models: Transient Behaviour. Queueing Systems. 14: 239-273.
Kryscio, R. J. and Lefevre, C. (1989). On the Extinction of the S-I-S Stochastic Logistic Epidemic. Journal of Applied Probability. 26: 685-694.
Fever in Gabon, 1994 and 2003. Transactions of the Royal Society of Tropical Medicine and Hygiene. 101: 64-78.
Legrand, J., Grais, R. F., Bolle, P. Y., Valleron, A. J., and Flahault, A. (2007). Understanding the Dynamics of Ebola Epidemics. Epidemiology and Infection. 135(4): 610-621.
Lekone, P. E., and Finkenstadt, B. F. (2006). Statistical Inference in a Stochastic Epidemic SEIR Models with Control Intervention: Ebola as a Case Study. Biometrics. 62(4): 1170-7.
Lewnard, J. A., Ndeffo Mbah, M. L., Alfaro-Murillo, J. A., Altice, F. L., Bawo, L., Nyenswah, T. G., and Galvani, A. P. (2014). Dynamics and Control of Ebola Virus Transmission in Montserrado, Liberia: A Mathematical Modelling Analysis. Lancet Infectious Diseases. 14:1189-95.
Liberia Age Structure (2016). www.indexmundi.com/liberia/age_structure.html. Retrieved 2nd January 2017.
Liberia Unemployment Rate (2017).
https://www.google.com/webhp?sourceid=chrome-instant&ion=1&espv=2&ie=UTF-8#q=liberia+unemployment+rate. Retrieved 2nd January 2017.
Liu, Y. (1994). Queueing Networks as Models of Human Performance and Human-Computer Interaction. Proceedings of the 1994 Symposium on Human Interaction with Complex Systems. Department of Industrial and Operations Engineering, University of Michigan, USA. Technical Report 93-32. 1-15. Mackay, I. M., and Arden, K. E. (2015). Ebola Virus in the Semen of Convalescent
Men. The Lancet Infectious Diseases. 15(2). S149-S150.
McElroy, A. K., Akondy, R. S., Davis, C. W., Ellebedy, A. H., Mehta, A. K., Kraft, C. S., Lyon, G. M., Ribner, B. S., Varkey, J., Sidney, J., Sette, A., Campbell, S., Stroher, U., Damon, I., Nichol, S. T., Spiropou, C. F., and Ahmed, R. (2015). Human Ebola Virus Infection Results in Substantial Immune Activation. PNAS (Proceedings of the National Academy of Sciences). United States of America, 112(15).
181
Merler, S., Ajelli, M., Fumanelli, L., Gomes, M. F. C., Piontti, A. P., Rossi, L., Chao, D. L., Longini, I. M., Halloran, M. E., and Vespignani, A. (2015). Spatiotemporal Spread of the 2014 Outbreak of Ebola Virus Disease in Liberia and the Effectiveness of Non-Pharmaceutical Interventions: A Computational Modelling Analysis. Lancet Infectious Diseases. 15: 204-11.
Meyers, L. A., Pourbohloul, B., Newman, M. E. J., Skowronski, D. M., and Brunham, R. C. (2005). Network Theory and SARS: Predictng Outbreak Diversity. Journal of Theoretical Biology. 232(1): 71-81.
MIDC (2009). Establishment of Medical Imaging and Diagnostic Centre in Freetown. www.rvo.nl>projecten>establishment. Retrieved 2nd January 2017. MSF (2014). Guinea: Ebola Epidemic Declared. MSF UK.
http://www.msf.org.uk/article/guinea-ebola-epidemic-declared. Retrieved 9 October 2016.
Nadhem, S., and Nejib, H. D. (2015). The Ebola Contagion and Forecasting Virus: Evidence from Four African Countries. Health Economics Review. 5:16.
Nasell, I. (1991). On the Quasi-stationary Distribution of the Ross Malaria Model. Mathematical Biosciences. 107:187.
Nasell, I. (1999). On the Quasi-stationary Distribution of the Stochastic Logistic Epidemic. Mathematical Biosciences. 156: 21-40.
Nassos, S. (2014). How World's Worst Ebola Outbreak Began with One Boy's Death. BBC News. http://www.bbc.co.uk/news/world-africa-30199004. Retrieved 9 October, 2016.
Ndanguza, D., Tchuenche, J. M., and Haario, H. (2013). Statistical Data Analysis of the 1995 Ebola Outbreak in the Democratic Republic of Congo. African Diaspora Journal of Mathematics. 24:55-68.
Newman, M. E. J. (2002). The Spread of Epidemic Disease on Networks. Physical Review E. 66, 016128.
NIH (2014). Genetics of the 2014 Ebola Outbreak. http://www.nih.gov/researchmatters/september2014/09152014ebola.htm.
Retrieved 9 October 2016.
Nishiura, H. and Chowell, G. (2014). Early Transmission Dynamics of Ebola Virus Disease (EVD), West Africa, March to August 2014. Eurosurveillance. 19(36). NPHIL (2014). National Public Health Institute of Liberia.
Nwaoga, C. T., Nche, G. C., and Nnadi, F. U. (2014). The Pervasiveness of Ebola Virus Disease in Africa: Implication for Economy, Ecology and Socio-Religious Dynamics. IOSR (International Organization of Scientific Research) Journal of Humanities And Social Science (IOSR-JHSS). 19(11): 69-77.
Okoro, O. J. (2013). On Markovian Queueing Model as Birth-Death Process. Global Journal of Science Frontier Research Mathematics and Decision Sciences. 13(11)1.0: 2249-4626.
Ovaskainen, O. The Quasistationary Distribution of the Stochastic Logistic Model (2001). Journal of Applied Probability. 38: 898-907.
Reuters (2014). Mystery Hemorrhagic Fever Kills 23 in Guinea. Reuters. 19 March 2014. http://www.reuters.com/article/2014/03/19/us-guinea-fever-idusbrea2i0qm20140319. Retrieved 9 October 2016.
Rivers, C. M., Lofgren, E. T., Marathe, M., Eubank, S., and Lewis, B. L. (2014). Modelling the Impact of Interventions on an Epidemic of Ebola in Sierra Leone and Liberia. Public Library of Science Current Outbreaks. 2014 Oct 16. Edition 1 doi: 10.1371/currents.outbreaks.fd38dd8507856540b0be3fcd78f5ccf.
Roddy, P., Howard, N., Van Kerkhove, M. D., Lutwama, J., Wamala, J., Yoti, Z., Colebunders, R., Palma, P. P., Sterk, E., Jeffs, B., Van Herp, M., and Borchert, M. (2012). Clinical Manifestation and Case Management of Ebola Haemorrhagic Fever Caused by a Newly Identified Virus Strain, Bundibugyo, Uganda, 2007-2008. Public Library of Science One. 7(12): e52986.
Ross, S. M. (2007). Introduction to Probability Models. (9th ed.). USA: Academic Press, Elsevier Inc.
Rowe, A. K., Bertolli, J., Khan, A. S., Mukunu, R., Muyembe-Tamfun, J. J., Bressler, D., Williams, J. J., Peters, C. J., Rodriguez, L., Feldmann, H., Nichol, S. T., Rollin, P. E., and Ksiazek, T. G. (1999). Clinical, Virologic, and Immunologic Follow-Up of Convalescent Ebola Haemorrhagic Fever Patients and their Household Contacts, Kikwit, Democratic Republic of the Congo. The Journal of Infectious Disease. 179: S28-S35.
Sierra Leone Age Structure (2016).
www.indexmundi.com/sierra_leone/age_structure.html. Retrieved 2nd January 2017.
Sierra Leone Unemployment Rate (2017).