The purpose of this study was to determine the extent to which evidence of two secondary transition predictors, paid employment and independent living, exist in the
by
Peter Joseph Vierno
A dissertation submitted to the Graduate Faculty of North Carolina State University
in partial fulfillment of the requirements for the Degree of
Doctor of Philosophy
Curriculum & Instruction
Raleigh, North Carolina 2013
APPROVED BY:
Dr. Edward Sabornie Dr. Tamara Young
Committee Chair
BIOGRAPHY
Peter Joseph Vierno was born December 21, 1970 in New Rochelle, NY. After spending his early years living in the Westchester County suburbs of New York City, and for a brief time in the suburbs of London, England, Peter graduated from Westfield High School in
ACKNOWLEDGEMENTS
This dissertation would not have been possible without the love and support of so many wonderful individuals. I am very appreciative of my doctoral committee members, Susan Osborne, Tamara Young, and Michael Maher. You have each provided insightful feedback during the dissertation process and helped make this a worthwhile learning process. I will always be grateful that I have had the opportunity to work with my committee chair and advisor, Ed Sabornie. Ed has done so much for me professionally. He has always been willing to listen and offer advice, not only while I was working on the dissertation, but throughout my years as a doctoral student.
In addition to my committee members, I want to thank all of the other instructors and fellow students from my classes who went out of their way to share experiences and give advice. I also want to express my sincere thanks to Irene Armstrong, who always helped me keep track of all the necessary forms and other paperwork I needed to complete. There are several colleagues in the Wake County Public School System’s Special Education Services department who have been very helpful, including Audrey Jones-Langston and Lorenzo Melton. I want to especially thank my friend and colleague, Mary White for her continued support during this process.
TABLE OF CONTENTS
LIST OF TABLES ... viii
LIST OF FIGURES ...x
CHAPTER 1. INTRODUCTION ...1
Post-school Outcomes of Students with Disabilities ...1
Evolution of Transition Definitions ...2
Evolution of Transition Legislation ...3
Evolution of Transition Planning Models ...5
Alternative Paths to Obtaining a Standard High School Diploma ...6
North Carolina’s Occupational Course of Study ...7
Significance of the Study ...9
Research Questions ...10
Overview of Methodology ...10
Delimitations ...11
Definitions of Terms ...11
Summary ...13
Overview of the Manuscript ...14
CHAPTER 2. REVIEW OF THE LITERATURE ...15
Career Development Theories ...15
Structural Theory ...15
Developmental Theory...16
Work Adjustment Theories ...16
Learning Theory...17
Conceptual Framework ...18
Ecological Model of Development ...18
Compliance in Transition Planning ...19
Transition Planning and a Student’s Disability Category ...20
Transition Goals and Activities ...24
Implementing Transition Plans into Practice ...26
Best Practices in Transition Planning ...27
Predictors of Post-school Outcomes ...29
Disability ...31
Gender ...35
Ethnicity ...37
CHAPTER 3. METHODS ...41 Population ...41 Sample...41 Instrument ...42 Data Scoring...43 Procedures ...45 Design ...48
Data Analysis ...49
Summary ...51
CHAPTER 4. RESULTS ...52
Sample...52
Evidence of Transition Predictors ...54
Predicting Full Evidence of Transition Predictors in IEPs ...62
Paid Employment ...63
Independent Living ...67
Summary ...71
CHAPTER 5. DISCUSSION ...72
Study Overview ...72
Summary of Findings ...73
Evidence of Paid Employment Activities in IEPs ...73
Predicting the Odds of Full Evidence of Paid Employment Activities in IEPs ...74
Evidence of Independent Living Activities in IEPs ...74
Predicting the Odds of Full Evidence of Independent Living Activities in IEPs ...75
Discussion of Findings ...75
Ecological Theory of Career Development ...75
Lack of Full Evidence in Transition Predictors ...76
Uniqueness of the Study ...78
Limitations ...78
Future Research ...79
Implications for Practice ...80
Conclusions ...83
APPENDIX ...96
Appendix A. IRB Approval ...97
Appendix B. Statement of Understanding ...98
LIST OF TABLES
Table 1. Operational Definitions for Transition Predictors ...44 Table 2. Summary of Data Analysis Based on Research Questions ...51 Table 3. Demographic Characteristics as a Percentage of the Overall
Sample (N = 548) ...52 Table 4. Individual Characteristics as a Percentage of Students on Each
Diploma Pathway ...53 Table 5. Descriptive Statistics for Transition Predictor Evidence for Each
Diploma Pathway ...55 Table 6. Number of Students on Each Diploma Pathway with Evidence of
Paid Employment Activities in IEPs, by Disability Category ...57 Table 7. Number of Students on Each Diploma Pathway with Evidence of
Independent Living Activities in IEPs, by Disability Category ...58 Table 8. Number of Students on Each Diploma Pathway with Evidence of
Paid Employment Activities in IEPs, by Ethnicity ...58 Table 9. Number of Students on Each Diploma Pathway with Evidence of
Independent Living Activities in IEPs, by Ethnicity ...59 Table 10. Number of Students on Each Diploma Pathway with Evidence of
Paid Employment Activities in IEPs, by Gender ...60 Table 11. Number of Students on Each Diploma Pathway with Evidence of
Independent Living Activities in IEPs, by Gender ...60 Table 12. Number of Students on Each Diploma Pathway with Evidence of
Paid Employment Activities in IEPs, by Age ...61 Table 13. Number of Students on Each Diploma Pathway with Evidence of
Independent Living Activities in IEPs, by Age ...62 Table 14. Ordinal Regression Results for Full Evidence of Paid Employment
Table 15. Adjusted Ordinal Regression Results for Full Evidence of Paid
Employment Activities in IEPs ...67 Table 16. Ordinal Regression Results for Full Evidence of Independent
Living Activities in IEPs ...69 Table 17. Adjusted Ordinal Regression Results for Full Evidence of
LIST OF FIGURES
Figure 1. IEP sequence: From a student’s transition activities to their
present level of performance to their annual goals ...44 Figure 2. Percentages of students on Future Ready and Occupational
Course of Study diploma pathways who show evidence of paid
CHAPTER 1 INTRODUCTION
Post-school Outcomes of Students with Disabilities
Graduation from high school is a significant milestone for any student. For students with disabilities, evidence suggests that this is a particularly difficult time. Students with disabilities transitioning from high school to adult roles lag behind their peers without disabilities in obtaining successful post-school outcomes (Blackorby & Wagner, 1996; Newman, Wagner, Cameto, & Knokey, 2009). The National Longitudinal Transition Study (NLTS) was the first attempt at collecting data on more than 8,000 students with disabilities by following their experiences from the late 1980s to the early 1990s (Blackorby & Wagner, 1996). Data were collected through phone interviews of students and parents, teacher surveys, and reviewing school records to determine post-school outcomes in employment, and independent living. They found that students with disabilities were engaged in full time employment at a lower rate than their peers without disabilities (57% compared to 69%) between three and five years out of high school (Blackorby & Wagner, 1996). In addition, youth with disabilities experienced lower rates of living independently (37% compared to 60%) than their nondisabled peers between three and five years out of high school
(Blackorby & Wagner, 1996).
school records. Results for employment were similar to the first NLTS, as 60% of young adults with disabilities were employed, compared to 66% of young adults without disabilities at the time they were interviewed eight years out of high school (Newman et al., 2009). In addition, youths with disabilities were less likely than their nondisabled peers (45%
compared to 59%) to live independently when interviewed eight years after high school (Newman et al., 2009).
Evolution of Transition Definitions
Before the term “transition” was first used in the field of special education in the 1980s to describe adolescents moving from school into adult roles in their communities, other terms were used to address similar issues. The “work/study” programs of the 1960s sought to prepare students with intellectual disabilities for jobs after high school and tried to accomplish it through a collaboration between special education and vocational education teachers, as well as vocational rehabilitation counselors (Halpern, 1994). The “career
education” movement of the 1970s broadened the focus to include students with and without disabilities in both regular and special education environments, and was primarily viewed as a general education movement. This ultimately led to the Council for Exceptional Children (CEC) forming the Division on Career Development and Transition (DCDT) in 1976 (Halpern, 1994). DCDT currently defines secondary transition of youth with disabilities as:
A change in status from behaving primarily as a student to assuming emergent adult roles in the community. These roles include employment, participating in
the community, and experiencing satisfactory personal and social relationships. The process of enhancing transition involves the participation and coordination of school programs, adult service agencies, and natural supports within the community. The foundations of transition should be laid during the elementary and middle school years, guided by the broad concept of career development. Transition planning should begin no later than age 14, and students should be encouraged, to the full extent of their capabilities, to assume a maximum amount of responsibility for such planning. (Halpern, 1994, p. 117)
The transition planning process should include (a) developing self-determination skills in students; (b) students evaluating their own strengths and weaknesses to find
information about them which will help in their own transition planning; (c) identifying post-school goals based on students’ evaluations; and (d) selecting post-school experiences that will help students meet their post-school goals (Halpern, 1994). The work/study and career education movements set the stage for the transition movement that took place in the 1980s.
Evolution of Transition Legislation
only employment goals, but education, independent living and community participation goals as well (Individuals with Disabilities Education Act, 1990). The 1997 IDEA reauthorization built upon the 1990 law by moving the age at which a statement of transition service needs must be included from 16 years of age to 14 (Individuals with Disabilities Education Act, 1997). When IDEA was amended in 2004, beginning at age 16 the student’s postsecondary goals for education/training, employment and, where appropriate, independent living, are to be measurable, updated annually, and based on age appropriate assessments (Individuals with Disabilities Education Improvement Act, 2004).
The IDEA 2004 law also called for greater accountability in accordance with the 2001 No Child Left Behind (NCLB) law. To ensure this, the U.S. Department of Education and the Office of Special Education Programs (OSEP) now requires states to report annually on how well school districts are meeting IDEA mandates. States measure their performance on 20 different indicators on part B in their Annual Performance Report (APR) of their state’s performance plan (SPP). Indicators 13 and 14 are related to secondary transition. Indicator 13 requires states to report how well they are providing transition services to
has been more elusive (Everson, Zhang, & Guillory, 2001; Finn & Kohler, 2009; Grigal, Test, Beattie, & Wood, 1997).
Evolution of Transition Planning Models
While transition services were not required by law until 1990, transition planning dates to the mid-1980s. Madeleine Will developed The Bridges from School to Working Life Model (1985), which focused exclusively on moving students from school into competitive employment either immediately or after post-school vocational training. The model
emphasized a range of services and supports, from temporary to more on-going, that focus on the individual needs of the student (Will, 1985). The transition model advocated by Halpern (1985) builds on the Bridges model by expanding the supports for students with disabilities beyond employment to also address options for independent living and developing
interpersonal relationships. Halpern believed transition services need to be more
comprehensive so students with disabilities are better equipped to handle the adjustment to independent living in their communities. To help meet this need, schools need to provide support before students exit school by setting post-school goals, providing families with information about post-school options, and linking students to adult service agencies.
Student-focused planning – includes planning strategies for students to participate in their Individual Education Plan (IEP) meetings.
Student development – includes instructional activities and supports needed to meet IEP goals.
Interagency collaboration – coordination of service delivery between schools and adult service agencies to meet individual needs of students with disabilities.
Family involvement – provide information and training to families of students with disabilities so they can advocate more effectively for their child’s needs.
Program structure – developing program policies aimed at providing services to students with disabilities, evaluating their effectiveness, and allocating resources to programs.
Alternative Paths to Obtaining a Standard High School Diploma
obtain a standard diploma. Examples of modifications include earning fewer credits,
allowance for both extended time to earn the necessary credits as well as alternate courses to count for required credits, and meeting graduation requirements based on decisions made by the student’s IEP team (Johnson & Thurlow, 2003). States also allow for non-traditional exit certificates. Gaumer-Erickson, Kleinhammer-Tramill, and Thurlow (2007) found 15% of students with disabilities earning exit certificates, compared to 1% of students without disabilities. They also noted that within disability categories, students with intellectual disabilities earn exit certificates at a significantly higher rate than other disability groups. The route a student takes toward earning a diploma may be of little significance to
employers, though. Hartwig and Sitlington (2008) interviewed 25 employers to determine if they consider the type of diploma a student earns or if they just want to know a student graduated. They found only five employers interested in the specific diploma type a student earned, while the rest only wanted to know a student graduated.
Occupational Course of Study
Nine states have diploma path options reserved exclusively for students with
College/University Prep, College Tech Prep, and Career Prep, into one diploma path, Future-Ready Core. As a pathway to earning a diploma, OCS classes are offered at each high school in the state and student enrollment is based on IEP team decisions. Students currently
complete 22 credits, including courses in traditional academic areas as well as elective courses in career and technical areas. The academic courses are taken in classrooms with other OCS students, while OCS students participate in the career and technical education electives with their nondisabled peers, though they are allowed accommodations for assignments and state testing in these classes.
Significance of the Study
Research Questions
1a. To what extent do student IEPs show evidence of the secondary transition predictors paid employment?
1b. To what extent do student IEPs show evidence of the secondary transition predictor independent living?
2a. Does a student’s diploma pathway, disability, ethnicity, gender, and age predict the probability that an IEP will show evidence of the secondary transition predictors paid employment?
2b. Does a student’s diploma pathway, disability, ethnicity, gender, and age predict the probability than an IEP will show evidence of the secondary transition predictor independent living?
Of the 16 predictors described by Test, Mazzotti et al. (2009), the two predictors the study sought to investigate were selected because they are consistent with the categories listed on the transition activities page of IEPs. The study will look for evidence of the predictors in the transition activities of Employment and Daily Living Skills, and look for further evidence of the predictors in additional sections of the IEP, specifically in the Present Level of Academic and Functional Performance and the Annual Goal pages.
Overview of Methodology
transition predictors of paid employment and independent living in his/her IEPs. The second level of analysis was two separate ordinal regression analyses, one for each of the dependent variables (paid employment and independent living). This analysis sought to determine if the probability of predicting that an IEP contained full evidence of either paid employment or independent living activities based on a student’s diploma pathway, disability, ethnicity, gender, or age.
Delimitations
The proposed study seeks to investigate the extent to which secondary transition predictors of post-school outcomes for students with disabilities are evident in IEP documents. While documentation on IEP forms does not necessarily represent all that occurred during IEP meetings, it is the only required documentation regarding the educational plan for a student with a disability.
The proposed study investigates a sample of students between the ages of 16 and 22 from one urban school district in the Southeastern U.S.; and includes those with intellectual disabilities, learning disabilities, emotional/behavioral disabilities, and autism. Students who are African American, Caucasian, or Hispanic will be represented as participants.
Definitions of Terms
The following terms will be used throughout this study. They are based on
the federal government that guide states in determining who is eligible for a free and appropriate public education under IDEA.
Learning Disability—A disorder in one of the psychological process in using or understanding written or spoken language, leading to deficits in the ability to speak, read, write, listen, spell, or perform math calculations. It does not include learning problems as a result of visual, hearing, or motor impairments; or of emotional disturbance or intellectual disability.
Intellectual Disability—Significantly subaverage general intellectual functioning, along with deficits in adaptive behavior that take place during the developmental period and negatively impact educational performance.
Emotional Disturbance—Exhibiting one or more of the following characteristics over a long period of time and negatively affects educational performance: An inability to learn unexplained by intellectual, sensory, or health factors; inability to develop satisfactory interpersonal relationships with peers and teachers; inappropriate types of behavior under typical circumstances; pervasive unhappiness or depression; and developing physical problems or fears related to school problems.
Autism—A developmental disability that significantly impacts verbal and non-verbal communication and social interaction, and usually develops before age three and negatively impacts educational performance. Other characteristics include engaging in repetitive activities and stereotyped movements, resistance to changes in environments or daily routines, and unusual responses to sensory experiences.
Transition Planning—A legal requirement that state and local education agencies must provide transition services through a coordinated set of activities for students with disabilities. A comprehensive transition plan including both goals and activities must begin at age 16. The activities must focus on individualized employment, post-secondary
education or training, and community living goals and based on the individual student’s strengths, preferences, and interests. In addition, transition activities must be coordinated with community service agencies so students have access to these services before graduation.
Individualized Education Plan (IEP)—A legal written document necessary for a child with a disability to receive services under IDEA. It is written by an IEP team and includes input from school staff, the child’s parents, and the child.
Summary
chapter describes why the study is needed at this time, outlines the research questions, and provides definitions relevant to the study.
Overview of the Manuscript
CHAPTER 2
REVIEW OF THE LITERATURE Career Development Theories
Chapter 1 detailed how the definitions, legislation, and programming models for the field of transition services has evolved from a strict focus on vocational and career planning needs of students with disabilities to a broader array of services that help this population move from school to adult living roles. A similar evolution is seen in the theoretical
foundations behind transition programs and services. The original theories focused on how individuals with disabilities can develop skills and behaviors to contribute to the work environment as adults. This moved to a more comprehensive model that takes into account not only vocational, but daily living and social needs of individuals with disabilities. Structural Theory
Structural theory focuses on the match between individual characteristics (i.e., abilities and interests) with the appropriate work environments. Structural theory was originally developed by Parsons in the early 1900s and became known as the trait-factor approach (Wolffe, 1997). Parsons believed that identifying the relationship between individual attributes and occupational requirements leads to satisfying career choices. A more current version of structural theory is John Holland’s (1992) theory of career
disability is to identify the match between a student’s personality type and work environment type.
Developmental Theory
While structural theory concentrates on individual occupations as the primary choice they make in their adult lives, developmental theory sees occupation as only one component among many decisions in an individual’s life. In developmental theory, occupational choice is a result of concepts and beliefs that develop throughout a person’s life. The result is that a satisfying career choice is one element in a fulfilling life. This theory is evident in Super’s (1990) life-span approach, where individual roles over their lifetime (i.e., family roles, leisure activities, citizenship) result in occupational choices. Super focused on how
individuals change over time as they grow into adult roles and responsibilities, especially as a worker. Developmental theory is also flexible enough that it can be applied to individuals in diverse roles, addressing the needs of individuals in different ethnicities and disabilities (Szymanski, Hershenson, Enright, & Ettinger, 1996).
Work Adjustment Theories
mind for an individual with a disability, as it would allow for a match between the individual needs of the student and the workplace characteristics.
Hershenson’s theory of work adjustment. Hershenson combined career
development and work adjustment approaches by looking at the evolution of an individual’s role as a worker and the work environment over time (Hershenson & Szymanski, 1992). Hershenson saw the individual as a worker in three phases. Work personality is how people see themselves as workers and their motivations to work. Work competencies include the work habits, work skills, and interpersonal skills needed to succeed in the workplace; this develops as the person progresses through their school years. Work goals develop based on interactions with peer groups during the time an individual is leaving school and entering the world of work. This theory can help address the support needs of an individual with a disability by identifying his/her work personality, competencies, and goals.
Learning Theory
Conceptual Framework Ecological Model of Development
Students without disabilities normally go through the process of transitioning from high school to adult roles without supports or interventions from school staff. Because students with disabilities continue to experience poor post-school outcomes, transition planning to address individual needs is necessary. Transition planning must be guided by a theoretical framework that is broad enough to encompass the complex needs of students with disabilities. An ecological model of career development will guide the current study
investigating whether differences exist in transition planning for students who pursue different paths to a diploma. As a conceptual framework, the ecological model of career development is grounded in social functioning that provides the necessary scope to address the complex issues surrounding the transition of students with disabilities from high school to adulthood. It takes into account the multiple factors that school personnel need to consider when preparing students with disabilities to transition from school to adult roles. The theory highlights the relationships among individuals, their environments, and their behaviors.
environment factors include anything related to a person’s work setting—where work is located, tasks of the job, culture of the work environment; outcome factors are the result of all the above factors and how they influence the level of success an individual has in meeting his/her goals.
In addition to these constructs, Szymanski et al. (1996) developed six different processes that address the constructs in the ecological model: congruence, decision making, developmental processes, socialization, allocation, and chance. Congruence is the fit between an individual and his or her work environment; decision making involves the skills the student needs to consider various choices and arrive at a decision; developmental
processes are the changes an individual goes through over time, taking into consideration any obstacles to development as the result of a disability; socialization is how individuals go about learning from others about their various roles in family, work, and community contexts; allocation is the extent to which individuals with disabilities are either provided opportunities or shut out of opportunities by the professionals who serve their needs (i.e., teachers and counselors); chance processes are unexpected events in an individual’s life and how prepared he or she is to handle them.
Compliance in Transition Planning
federal guidelines under IDEA. Conversely, the consequences for not meeting Indicator 13 requirements are that a FAPE is not being provided. In addition to addressing the legal implications of writing compliant transition plans, other themes in the literature on transition planning have emerged, including how a student’s disability category impacts transition planning, how effective transition plans are in matching goals with activities, how transition plans can are implemented into practice.
Transition Planning and a Student’s Disability Category
Several studies documented the differences in transition planning by specific
disability categories. McMahan and Baer (2001) surveyed 186 members of transition teams throughout Ohio to examine the extent to which transition policies and best practices were implemented. Respondents included those who participated in the planning process as well as those who were directly involved in providing services (i.e., adult service agency
representatives). All respondents were on transition teams that were part of a statewide systems change project. Their instrument was divided into two sections. The first section had four parts: (a) measuring level of parent notification of IEP meetings, (b) level of student participation in IEP meetings, (c) transition services included in the IEP, and (d) strategies to address participating agencies that do not provide transition services. They found the IEP contents showed students with moderate to severe disabilities included all aspects of
nearly 80% responded that students were both verbally invited to attend IEP meetings and that their preferences were included in the IEP based on information from adults who knew them. McMahan and Baer also examined predictors of policy compliance and best practices. They found the strongest predictors of policy compliance to be transition training through statewide regional resource centers, the existence of school-based interagency transition teams, and transition training within schools. In addition, school-based interagency teams were the strongest predictor of transition best practices.
disabilities matched their present levels of performance with their annual goals more frequently than the IEPs of students with other disability classifications. The authors concluded that special educators need to go beyond minimum compliance requirements and focus on the best practices that will help students live and work independently when they leave school.
Landmark (2009) created a survey that measured compliance with the 2004 IDEA transition regulations. In reviewing the transition plans of 212 IEPs across eight school districts in central Texas, Landmark investigated the extent to which best practices in transition were documented in the transition plans. She also sought to determine the effects of disability and ethnicity on both compliance and best practices. To calculate an overall compliance score, Landmark rated the compliance level of each transition plan in five areas, whether: (a) appropriate members were invited to the meeting, (b) timelines were included for meeting transition services, (c) postsecondary goals were measurable, (d) annual goals supported the postsecondary goals, and (e) transition services were addressed. Scores for overall compliance ranged from 0 to 5, with a score of 5 if all five areas of the IEP were compliant. The mean score for the sample was 2.03. Results of the effects of disability revealed having an emotional disability was a predictor for not having compliant transition services, while having a learning disability was a predictor for not having annual goals that supported postsecondary goals. The effects of ethnicity revealed that being African
significant results based on disability and ethnicity variables showed that students with emotional disabilities were less likely to have compliant transition plans; among best practices variables, African American students and students with emotional disabilities and learning disabilities were less likely to have IEPs that showed evidence of employment preparation; students with learning disabilities were less likely to have IEPs that showed evidence of self-determination.
Daviso, Denney, Baer, and Flexer (2011) conducted a survey of 416 students with learning disabilities across 48 school districts in Ohio who had exited school in 2004, a sub-sample of the Ohio Longitudinal Transition Study. The researchers sought information on their employment and postsecondary education goals, the extent to which the high school program and transition services they received predicted their post-school goals, and student perceptions of what helped them most in meeting their transition goals. They found more than 80% of respondents planned on either full-time or part-time employment, while nearly 70% also planned on entering some type of post-secondary education. The researchers then used logistic regression to determine that the model for predicting employment goals was accurate for 67% of the sample and the model for predicting postsecondary goals was
developing an academic curriculum that would better prepare students with learning disabilities to meet the demands of postsecondary education settings.
Transition Goals and Activities
Several other studies measured compliance with specific aspects of transition plans. Grigal, Test, Beattie, and Wood (1997) reviewed the transition components of 94 IEPs of students ages 18 to 21 with learning disabilities, mild and moderate intellectual disabilities, and emotional/behavioral disorders. The instrument they used, The Statement of Transition Services Protocol (Lawson & Everson, 1993), evaluated compliance with IDEA on 25 questions over four sections: demographics, the format of the transition component, the quality of transition goals, and evidence of best practices. While they found that transition plans contained components required by IDEA, many only met the bare minimum for compliance and did little in terms of actual transition planning and programming. They found goals were written in vague terms and without specific steps to assist students in developing skills necessary for adulthood. They also found a lack of involvement by adult service agencies (other than vocational rehabilitation) in developing transition plans. Grigal et al. also found that plans were rarely updated annually. They concluded that post-school goals need to be individualized based on student interests and desires, and not based upon a student’s disability as the foundation for developing goals.
examined the monitoring reports of states receiving IDEA Part B funds. With regard to states implementing transition services over the four-year period, they found that (a) just over one-third of the states did not invite students to the IEP meeting when transition was
considered, (b) two-thirds did not indicate that transition services would be discussed on the invitation to parents, and (c) nearly half of the IEPs reviewed did not address elements of transition services: instruction, community experiences, employment, and post-school adult living. They also found little change over the monitoring cycle’s four year period in terms of overall compliance with transition mandates. They did find, however, states that
implemented systems change grants were significantly more likely to have evidence of transition services in their IEPs.
Everson, Zhang, and Guillory (2001) studied the transition plans of 329 students using an instrument developed for the Louisiana Statewide Transition Project. They used the same instrument used by Grigal et al. (1997), but revised it to include areas suggested by the Louisiana State Transition Project. They found that transition plans addressed basic
transition services as required under IDEA 1997 authorization (i.e., post-secondary
Implementing Transition Plans into Practice
Researchers that studied transition compliance made several recommendations so practitioners could put transition plans into practice. Finn and Kohler (2009) stressed that leaders at state and local levels make sure that the information written on IEPs, including transition plans, is implemented. Their study was published after the 2004 reauthorization of IDEA; the instrument they used in their study was based on the 1997 IDEA reauthorization. They reviewed 291 IEPs across 13 school districts in a Midwestern state by using the
Transition Requirements Checklist (O’Leary, Lehman, & Doty, 2001) The checklist was developed by the Transition Outcomes Project to help schools improve compliance with IDEA 1997 with the goal of improving post-school outcomes for students with disabilities (O’Leary, 2000c). Their results showed an increase in compliance at the follow-up review, as indicated by a higher frequency and percentage of “yes” marks, from 46.2% to 74.6%. There was a significant difference between expected frequency at initial review and observed frequency at follow-up review for 20 of the 31 items. In addition, for 18 items the majority of scores were “yes” at initial and “yes” at follow-up.
statements by students about their post-school goals, only 62% identified action steps and 56% identified timelines to accomplish them.
Best Practices in Transition Planning
Research in secondary transition, similar to special education research in general, has moved from descriptive research to identifying best practices to the current state of
identifying evidence-based practices, or EBPs (Landmark, Ju, & Zhang, 2010). The predictors are supported by EBPs in secondary transition. Before EBPs were developed in the transition research literature, best practices in transition were first published by Kohler (1993). After reviewing articles that discussed best practices in transition between 1985 and 1991, she identified 11 documents that described substantiated practices in transition based on empirical evidence. To determine if a practice was empirically substantiated, Kohler (1996) sought out practices that were linked to an outcome variable in post-secondary education, employment, or independent living. The documents that met the criteria for substantiated best practices were in the areas of vocational training, parent involvement, social skills training, paid work experience, follow-up employment services, employer input in transition planning, inclusion in general education, daily living skills training, and
planning, indicating the positive effect students’ participation in planning for their own futures can have on their post-school outcomes.
The transition research literature moved toward EBPs with the study conducted by Test, Fowler, et al. (2009). They searched systematic literature reviews and experimental studies to identify EBPs then categorized them using the Taxonomy for Transition
Programming. They found 63 studies that met their criteria for high or acceptable quality single subject intervention studies, or were a systematic literature review or meta-analysis. This led to the identification of 32 evidence-based practices in transition, with 25 of these practices under the Student Development area of the taxonomy.
Landmark et al. (2010) provided a review of best practices in transition since
Kohler’s (1993) review. They found an additional 18 empirical studies to go along with the original 11 studies that Kohler found. Based on the total of 29 documents, Paid or Unpaid Work Experience was the practice supported by the literature most often, with 18 articles that supported it. Employment Preparation Program was the next most frequently cited practice, with 16 articles. The remaining practices from most to least support from the documents reviewed were general education inclusion, family involvement, social skills training, daily living skills training, self-determination training, and community or agency collaboration.
specifically meet the needs of students with disabilities. The four career paths he identified are preparation for four-year college through a strictly academic program, a combination of academics with career and technical education in preparation for a two-year college,
preparation for competitive employment and independent living, and preparation for employment and living with support.
Predictors of Post-School Outcomes
criteria for a potential level of evidence, a category needed one a priori study and/or two or more exploratory studies (i.e., studies with no hypothesis) that included significant
correlations between predictor and outcome variables. Predictors that were found to have levels of evidence in all three post-school outcome areas were inclusion in general education, paid employment/work experience, self-care/independent living skills, and student support. Other predictors include career awareness, exit exam requirements, interagency
collaboration, occupational courses, parental involvement, program of study, transition program, vocational education, and work study. This study investigated two of the predictor categories that show evidence in all three post-school outcome areas, paid employment and independent living skills, to see if there is evidence of differences between samples of students pursuing different diploma paths in the same state. Paid employment has
established a moderate level of evidence as a secondary transition predictor for positive post-school outcomes in the areas of education/training and employment (Test, Mazzotti, et al., 2009). It also has a potential level of evidence as a predictor for positive post-school outcomes in the area of independent living. Recommended evidence-based practices that support paid employment as a predictor include teaching employment skills using
Mazzotti, et al., 2009). Recommended evidence-based practices that support independent living as a predictor include food preparation and cooking skills, home maintenance, laundry skills, and counting money skills (Test, Fowler, et al., 2009).
Paid employment and independent living were the predictors specifically selected because they are also among the transition activities on IEPs forms used by the district in this study. The next section of this review will focus on correlational research that measured outcomes related to employment and independent living. The review will be divided into three areas: disability, gender, and ethnicity. Throughout the transition research literature, these are the covariates that have had the most impact on post-school outcomes (Baer al., 2011).
Disability
Correlational research in recent years measuring employment and independent living outcomes for individuals across different disability categories used a secondary analysis of NLTS2 data to find results. Wave 5 of the NLTS2 collected data in 2009 from students who exited high school 8 years earlier from phone interviews or mailed surveys. Among
disability groups on which data were collected about employment and independent living outcomes, individuals with learning disabilities were most likely to be employed and living independently 8 years out of high school (Newman et al., 2011).
employment of students with ID. They found 99.7% of students with ID participated in employment-related transition activities, 53.4% participated in school-sponsored work and 59.7% participated in other paid work experiences while in school. Logistic regression analyses showed students were 3.489 times more likely to be employed after school if they participate in a school-sponsored job, and 5.704 times more likely to be employed after school if they participated in paid work experiences while in school.
Carter, Austin, and Trainor (2012) used the NLTS2 dataset to examine factors associated with employment two years after leaving high school for students with severe disabilities. Data were taken from parent and youth interviews, school program surveys, and school characteristics surveys. In this sample, students with severe disabilities were defined as having an intellectual disability, multiple disabilities, or autism. Results showed only 26% of individuals in the sample were employed two years after leaving high school. The
researchers pointed out a difference in their findings on students with severe disabilities compared to prior post-school outcome studies on students with mild disabilities. They found that for students with severe disabilities, actual hands-on work experiences were the best predictor for employment after high school, whereas the best predictors for students with mild disabilities were career awareness, job search skills, and taking vocational courses.
The NLTS2 analysis by Grigal, Hart, and Migliore (2011) compared students with intellectual disabilities to students identified with other disabilities to determine how transition goals on IEPs, number of referrals made to outside agencies, and agency
students with ID, when compared to students with other disabilities, were significantly less likely to have transition goals related to attending a two- or four-year college, postsecondary vocational training, and competitive employment, but significantly more likely to have goals related to sheltered and supported employment. Schools contacted supported employment, sheltered workshop, and adult day programs significantly more often on behalf of students with ID. Students who had a post-school goal of attending a two- or four- year college was the only predictor among transition goals associated with a greater likelihood of employment for students with ID.
training after school. The same number of students (24.0%) with moderate/severe ID reported receiving life skills instruction after school regardless of whether they received life skills training while in school, with no statistically significant differences found.
Hasnain and Balcazar (2009) used secondary analysis data from the 1994-95 National Health Interview Survey on Disability (NHIS-D) to determine which factors predict young adults with disabilities will be employed in either community-based or facility-based settings. The NHIS-D dataset differs from the NLTS2 dataset in that the participants are older
(between 18 and 26) and must have exited from high school, either with or without a diploma, to be included in the study. They found individuals with more severe disabilities were significantly less likely to be employed in community based setting.
Heal and Rusch (1994) used data from the original NLTS to investigate predictors of residential independence among a stratified random sample of 2,700 individuals with
disabilities surveyed two years after leaving high school. Results revealed 80% of the respondents lived with a parent or other family member, with students with mild disabilities living with greater independence, and students with severe disabilities living less
independently.
Gender
Research has documented poor outcomes for women with disabilities, particularly in the area of employment (Moore, Feist-Price, & Alston, 2002; O’Hara, 2004). This
combination of gender and disability leads to such increased difficulty in obtaining positive employment outcomes that it has been referred to as “double jeopardy” (Rousso &
Wehmeyer, 2001). The NLTS2 data show 65% of males and 52% of females were employed when interviewed eight years after exiting high school in employment and independent living outcomes, though the difference was not statistically significant. There were also no
significant differences in average hourly wages, $10.90 for males and $9.40 for females, but a significant difference existed in hours worked per week, as males worked 38 hours and females worked 32 hours (Newman et al., 2011). There were no significant differences in rates of living independently up to 8 years after exiting high school, which were 65.7% of females and 54.6% of males (Newman et al., 2011).
Recent studies also show the challenges women with disabilities continue to experience in achieving post-school outcomes in employment and independent living. Flexer, Daviso, Baer, Queen, and Meindl (2011) pointed out that gender impacts the
significantly less likely to be employed full time. The Hasnain and Balcazar (2009) study using the NHIS-D dataset also found females were significantly less likely to be employed in a community setting.
Boeltzig, Timmons, and Butterworth (2009) investigated the employment outcomes of men and women with developmental disabilities (DD). They analyzed survey responses from 195 Community Rehabilitation Providers who reported on a total of 869 individuals with DD. Results showed a statistically significant difference in average weekly earnings, with men earning $170 per week compared to women earning $152. In addition, they found a statistically significant difference in wage ranges, with a higher percentage of men earning higher ranges of weekly earnings (defined as ranges of $151–200, $201–250, $251–300), and a higher percentages of women were in the lower ranges (defined as ranges of $51–100 and $151–200). There was also a significant difference in the types of jobs held. More men worked in maintenance, assembly, manufacturing, and packaging, where more women worked in food services and clerical positions.
showed that both males and females who held at least two jobs during high school were twice as likely to be employed one year out of high school. Results also showed predictor
variables of competitive employment unique to young women with disabilities. For instance, young women whose family income was less than $25,000 were over six times less likely to be competitively employed. Self-esteem also had a significant effect; women with low levels of self-esteem were three times less likely to be competitively employed. The researchers discussed how school-to-work transition programs should address the specific needs of young women so they are better prepared for the demands of the workforce. They also recommended providing meaningful learning opportunities in less traditional occupations for women.
Ethnicity
Recent studies show this struggle continues for minorities with disabilities. In Grigal et al.’s (2011) study that compared employment outcomes of students with intellectual disabilities to students with other disabilities, they also found that among students with other disabilities, Caucasians were significantly more likely to be employed than students of other ethnicities. In addition to finding gender differences on employment outcomes, Flexer et al. (2011) also found African American students were significantly less likely to be employed than students from other ethnicities who participated in a work study program. Hasnain and Balcazar’s (2009) study using the NHIS-D dataset also found 63.4% of Caucasians were in community-based employment shortly after exiting high school, compared to 36.5% of African Americans and 32.8% of Hispanics. They also found 32.2% of African Americans used formal supports such as vocational rehabilitation services to obtain community-based employment, compared to 24.2% of Caucasians and 20% of Hispanics. Finally, in the logistic regression model, Caucasians were significantly more likely to be employed in both community-based settings and facility-based settings when compared to African Americans and Hispanics.
likely to secure employment than boys. Other significant predictors to employment were prior vocational experience (35% more likely for those who had it), and receipt of
Supplemental Security Income benefits (22% less likely for those receiving it). Summary
The predictors for post-school outcomes developed by Test, Mazzotti, et al. (2009), along with the evidence-based practices developed by Test, Fowler, et al. (2009) help practitioners by providing evidence of practices that will give students a greater opportunity to achieve their post-secondary goals. It is clear that to date the correlational research identifying transition practices that relate to post-school outcomes for students with disabilities lags behind the experimental research that identifies evidence-based practices. Flexer et al. (2011) point out that research in secondary transition has focused more on practices that identify in-school outcomes rather than post-school outcomes because the No Child Left Behind Act defined special education research more narrowly. The law’s definition of scientifically based research did not leave room for research in transition practices based on correlational studies (Flexer et al., 2011).
A recent study by Carter et al. (2013) reviewed types of methodology used in research studies published by Career Development and Transition for Exceptional
Individuals, the leading journal on research in secondary transition, over the past 35 years. They found correlational research accounted for 13.5% of all studies using quantitative designs. Because studies on which transition practices lead to improved post-school
through secondary analyses of datasets such as NLTS and NLTS2, more research of this type will be needed in the future. This review focused on how correlational studies have found differences in post-school outcomes based on a student’s disability category, gender, and ethnicity. These studies can provide the basis for future research on interventions that address the gaps in post-school outcomes, specifically the need to increase employment outcomes for females and African Americans with disabilities. In addition, more
correlational studies will be needed on additional variables that can impact a student with a disability achieving his/her post-school outcomes, such as the amount of time students with disabilities spend with peers without disabilities.
CHAPTER 3 METHODS
Population
The population for this study were high school students identified with a range of disabilities, including developmental disabilities (i.e., intellectual disabilities and autism), learning disabilities, emotional/behavioral disabilities, and other health impairment (i.e., attention deficit disorder). The students were served in an urban school district in the central region of a southeastern state. Based on enrollment figures for the 2012-13 school year, the district has a total of nearly 150,000 students, making it the largest in the state and the 16th largest in the country. Of the total population of students in the district, over 19,500, or 13.4%, have an identified disability. Current enrollment figures also indicate 49.1% of the total population is White, 24.4% are African American, 15.4% are Hispanic, 6.5% are Asian, 0.3% is American Indian/Alaska Native, and 0.1% is Native Hawaiian/Other Pacific Islander. In addition, 51% are male, 49% are female, and 33.7% of students qualified for the Free or Reduced Lunch Program. There are currently 20 high schools in the district, 10 of which are within the same city and the remaining in various municipalities throughout the district. The total high school population consists of more than 43,300 students. Based on 2010 census estimates, median household income within the district ranges from $50,085 to $94,123.
Sample
sampled for students on both the Future Ready-Core Course of Study and the Occupational Course of Study. There were two primary considerations in determining if a student was included in the study. First, a student had to be at least 16 years of age, or turn 16 during his/her current IEP term, because this is the age at which transition activities are first
included as part of a student’s transition IEP. Second, the student’s IQ score was between 70 and 85, based on the student’s most recent psychological exam in which an IQ score was obtained. This IQ range was selected because it is between one and two standard deviations below the mean IQ score of 100 (American Association on Intellectual and Developmental Disabilities, 2013), and gives the greatest likelihood of capturing a significant percentage of students currently enrolled in the Occupational Course of Study while also providing a sufficient sample of students on the Future Ready Course of Study. It is worth noting, however, that a student’s IQ score does not determine whether a student is placed on the OCS pathway or Future Ready pathway; such decisions are made by IEP teams based on the diploma pathway that is most appropriate for the student to meet his/her post-secondary goals.
Instrument
students are provided with activities related to each predictor, experts in the field of
secondary transition developed operational definitions through a Delphi study (Rowe et al., 2013). The instrument used in the current study adapted the implementation scale so the focus was on the extent to which evidence of transition predictors exist in student IEPs. The rating scale measured how far each IEP extends in addressing the two transition predictors selected for this study. The two predictors— paid employment and independent living— were selected because they are closely associated with two of the areas addressed on the transition activities page. The sections on this page of the IEP are titled Employment and Daily Living Skills.
Data Scoring
The following scale was used in determining each student’s score for each predictor. Table 1 shows how the spreadsheet was used to collect the data.
• 0 = No evidence
• 1 = Evidence as a transition activity
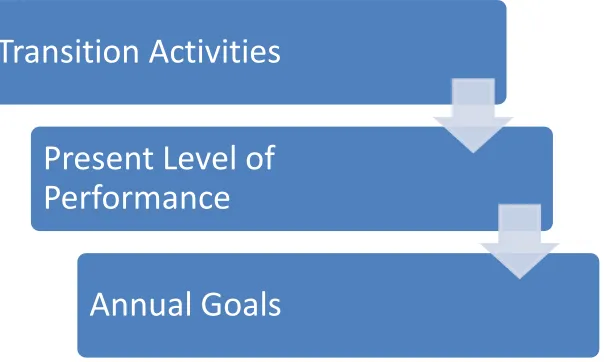
• 2 = Evidence as a transition activity and in Present Level of Performance
• 3 = Evidence as a transition activity, in Present Level of Performance, and Annual
Goal
Figure 1. IEP sequence: From a student’s transition activities to their present level of performance to their annual goals.
The score each student earns for each predictor will be based on examples of characteristics for each predictor cited in the operational definition from the Delphi study. Table 1 summarizes the guide the researcher will use to determine the score for level of evidence that exists in IEPs.
Table 1
Operational Definitions for Transition Predictors
Predictor Category
Transition Activity
Category on IEP Operational Definition
Paid Employment Employment Opportunities to participate in job shadowing, work-study, apprenticeships, internships; instruction in obtaining and maintaining a job;
allowing students to earn credits for paid employment; provide employment training
placements.
Transition Activities
Present Level of
Performance
Table 1 (Cont.)
Predictor Category
Transition Activity
Category on IEP Operational Definition
Independent Living Daily Living Skills Provide instruction in the following areas: financial planning, cooking, housekeeping,
home maintenance, using transportation, clothing care, time/organizational management, self-determination, problem
solving.
Procedures
The researcher is employed as one of six Transition Teachers in Special Education Services by the school district from which the sample of students for this study was selected. This position allowed the researcher access to each student’s IEP in the district through the district’s software program that contains all student IEPs, titled EasyIEP. The researcher did not need to ask personnel at any of the high schools to pull IEP files or use their time in any way that detracted from their duties. The study was granted exemption from Federal requirements for human subjects’ research by the Institutional Review Board of North Carolina State University. The school district from which the sample was taken required the study be approved by the district’s research committee, which was granted on April 24, 2013.
Once permission to conduct the study was granted by the school district, the
and clicked on the name of each high school, which displayed the names of all students at that school who had IEPs. Before looking at the current IEP, the sample selector first looked at the most recent psychological evaluation to find evidence of the student’s full scale IQ score. The sample selector noted the year of the exam to make sure the score was obtained no earlier than middle school. The sample selector then made sure the score was between 70 and 85. If one of these conditions were not met, the co-worker returned to the student list and clicked on the next student’s name and repeated the process. If both conditions were met, the co-worker opened the student’s current IEP to check the date of birth to make sure the student is at least 16 years of age, or will turn 16 during the current IEP term. Again, if this was not met the sample selector exited the IEP, went back to the main screen and moved on to the next student. Therefore, if the student was found to have a full scale IQ score between 70 and 85 on a psychological exam administered no earlier than middle school and was at least 16 years of age, or turned 16 during the current IEP term, the sample selector proceeded to examine the student’s IEP for evidence of predictors as well as identify information about the student’s identified disability, ethnicity, and gender. The sample selector found the student’s disability category and gender at the top of the first page of the current IEP, and found the student’s ethnicity by clicking on the tab for “student profile” under the student’s name in EasyIEP.
IEP, and removed all identifying information before sending the file back to the researcher. The IEP documents were then reviewed using the rating scale described earlier. To check for inter-rater reliability on the level of evidence on each of the predictors, the researcher trained a reliability checker on how to view the transition plans and annual goals for evidence of paid employment/work experience and self-care/independent living. The researcher sent a
separate electronic file to the reliability checker with 10% of the total sample of students in both the Future Ready Course of Study students and Occupational Course of Study students. The students were randomly selected using the random number generator function on
Statistical Package for the Social Sciences (SPSS), version 21.0. The researcher sent the electronic file to the reliability checker and deleted the file from his computer. The
researcher then entered the raw data indicating the level of evidence for each predictor on a spreadsheet in SPSS. The researcher used the same codes as those used on the rating scale, and double checked that the data were accurately transferred to the spreadsheet. Reliability was determined by dividing the number of agreements between the reliability checker and researcher by the number of agreements plus disagreements. An agreement for an individual student was counted when each level of evidence was in agreement. For instance, if a
Design
Data Analysis
Ordinal regression was used to analyze the data by predicting probabilities that the dependent variables— paid employment and independent living—exist in transition plans of students. The dependent variables are on an ordinal scale, since the distance between each level of evidence—No evidence (0), Some Evidence (1), Strong Evidence (2), and Full Evidence (3)—is unknown. For example, when one of the sections of the IEP showed evidence of an activity, a score of 1 was given regardless of how many examples of evidence existed in that section. The independent variables for disability and ethnicity were recoded because learning disabilities and Caucasian were selected as the reference categories. In ordinal regression, the “event”— in this case, observing evidence of the transition
predictors in an IEP from the sample— is the probability of achieving a particular score and all others ordered before it (Norusis, 2005). It focuses on the cumulative probabilities instead of probabilities of discrete categories, such as in logistic regression. Therefore, the odds of an event occurring for each level of the rating scale is expressed as θj = prob (score ≤ j)/prob
(score>j). For the rating of level of evidence for Paid Employment and Independent Living, the following odds were used:
Θ0 = probability of a score of 0/ probability of a score greater than 0. Θ1 = probability of a score of 1/ probability of a score greater than 1. Θ2 = probability of a score of 2/ probability of a score greater than 2.
Table 2 illustrates which data analysis techniques was used to answer the research questions.
Table 2
Summary of Data Analysis Based on Research Questions
Research Question Analyses
1a. To what extent do student IEPs show evidence of the secondary transition predictor of paid employment? 1b. To what extent do student IEPs show evidence of the
secondary transition predictor of independent living?
Descriptive Statistics
2a. Does a student’s diploma pathway, disability, ethnicity, gender, and age predict the probability that an IEP will show more evidence of the secondary transition predictor of paid employment?
2b. Does a student’s diploma pathway, disability, ethnicity, gender, and age predict the probability that an IEP will show more evidence of the secondary transition predictor of independent living?
Ordinal Regression
Summary
This chapter described the methods used to answer this study’s research questions. It provided details about the instrument and procedures used to collect the data. It then
CHAPTER 4 RESULTS
Sample
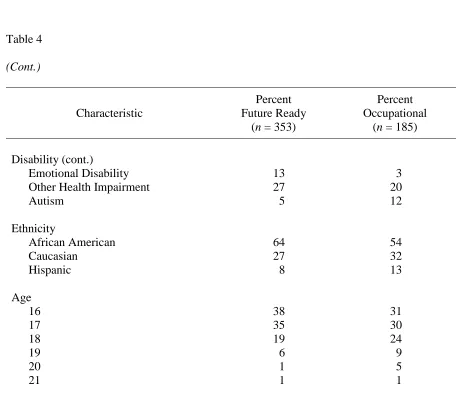
The sample for the study consisted of 538 students between the ages of 16 and 22 from 20 different high schools in an urban school district of North Carolina. Table 3 shows the composition of the sample by students’ diploma pathway and demographic
characteristics. Of the total number of students selected, 65% (n = 353) were pursuing the Future Ready course of study, while 35% (n = 185) were students following the Occupational Course of Study. Table 4 shows the percentage of each demographic characteristic for students on either diploma pathway. Students with learning disabilities made up the largest percentage of the total sample as well as the samples of students on both Future Ready and Occupational Course of Study. African American students made up the largest percentage of students of different ethnic backgrounds in the overall sample and the sample for each
diploma, and nearly twice as many males were in each sample as there were females. Students between ages 16 and 18 made up at least 90% of each sample. A larger percentage of 19 and 20 year olds are following the Occupational Course of Study.
Table 3
Demographic Characteristics as a Percentage of the Overall Sample (n = 538)
Characteristic n Percent
Diploma Pathway
Table 3 (Cont.)
Characteristic n Percent
Diploma Pathway (cont.)
Occupational 185 35
Disability
Learning Disability Intellectual Disability Emotional Disability Other Health Impairment Autism 266 48 50 134 40 49 8 9 24 7 Ethnicity African American Caucasian Hispanic 331 152 55 61 29 10 Age 16 17 18 19,20,21 195 177 113 53 36 33 21 10 Table 4
Individual Characteristics as a Percentage of Students on Each Diploma Pathway
Characteristic
Percent Future Ready
(n = 353)
Percent Occupational
(n = 185)
Table 4 (Cont.)
Characteristic
Percent Future Ready
(n = 353)
Percent Occupational
(n = 185)
Disability (cont.)
Emotional Disability Other Health Impairment Autism 13 27 5 3 20 12 Ethnicity African American Caucasian Hispanic 64 27 8 54 32 13 Age 16 17 18 19 20 21 38 35 19 6 1 1 31 30 24 9 5 1
Evidence of Transition Predictors
Table 5 presents the means and standard deviations of evidence of paid employment and independent living activities in the IEPs of students on both Future Ready and
evidence for the transition predictors, Paid Employment and Independent Living, found in IEPs.
Table 5
Descriptive Statistics for Transition Predictor Evidence for each Diploma Pathway
Future Ready
Occupational Course of Study
Transition Predictor M SD M SD
Paid Employment .71 .58 2.21 .91
Independent Living 1.09 .83 1.79 .96
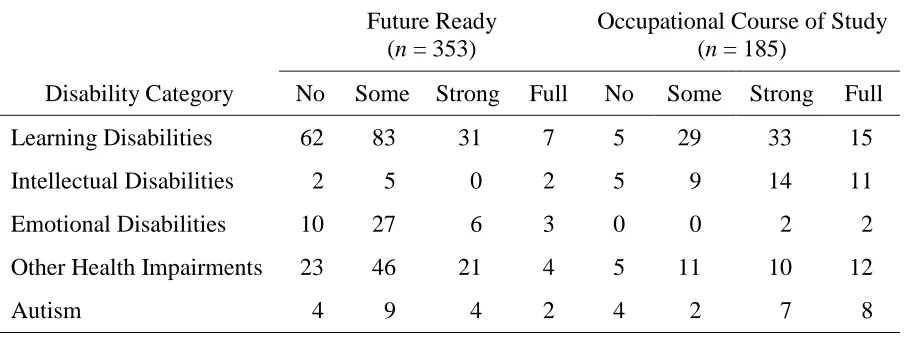
Tables 6–13 illustrate students on each diploma pathway based on several
demographic characteristics, including disability category, ethnicity, gender, and age. Each table displays the percentage of students on each diploma pathway with each level of evidence for both paid employment and independent living activities.
Among disability categories for students on the Future Ready diploma pathway, only two students with learning disabilities and one student with autism showed full evidence of paid employment activities. No students with intellectual and emotional disabilities showed full evidence of paid employment activities, nor did any students with other health
Figure 2. Percentages of students on Future Ready and Occupational Course of Study diploma pathways who show evidence of paid employment and independent living activities in IEPs. 34.4% 60.6% 4.2% 0.8% 1.6% 27.9% 18.9% 51.6% 0.0% 10.0% 20.0% 30.0% 40.0% 50.0% 60.0% 70.0%
0 1 2 3
Per cen ta ge of St ud en ts
Paid Employment Level of Evidence
Future Ready Students OCS Students 28.5% 47.8% 18.2% 5.6% 10.0% 28.4% 34.2% 27.4% 0.0% 10.0% 20.0% 30.0% 40.0% 50.0% 60.0%
0 1 2 3
Per cen ta ge of St ud en ts
Independent Living Level of Evidence