20th International Conference on Structural Mechanics in Reactor Technology (SMiRT 20) Espoo, Finland, August 9-14, 2009 SMiRT 20-Division 5, Paper 2075
A study on seismic behavior of nuclear power building in strong nonlinear area
and fragility evaluation using 3 dimensional FEM
Part-2 Fragility evaluation
Takuya SUZUKI
a, Shodo AKITA
b, Naohiro NAKAMURA
c,
Masao KOBA
dand Tomio
NAKANO
ea
R&D Institute, Takenaka Corporation, 1-5-1 Otsuka, Inzai, Chiba, Japan, e-mail: [email protected]
b
Nuclear Power Division, The Kansai Electric Power Co., Inc., Yokota 8, Goichi 13 Mihama, Mikata-gun,
Fukui, Japan c
R&D Institute, Takenaka Corporation, 1-5-1 Otsuka, Inzai, Chiba, Japan d
Nuclear Power Division, The Kansai Electric Power Co., Inc., Yokota 8, Goichi 13 Mihama, Mikata-gun,
Fukui, Japan e
NEWJEC Inc., 2-3-2 Honjo-higashi, Kita-ku, Osaka, JAPAN
Keywords: Seismic PSA, 3D FEM, Nonlinear analyses, Soil-structure interaction, Basemat uplift, Lumped
mass model
1
ABSTRACT
The evaluation based on the probabilistic safety assessment (PSA) is expected for nuclear power buildings because the risk of the occurrence of the seismic ground motions beyond the design assumption cannot be denied. In this paper, the building fragility evaluation of the seismic PSA was carried out using the 3 dimensional nonlinear FEM model based on the result of part-1.
As the fracture modes, the shear failure of the web wall and the flexural failure and the compressive failure of the flange wall were assumed. The fragility curves of the FEM model and lumped mass model in each analysis case were calculated as follows. First, the failure probability was plotted on a diagram for each input acceleration level where analysis was conducted. The failure probability is calculated by considering the aleatory uncertainty of the response and strength value. The plotted points are approximated by a lognormal cumulative distribution function using the least squares method, which is taken to be the fragility curve.
2
INTRODUCTION
The September 2006 revision of the Regulatory Guide for Reviewing Seismic Design of Nuclear Power Reactor Facilities Nuclear Safety Commission of Japan, (2006) noted the existence of risk (residual risk) arising from the seismic ground motion exceeding the design basis ground motion. This has created demand for the proactive introduction of evaluation methods for quantitatively evaluating this risk based on the most up-to-date techniques, such as probabilistic safety analysis (PSA), and aggressive efforts for establishing these methods.
For the purpose, in the previous paper (part-1), a nonlinear 3D FEM model (Figure 1) was used to conduct seismic response analysis of large inputs to a nuclear power plant building and estimated the seismic ultimate behavior. First, response analysis was conducted by increasing the maximum horizontal acceleration up to 3500 Gal, and the effects of vertical input motion and basemat uplift on the response characteristics were evaluated. A comparison was also made with SR model response results.
! " # ! $#
! %#
! &#
! ! # ! '#
! (#
! )#
! * # + , - . / 0 1# + , - 2 3 0 4# + , - 2 5 0 4# + , - 2 . 0 1# + , - 2 / 0 1# + , - / 4 0 .# + , - / 6 0 7# + , - / . 0 .# + , - / 2 0 6# !"# !$# # !%# !&#
Shaking direction 300 m
150 m 90m
CL
300 m
150 m 90m
CLCL
(a) Lumped mass model (b) 3 dimensional FEM model
Figure 1. Analysis models
3
ANALYTICAL MODEL AND ANALYSIS CONDITIONS
Figure 1 shows the 3D FEM model and the lumped mass model that was used in the investigation. It is the same as part-1. Material Properties, Input seismic motion, Analysis condition are the same as part-1, too.
The building is a PWR type reactor building (R/B). This building is a compound building consisting of an outer shield (O/S), inner concrete (I/C), fuel handling building (FH/B), enclosure building (E/B), and a containment vessel (C/V). Figure 2 shows the locations of each building and Table 1 shows the abbreviations and materials of these buildings.
O/S(RC)
E/B(RC) I/C(RC)
FH/B(RC) FH/B(Steel) C/V(Steel)
Figure 2. Position of each building consists of the reactor building
Table.1. Abbreviations and materials
Building Abbreviation Material
Outer Shield O/S RC Inner Concrete I/C RC
Upper part
FH/B Steel Fuel
Handling Building
Lower part
FH/B RC Enclosure Building E/B RC Containment Vessel C/V Steel
4
BUILDING FRAGILITY EVALUATION PARAMETER CONDITION
4.1 Consideration of Variations in Response
Variations in the response were generally considered by dividing them into aleatory uncertainty (βr) and
epistemic uncertainty (βu). The former corresponds to the randomness of materials, and the latter corresponds
to the unknown of the analysis, mainly. In this study, only βr are considered to evaluate the building fragility
In Japanese PSA study, the concrete strength, concrete damping coefficient, and soil shear wave velocity etc. are generally considered as variable parameters for βr. Miake et al. (2005) conducted a study on
the value of βr for the building response considering these variable parameters, and showed that the value of
βr of the maximum response shear strain was approximately 0.2. Based on this, the value of βr of the
maximum response shear strain is taken to be 0.2 in this study. Furthermore, the value of βr of the maximum
response vertical stress was also taken to be 0.2.
4.2 Failure Mode and Strength Settings
In the explanatory note 66 of the PSA standard, shear failure of shear walls is given as the dominant failure mode for Japanese general nuclear power plant buildings. Furthermore, the effect that local damage has on the building is relatively small, compared to entire destruction of the story of the building.
In this study, bending failure and compressive failure are considered as building failure modes in addition to shear failure (refer to Table 2). In order to evaluate the damage to an entire story instead of the damage at the local element level, evaluation was made by averaging the shear strain and axial stress of each story across the corresponding web and flange regions. The averages of flange regions were calculated separately on the northern and the southern side.
Table 3 shows the mean value and variation of the ultimate shear strain of shear walls and the compressive strength of concrete. They are used as the strength values for the damage probability calculation based on Appendix 5 (regulations) and Appendix 9 (regulations) of the PSA standard. Because the shear walls are modeled using layered shell elements, the response values for concrete in the outermost layer are used in all cases.
Table.2. Fracture modes considered in this paper
Direction of input ground motions
Failure modes for shear walls
Index for response
for shear walls Index for strength
Shear failure in web parts
Averaged shear strain
Ultimate shear strain of shear
walls Horizontal only
or simultaneous horizontal and
vertical
Bending failure in flange parts Vertical only
or simultaneous horizontal and
vertical
Compressive failure
Averaged axial force
Compressive strength of
concrete
Table.3. Fracture modes considered in this paper
Index for strength Mean Coefficient
of variation Median
Logarithm standard deviation
Box walls 5.36 x 10
-3
rad 0.24
5.21 x 10⁻³
rad 0.24 Shear
stress
Cylindrical walls
9.77 x 10⁻³
rad 0.32
9.30 x 10⁻³
rad 0.32
Compressional strength
34.0
N/mm2 0.13
33.7
4.3 Fragility Curve Calculation
The fragility curves of the FEM model and lumped mass model in each analysis case are calculated as follows. First, the damage probability was plotted on a diagram for each input acceleration level where analysis was conducted. The damage probability is calculated by considering the βr of the response and
strength value. The plotted points are approximated by a lognormal cumulative distribution function using the least squares method, which is taken to be the fragility curve.
5
BUILDING FRAGILITY EVALUATION
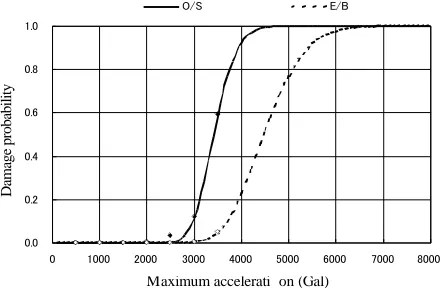
Figure 3 shows the curves with the highest damage probability for the O/S and E/B from among the fragility curves calculated for each story of the web regions in the O/S and E/B in the basic case. Among these, the O/S at the height around EL.+45.3m is critical.
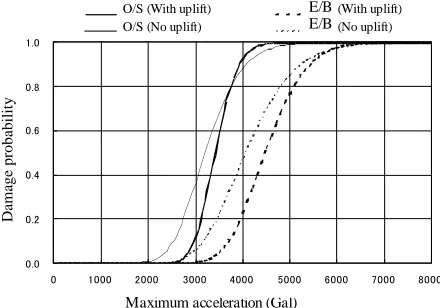
Figure 4 shows a comparison of the fragility curves for horizontal input only and for simultaneous horizontal and vertical input, and Figure 5 shows a comparison between the case where uplift was considered and when uplift was ignored. In both figures, differences in the fragility curves of the critical O/S are small. This shows that the effects of vertical motion and basemat uplift on the building fragility evaluation were relatively small.
Figure 6 shows a comparison between the basic case using the FEM model and horizontal input only using the lumped SR model. In the lumped mass SR model results, the damage probability is overall larger than the FEM model results for the same input. Furthermore, the E/B is more easily damaged than the O/S, and this tendency is thought to correspond with the results shown in Figure 13(b) of Part-1. In the above results, the fragility curve of the lumped mass SR model exhibited a tendency to estimate the damage larger when compared to the FEM model, and the difference was particularly large in the E/B.
!"! !"# !"$ !"% !"& '"!
! '!!! #!!! (!!! $!!! )!!! %!!! *!!! &!!!
+,-./01234
5678
9:; <:=
Maximum accelerati on (Gal)
Figure 22! Fragility curves of each position for simultaneous input (considering uplift)
D
am
ag
e
p
ro
b
ab
il
it
y
Figure 3. Fragility curves of each position for simultaneous input (considering uplift)
!"! !"# !"$ !"% !"& '"!
! '!!! #!!! (!!! $!!! )!!! %!!! *!!! &!!!
+,-./01234
5678
9:;<=>?@ABCDE F:G<=>?@ABCDE
9:;<=>HICDE F:G<=>HICDE
Maximum acceleration (Ga l)
Figure 23 Comparison of fragility curves between simultaneous input and horizontal input only
D
am
ag
e
p
ro
b
ab
il
it
y
O/S (H+V input) O/S (H only input)
E/B (H+V input) E/B (H only input)
!"! !"# !"$ !"% !"& '"!
! '!!! #!!! (!!! $!!! )!!! %!!! *!!! &!!!
+,-./01234
5678
9:;<=>?@AB C:D<=>?@AB 9:;<=>?EFB C:D<=>?EFB
Maximum acceleration (Gal)
Figure 24! Comparison of fragility curves between when uplift is considered and when neglected
D
am
ag
e
p
ro
b
ab
il
it
y
O/S (With uplift) O/S (No uplift)
E/B (With uplift)
E/B (No uplift)
Figure 5. Comparison of fragility curves between when uplift is considered and when neglected
!"! !"# !"$ !"% !"& '"!
! '!!! #!!! (!!! $!!! )!!! %!!! *!!! &!!!
+,-./01234
5678
9:;<=>?@ ABC >:D<=>?@ ABC
9:;<;E@ ABC >:D<;E@ ABC
Maximum acceleration (Gal)
Figure 25! Comparison of fragility curves between 3D FEM model and lumped mass SR model
D
am
ag
e
p
ro
b
ab
il
it
y
O/S (FEM) O/S (SR)
E/B (FEM)
E/B (SR)
Figure 6. Comparison of fragility curves between 3D FEM model and lumped mass SR model
6
CONCLUSION
In this paper, the building fragility evaluation of the seismic PSA was carried out using the 3 dimensional nonlinear FEM model based on the result of part-1.
As the fracture modes, the shear failure of the web wall and the flexural failure and the compressive failure of the flange wall were assumed. The fragility curves of the FEM model and lumped mass model in each analysis case were calculated as follows. First, the failure probability was plotted on a diagram for each input acceleration level where analysis was conducted. The failure probability is calculated by considering the aleatory uncertainty of the response and strength value. The plotted points are approximated by a lognormal cumulative distribution function using the least squares method, which is taken to be the fragility curve. From the study, the following results were obtained
(1) In terms of the failure mode of the envisioned reinforced concrete seismic walls, shear failure preceded flexural failure and compressive failure.
(2) In the evaluation of shear strain, the difference between the fragility evaluations for horizontal input only and simultaneous horizontal and vertical input was small, and thus the effect of vertical input was relatively small.
(3) The effect of basemat uplift on fragility evaluation was relatively small.
REFERENCES
Atomic Energy Society of Japan (2007), A Standard for Procedure of Seismic Probabilistic Safety Assessment (PSA) for Nuclear Power Plants 2007
Japan Electric Association (1991a), “Chapter 4.2: Evaluating Method for the Restoring Force Characteristics of Reinforced Concrete Shear Walls”, Technical Guidelines for Earthquake Resistant Design of Nuclear
Power Stations JEAG4601-1991 Supplement, pp. 79-97
Japan Electric Association (1991b), “Chapter 5: Evaluating Method for Basemat Uplift of a Building during an Earthquake”, Technical Guidelines for Earthquake Resistant Design of Nuclear Power Stations
JEAG4601-1991 Supplement, pp. 131-138
Karsan,I.D., Jirsa, J.O., (1969), Behavior of Concrete under Compressive Loading, Journal of Structural
Division, ASCE, pp. 2543-2563
Kasuga, Y., Kambayashi, A., et al. (2000), Nonlinear Seismic Response of a PWR-type Reactor Building Simulated by a 3-D FEM Model, Proc. of 12th WCEE, Paper No. 1091
Kasuga,Y., Tsunashima, N., et al. (2003), Analytical Study on Non-linear Seismic Behavior of a Large Scale Reinforced Concrete Structure, Journal of Structural Engineering, AIJ, vol. 49B, pp. 193-202
Kennedy, R.P., Ravindra, M.K., (1984), Seismic Fragilities for Nuclear Power Plant Risk Studies. Nuclear
Engineering and Design, Vol.79, pp.47-68
Miake, M., Kobayashi, K., et al., (2005), Study into uncertainties in fragility evaluations of nuclear power plant buildings part 1: Study into the effects of aleatory uncertainty. Summaries of the Architectural Institute
of Japan: pp.1103-1104
Naganuma, K., (1991), Nonlinear Analytical Model for Reinforced Concrete Panels under In-Plane Stresses : Study on nonlinear analytical method for reinforced concrete wall structures (Part 1), J. of Struct. Constr.
Eng., AIJ, No. 421, pp. 39-48
Nakamura, N., Kasuga, Y. (2003), Analytical Study on Energy Consumption of Reinforced Concrete Shear Walls Subjected to Cyclic Horizontal Loading, Journal of Structural and Construction Engineering, AIJ, No. 565, pp. 87-94
Nakamura, N., Ino, S., et al. (2007a), An Estimation Method for Basemat Uplift Behavior of Nuclear Power Plant Building, Nuclear Engineering and Design, Vol.237, pp.1275-1287
Nakamura, N., Fushimi, M. (2007b), Study on Modeling Error in Strong Nonlinear Area of Structure in Fragility Evaluation of NPP Buildings, AIJ Journal of Technology and Design, No. 26, pp. 499-504
Nakamura, N., Yabushita, N., et al., (2008), Analyses of reactor building by 3D nonlinear FEM models considering basemat uplift for simultaneous horizontal and vertical ground motions, Nuclear Engineering
and Design, Vol.238, pp.3551-3560
Nuclear Safety Commission of Japan (2006), Memorandum Regarding Revisions of the Safety Policies in Relation to Earthquake Resistance Safety in the “Regulatory Guide for Reviewing Seismic Design of Nuclear Power Reactor Facilities”
Ohmiya, Y., Yabana, S., et al. (1995), Parts 1 and 2 of Nonlinear Analysis on RC Shear Wall Under Cyclic Loads, Summaries of Technical Papers of Annual Meeting, AIJ, pp. 835-838
Okazaki, A., Yoshida, S., et al. (1994), Parts 1 to 4 of Study on Evaluation Method of Failure Probability for Reactor Buildings, Summaries of Technical Papers of Annual Meeting, AIJ, pp. 1651-1658
Stevens, I.D., Uzumeri, S.M., Collins, M.P., (1987), Analytical Modeling of Concrete Subjected to Monotonic and Reversed Loadings, Department of Civil Engineering, Publication No.87-1, Univercity of Toronto
Tajimi, H. (1959), Foundational Study Relating to Earthquake Resistance Theory, Annual Report of the
Institute of Industrial Science, University of Tokyo, Vol. 8, No. 4, pp. 170-215
Ueda, M., Seya, H., et al (1997), Nonlinear Analysis on RC Shear Wall Shaking Table Test, Proc. 14th
Yamada, K., Aoyagi, M., (1983), Shear Transfer across Crack, Proc. of JCI 2nd Colloquium on Shear
Analysis of RC structures, pp. 19-28
Yamada, M., Kawamura, H., Morisita, H., (1977), A Study on Plastic fatigue of Concrete, Summaries of