ABSTRACT
MCCARTHY, KARA SHEA. Attributes of Fluid Milk Affecting Purchase and Preference. (Under the direction of Dr. Mary Drake).
Fluid milk has seen a steady decline in consumption while non-dairy alternatives have seen a jump in sales. Milkfat contributes flavor, color, and viscosity to fluid milk and can affect purchase habits. In addition to milkfat content, other product attributes may drive purchase of fluid milk. The objective of this thesis was to determine how much difference in milkfat content was needed to produce a noticeable difference and how milkfat affected preference in fluid milk. The second objective was to determine key attributes of dairy milk and non-dairy alternatives that drive purchase and determine the underlying reason as to why these attributes were important to consumers. Two different studies were conducted to evaluate preference in relation to milkfat content in fluid milk and to determine what other product attributes were important to consumers in driving beverage choice between fluid milk and non-dairy alternatives.
In the first study, thirteen threshold tests were conducted to determine the just noticeable difference (JND) of milkfat in skim (0.1%), 1%, 2%, and whole (3.25%) milk under two conditions: tasting-only and visual-only. Preference testing was then conducted with milk consumers to determine how varying levels of milkfat affected consumer
Attributes of Fluid Milk Affecting Purchase and Preference
by
Kara Shea McCarthy
A thesis submitted to the Graduate Faculty of North Carolina State University
in partial fulfillment of the requirements for the Degree of
Master of Science
Food Science
Raleigh, North Carolina
2015
APPROVED BY:
_______________________________ ______________________________ Dr. Mary Drake Dr. Edward Allen Foegeding
Committee Chair
ii
DEDICATION
iii BIOGRAPHY
Kara McCarthy was born in Upper Sandusky, OH on April 25, 1991 to Dr. F.D. McCarthy and Joy McCarthy. She grew up on a sheep farm and was an active member of 4-H. After high school she attended The Ohio State University to pursue a Bachelor’s Degree in Food Science and Technology. She joined Dr. MaryAnne Drake’s lab as a graduate
iv
ACKNOWLEDGEMENTS
I would like to thank my parents for always loving and supporting me and setting such wonderful examples for me to live by. Thank you to my brother, Rory, for suggesting I contact Dr. Drake when I was searching for graduate programs and for continuing to give me professional advice whenever I need it. Thank you to my sister, Darcy, who may not have given much advice pertaining to graduate school but came to visit several times while I have lived so far from home. To Dr. MaryAnne Drake, who has not only had immense patience with my constant questions but opened her home to me and welcomed me as family. She has not only taught me everything I know about sensory and given me the opportunity to attend workshops most graduate students would never but she has become someone I can go to for matters beyond school and work. I will miss our walks and chats but thank goodness for technology so I can still pester her after I have moved.
v
without all of your help. And thank you all for waking up at the crack of dawn to help me run my panels and tasting my tons of milk samples!
vi
TABLE OF CONTENTS
LIST OF TABLES viii
LIST OF FIGURES xi
CHAPTER 1: LITERATURE REVIEW. FLUID MILK CONSUMPTION AND
FACTORS AFFECTING CONSUMER LIKING 1
ABSTRACT 1
INTRODUCTION 1
Milk Defined 3
Milk Components Contributing to Flavor 5
Dairy Cattle Feed Intake 6
Conjugated Fatty Acids 8
Raw Milk Quality 9
Milk Heat Treatment 10
Milkfat 11
Viscosity and Creaminess 14
Milk Aftertaste 15
Milk Solids-non-fat 16
Lactose-free 17
Milk Labeling 18
Packaging Options 20
Oxidation in Milk 21
The Role Habit Plays 22
CONCLUSION 23
REFERENCES 24
CHAPTER 2: MILKFAT THRESHOLD DETERMINATION AND THE EFFECT OF
MILKFAT CONTENT ON CONSUMER PREFERENCE OF FLUID MILK 36
INTERPRETIVE SUMMARY 38
ABSTRACT 39
INTRODUCTION 41
MATERIALS AND METHODS 43
Sample Preparation 43
Threshold Tests 44
Preference Testing 46
Preference Follow-up Interviews 47
Descriptive Analysis 47
Statistical Analysis 48
RESULTS AND DISCUSSION 49
Threshold Tests 49
Preference Testing 50
vii
Descriptive Analysis 54
CONCLUSIONS 55
ACKNOWLEDGMENTS 57
REFERENCES 58
CHAPTER 3: DRIVERS OF CHOICE FOR FLUID MILK VERSUS NON-DAIRY ALERNATIVES: WHAT ARE CONSUMER PERCEPTIONS OF FLUID MILK? 70
INTERPRETIVE SUMMARY 72
ABSTRACT 73
INTRODUCTION 75
MATERIALS AND METHODS 78
Experimental Overview 78
Conjoint Analysis 79
Means-end Chain Analysis 81
Statistical Analysis 82
RESULTS AND DISCUSSION 83
Online Survey 83
Means-end Chain Analysis 88
CONCLUSIONS 91
ACKNOWLEDGMENTS 94
viii
LIST OF TABLES CHAPTER 2
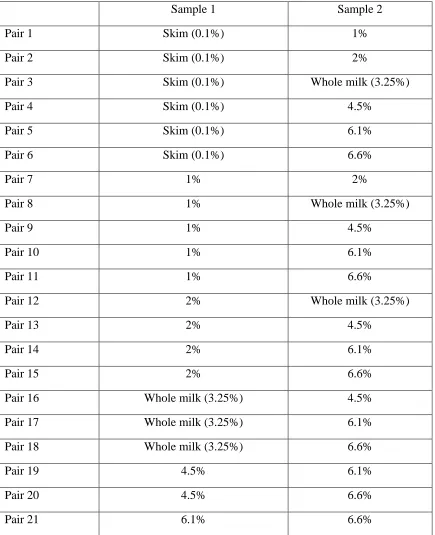
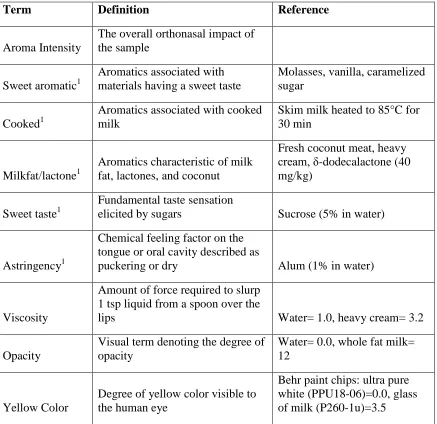
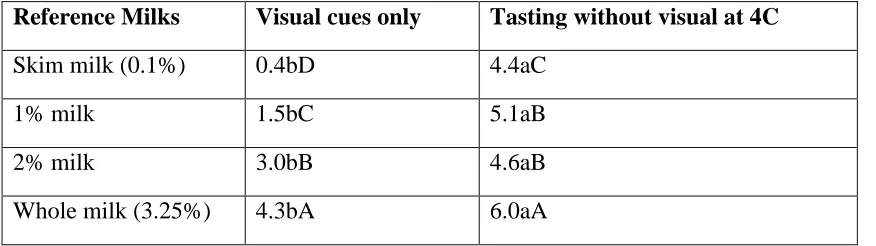
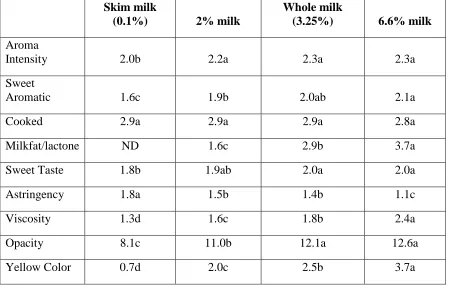
Table 1. Sample pairs used for 2-AFC preference tests 62 Table 2. Trained panel sensory attributes for fluid milk 63 Table 3. The amount of milkfat increase needed to produce the just noticeable difference (JND) in each reference milk for each test condition 64 Table 4. Descriptive analysis of milks used in follow-up interviews 69 CHAPTER 3
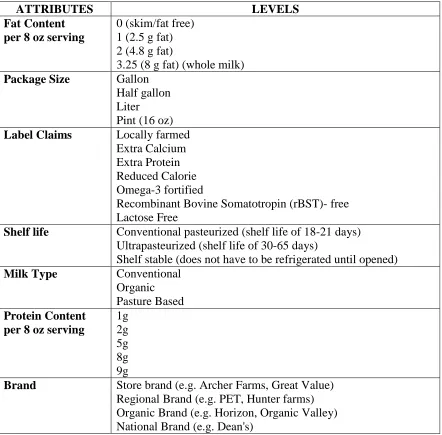
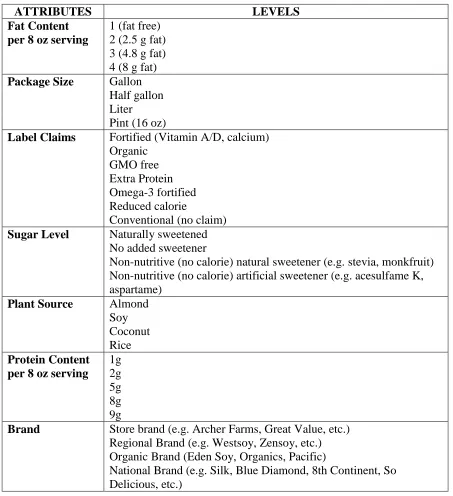
Table 1. Attributes and levels used for dairy conjoint analysis 100 Table 2. Attributes and levels used for non-dairy conjoint analysis 101 Table 3. Dairy beverage conjoint importance scores 102 Table 4. Dairy beverage conjoint utility scores 103 Table 5. Non-dairy beverage conjoint importance scores 104 Table 6. Non-dairy beverage conjoint utility scores 105 Table 7. Kano results for dairy milk with all dairy consumers and consumers who drink both dairy and non-dairy alternatives (B) 108 Table 8. Kano results for non-dairy alternatives with all non-dairy consumers and
ix
LIST OF FIGURES CHAPTER 2
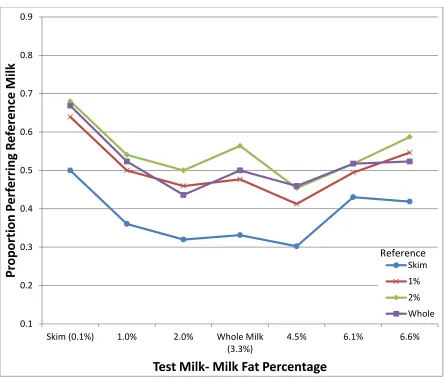
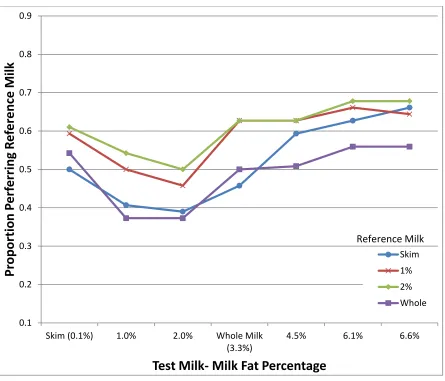
Figure 1. Preference curves for milks with different fat contents for "all consumers (n=172)". Each line represents the designated reference milk in the pair. The x-axis represents the test milk in the forced-choice preference (2-AFC) pair. Identical pairs were not tested to eliminate extra tasting sessions, points are placed at 50% at those
pairs on the graphs to aid in visualizing relationships. 65
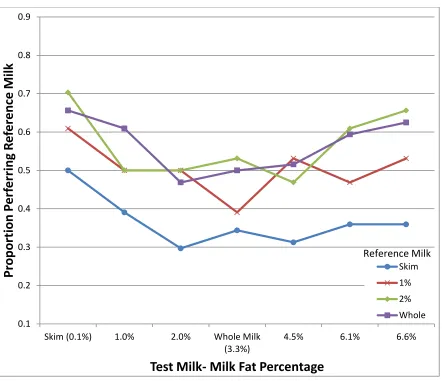
Figure 2. Preference curves for milks with different fat contents for self-reported "skim milk drinkers (n=59)" Each line represents the designated reference milk in the pair.
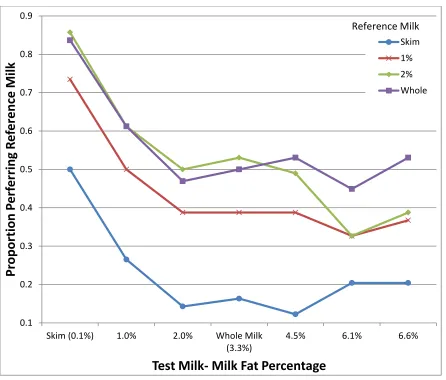
The x-axis represents the test milk in the forced-choice preference (2-AFC) pair. 66 Figure 3. Preference curves for milks with different fat contents for self-reported
"low-fat milk drinkers (n=64)" Each line represents the designated reference milk in the pair. The x-axis represents the test milk in the forced-choice preference (2-AFC) pair. 67 Figure 4. Preference curves for milks with different fat contents for self-reported
"whole milk drinkers (n=49)" Each line represents the designated reference milk in the
pair. The x-axis represents the test milk in the forced-choice preference (2-AFC) pair. 68 CHAPTER 3
Figure 1. Principal component biplot of dairy consumer clusters with respect to utility
scores 106
Figure 2. Principal component biplot of non-dairy consumer clusters with respect to
utility scores 107
Figure 3. Hierarchical value map for consumers of dairy milk (n=75) 110 Figure 4. Dairy milk hierarchical value map for consumers of both types of beverages
(n=78) 111
Figure 5. Hierarchical value map for consumers of non-dairy alternative beverages
(n=68) 112
Figure 6. Non-dairy alternative beverage hierarchical value map for consumers of both
1
CHAPTER 1: LITERATURE REVIEW. FLUID MILK CONSUMPTION AND FACTORS AFFECTING CONSUMER LIKING
ABSTRACT
Consumption of fluid milk has been in decline since the 1970’s. Sales of whole milk
have decreased while reduced fat and skim milk control a larger portion of the market than ever before. Many factors may contribute to the decline in milk consumption including changing demographics and beverage competition. Many factors can affect the flavor of milk and with it, consumer acceptance. Milkfat can increase liking due to flavor but consumer education and misconceptions drive consumers away from whole milk compared to reduced fat or skim milk. Addition of solids-non-fat to milk increases consumer acceptance of milks while milk aftertaste is a driver of dislike for women who do not consume milk. Dairy cow husbandry all the way to milk marketing can affect milk liking and milk consumption.
INTRODUCTION
2
in total organic milk product sales despite the overall continued decline in all fluid milk purchases (Agriculture Marketing Service, 2014).
Several factors may contribute to the decline in fluid milk sales, including but not limited to; beverage competition, delayed investment in new and innovative products, and the changing demographic profile of the United States (Krebs, 2013). Statistics show that
individuals in the U.S. still consume the same amount of beverages as in the past but that there has been a shift in what they are drinking. Since 2002, milk has decreased by two percent in the share of total beverages consumed while coffee, tea, and bottled water have all increased. Bottled water showed the most growth with an eleven percent increase in the last decade. Contributing to this shift, overall beverage competition has increased in the last ten years with over 8,000 new teas, 4,850 new juices, and 2,550 new energy and sports drinks compared to just 1,170 new fluid milk beverages (Krebs, 2013). With the wide selection of beverages to pick from, consumers have become less likely to drink milk at meals and on the go, reducing the overall consumption occasions. This highlights one example that while milk has always paired with cereal, breakfast on-the-go items can be paired with a variety of drinks.
3
of existing products but prove a challenge in staying within those regulations when making new products in compared to other beverage types with more flexibility (Krebs, 2013).
In addition to increased competition and fewer new fluid milk products, the demographics of the U.S. population are changing and with it, milk consumption (Krebs, 2013). The Hispanic population is set to increase by 33 percent by 2020 but their milk consumption will grow at a slower rate than their population boom (Krebs, 2013). Overall, Hispanics are cutting back on their milk consumption. Recent data has shown 15-18 % of Hispanic teens consume milk compared to 18-24% of their non-Hispanic counterparts (Krebs, 2013). While the racial profile of the U.S. is changing, so is average household income. Household income has been on the rise and with increased household income, whole milk purchases are negatively affected (Stewart et al., 2012). A trend has also been detected that as older generations are decreasing in population and newer generations are serving as more dominant consumers in the market place, fluid milk consumption is declining in part to that change. It is hypothesized that consuming milk as a child drives purchase of milk as an adult. The younger generations of today that are now entering the workplace and starting families of their own, grew up with multiple beverage choices for every occasion. Because of this, milk may have not been consumed as much in their childhood as their parents’ or their grandparents’ younger years. Lack of childhood milk consumption could be another cause in
the decline of fluid milk purchasing seen today (Stewart et al., 2012). Factors affecting consumer liking and fluid milk flavor will be explored in this review.
Milk Defined
4
safe processing of fluid milk, both overseen by the U.S. Food and Drug Administration. Milk is defined by the Code of Federal Regulations Title 21, as the lacteal secretion from healthy cows that is free from colostrum. It must be pasteurized or ultrapasteurized and it must contain at least 8.25% solids-non-fat and 3.25% milkfat. Milk may be adjusted by separating the milkfat, adding cream, concentrated milk, dry whole or skim milk powder, concentrated skim milk, or fluid skim milk. Milk may be homogenized but is not required.
Homogenization is the use of pressure to cause a reduction in fat globule size, which in turn increases the milk fat surface area and keeps the milk fat suspended in the continuous phase of the milk preventing the formation of a milkfat layer at the top (Cano-ruiz and Richter, 1997). Any milk that has reduced milkfat must have vitamin A (minimum of 2000
5
each state makes its own laws about sale of raw milk to consumers. In about half of the fifty states in the U.S., sale of raw milk directly to consumers is legal (CDC, 2013).
Milk Components Contributing to Flavor
Chemical changes in milk components can affect milk flavor due to processing or chemical reactions. Milk is typically made up of 3.2% w/w protein which includes casein, serum proteins (including whey proteins), and enzymes (Walstra et al., 2006). Denatured whey proteins play an important role in the cooked flavor of shelf stable milk products by the compounds produced during denaturation such as sulfhydryls from the breakdown of
disulfide bonds. Denaturation of B-lactoglobulin is thought to be a main contributor of cooked flavor due to the high number of thiol groups (Walstra et al., 2006). Denatured whey proteins also can contribute cabbage, sulfur, or caramel flavors due to Maillard reactions or caramelization from heating (Varnam and Sutherland, 1994). A decrease in cooked sulfurous flavors has been shown in milks with high oxygen content but that leads to an increased chance of oxidation of fat leading to rancid flavors in the milk. The degradation of
methionine to methional through light activated reactions can also impart off flavors in milk (Varnam and Sutherland, 1994).
6
et al., 2006). Minerals such as iron or copper can induce oxidation of fats as well as UV exposure. Lipids constitute about 4.0% w/w of milk components and can contribute to the creamy or rich flavors in milk (Walstra et al., 2006). Heat processing can also affect milkfat through the formation of lactones and methyl ketones which impart typical milkfat or coconut type flavors (Varnam and Sutherland, 1994).
Dairy Cattle Feed Intake
7
system of cows fed silage. Control 2% milk versus milk with pronounced feed flavor was preferred by consumers in an older study (Modler et al., 1977).
A trained descriptive analysis panel differentiated milk flavor from pasture fed cows compared to cows on a total mixed ration. Grassy flavors were documented in 1.5% milkfat milk from cows on a pasture diet. Consumers, however, were not able to differentiate the two milk sources and there was not a significant difference in liking between the milk from pasture fed cows and the milk from cows on total mixed ration (Croissant et al., 2007). Villeneuve et al. (2013) had 30 untrained panelists evaluate milk from cows fed hay, silage, or pasture in a series of triangle tests. Panelists were able to detect a difference between the milk from cows on a hay diet verses cows on pasture but not cows fed hay verses cows fed silage. Assessors (n=30) were also asked to evaluate the three treatments for overall flavor intensity, grassy flavor, and sweet flavor. The largest percentage of assessors rated pasture milk the highest in overall flavor and grassy flavors and milk from cows fed hay the highest in sweet flavors. Larsen et al. (2012) observed reduced stale aroma and creamy flavor when cows were fed an increasing amount of Lucerne silage compared to maize silage.
Coppa et al. (2011) studied the effect of volatile compounds in milk from cows on a hay based diet, a highly diverse continuous grazing pasture diet, or a less diverse rotational pasture diet. Concentrations of β-pinene and cymene-(p) and all sesquiterpenes were higher
8
milk commercially and added iron in the form of ferrous sulfate at 0.3 mg/kg, 3mg/kg, and 30mg/kg. Triangle tests were conducted. Panelists were able to detect differences at all added iron levels when compared to control milk. It is thought, though, that copper naturally
present in milk does not contribute to fat autoxidation, only copper added into milk (Walstra et al., 2006).
Conjugated Fatty Acids
9
multiple dairy products made from high CLA milk enriched by fish oil and sunflower oil in the cows’ diet. There was a significant difference by triangle test of the control verses the
enriched milk however a trained panel did not detect a difference in any sensory attributes between the two samples.
Raw Milk Quality
The initial microbial quality of raw milk can affect shelf stability, safety, and flavor. The Pasteurized Milk Ordinance defines that bacteria in raw milk must not exceed 100,000 per mL from each individual milk producer and not more than 300,000 per mL in
commingled raw milk before pasteurization. Somatic cell count must not exceed 750,000 per mL for individual milk producers (U.S. Food and Drug Administration, 2009). Somatic Cell Count (SCC) refers to macrophages, leukocytes, secretory cells, and squamous cells per milliliter of raw milk. When a cow has an infection in the udder such as mastitis, SCC levels increase as a side effect of fighting the infection. There is an inverse relationship between SCC and quality/shelf life of pasteurized milk (USDA APHIS, 2011). High SCC and the enzymes associated with infection will cause protein and fat degradation, producing off-flavors. High levels of psychrotrophic bacteria in raw milk can produce heat-stable proteases and lipases that survive pasteurization. If present, these enzymes will then be active in the refrigerated pasteurized milk (Barbano et al., 2006). Flavors typically associated with microbial activity include acid, malty, and fruity. Unclean, bitter and putrid flavors are often caused by psychrotrophic organisms. Just as important, refrigerated pasteurized milk shelf life is decreased.
10
their growth. Bacteria introduced from the teats of a cow’s udder can include Micrococcus
spp., coagulase-negative Staphylococcus spp., Enterococcus spp., coryneforms, Bacillus spp., coliforms, and other gram-negative rods. Insufficiently cleaned equipment can introduce
Lactococcus spp., Pseudomonas spp., and coliforms. Bacteria that can multiply if milk is not cooled properly can include fast-growing psychrotrophic bacteria, such as Pseudomonas fluorescens (Holm et al., 2004). Spoilage can also occur due to Streptococcus spp.,
Lactobacillus spp., or Enterobacteriaceae spp. (Varnam and Sutherland, 1994). Spores can also be produced by bacteria like Bacillus sporothermodurans which is non-pathogenic but spores produced will survive UHT-treated milk and germinate causing spoilage of milk and a shorter shelf life (Aouadhi et al., 2012). Rapid cooling and holding at 4.4C or below inhibit multiplication of bacteria in raw milk (Shipe et al., 1978). Milking cows in loose boxes and milking parlours produce significant lower microbial loads than cows housed in stanchion barns and milked with a pipeline milking machine (Cempirkova, 2002). Keeping facilities and equipment clean can help to prevent introduction of new bacteria and pasteurization will kill heat sensitive bacteria already present in milk.
Milk Heat Treatment
Pasteurization is the process of heating milk to a high enough temperature and holding it there for a long enough time to kill bacteria which can cause illness in humans. It does not significantly change the nutritional benefits of milk (CDC, 2013), it can however impart flavors due to processing and effect consumer liking. Requirements for milk
11
seconds. Ultra-pasteurization refers to dairy products that have been thermally processed at or above 138C for at least 2 seconds. After heat processing (pasteurization or
ultra-pasteurization) bacteria counts must be less than 20,000 per mL and coliforms may not exceed 10 per mL (U.S. Food and Drug Administration, 2009). Adult U.S. consumer acceptability was evaluated with 2% milk using different heat treatments of 77, 79, 82, and 85C. On day zero (the day of pasteurization), consumers preferred the 79C treated milk but by day six, milk pasteurized at 79C and 82C was highly acceptable to all consumers
compared to the other treatments at 77C, and 85C. The authors concluded that differences in liking scores decreased as shelf-life increased (Gandy et al., 2008). Children ages 6-11y determined preferences between ultra-pasteurized (UP) milk, high-temperature-short-time (HTST) milk, and ultra high temperature (UHT) milks. The children preferred HTST treated milk over UHT and both of those treatments over UP treated milk. How children scored the samples was correlated to how they felt about milk in general (Chapman and Boor, 2001). UHT milks were profiled by a trained panel with samples from 7 different countries at whole, 2%, and low-fat milkfat levels. Findings were not consistent between countries or fat levels, suggesting sensory properties are more dependent on the individual manufacturing practices and heat treatment levels (Oupadissakoon et al., 2009). In a study to determine drivers of liking of fluid milk among Korean women, consumers who frequently drank plain milk, preferred UHT treated whole milk. It was suggested that this result was because UHT processing is much more common in Korea than HTST processing of milk (Chung, 2009).
Milkfat
12
variety of flavors from cardboard, oily, painty, fishy, grassy, oxidized, cucumber, creamy, and fruity all can originate from oxidized milkfat. Nonoxidative flavors like waxy and rancidity along with fruity or solvent-like from methyl ketones and coconut flavor from lactones are some additional flavors imparted by milkfat (Kinsella et al., 1967). Milkfat was tested compared to other fats for the role it plays in milk flavor by addition of different fat sources to skim milk. Beverages were evaluated by a panel for flavor quality and desirability. Untreated milkfat from whole milk concentrate and partially deodorized milkfat were the only fat sources that improved the flavor of skim compared to other tested fat sources of coconut oil, corn oil, and safflower oil. This result indicated that the desirable flavors in milk come from compounds probably unique to milkfat specifically (Tamsma et al., 1969). Raats and Shepherd (1992) used assessors and free choice profiling to profile products made with milk of different fat levels. “Dairy/milky” was used more frequently in products made of
milks higher in fat whereas products made with skim were described by non-dairy related terms that were specific to that product. Tepper and Kuang (1996) evaluated the perception of fat content in a skim milk matrix. They concluded that it was the added cream flavor and not the content of vegetable oil that provided the sensation of higher fat content.
The amount and composition of milkfat in milk can be changed by what feed is given to the cows. Milkfat composition is changed more by the dietary fat than any other
13
is also affected by the stage of lactation, short chain fatty acids are low in concentration initially but increase until 8-10 weeks into lactation (Palmquist and Beaulieu, 1993).
Fat imparts flavor but what is the perception towards milkfat and do consumers prefer high milkfat products? Consumer perception of milk as a commodity was positive in a study that looked at the difference between whole milk, reduced fat milk, and soy milk (Bus and Worsley, 2003). However most misconceptions about whole milk were related to its perceived high fat, cholesterol, and calories. In the questionnaire, whole milk scored the highest in ‘feels good in the mouth’ and ‘tasty’ but reduced fat milk scored the highest in ‘necessary in my diet’ (Bus and Worsley, 2003). Chung (2009) evaluated at Korean females
acceptance of milk, and liking was positively correlated with sweetness, sweet cream flavor, and smooth texture but negatively correlated with grassy and rancid flavor. Analysis of the Continuing Survey of Food Intakes by Individuals indicated that low-fat milk consumers were positively related to older age, education level, and income (Robb et al., 2007). In a study of 100 subjects, 42% drank skim, 36% drank 2% reduced fat, 27% drank 1%, and 18% drank whole milk. In a belief evaluation, skim milk had lower scores for taste and texture. Acceptance testing showed that consumers liked whole milk more than skim but milkfat content in milks were inversely correlated with average scores for “good for me” belief
statements (Brewer et al., 1999). Researchers concluded that health concerns outweighed sensory attributes in purchasers of milk (Brewer et al., 1999). Palacios et al. (2009) observed two consumer segments for sensory attributes of cow’s milk, one segment that were sweet seekers and preferred reduced fat milk and fat free milk the same, and a second segment with “cream” seekers who preferred reduced fat milk. School age students (6-16 years) were
14
liked fat free milk over whole milk and low-fat milk. However what was not taken into consideration in liking was that the whole milk and low-fat milk came in the form of powder that needed to be rehydrated while the fat free milk arrived in liquid form. Trends were observed in increased liking of the same products the students usually consumed such as whole milk habitual consumers rated whole milk higher than consumers of low-fat and fat free milk (Lara-Zamudio et al., 2013).
Viscosity and Creaminess
15
appearance liking, and creaminess. Whole milk scored the highest in overall liking but not the highest in creaminess rating. It did however score the highest in appearance liking suggesting a possible relationship that appearance plays a role in overall liking. Viscosity was not scored in their study. Jervis et al. (2014) evaluated at the modality responsible for the perception of creaminess using sour cream. The parameters tested were visual only, stirring, blindfolded stirring, blindfolded tasting, blindfolded tasting with nose clips, and tasting with nose clips. Consumers were asked to evaluate their creaminess perception and overall liking of the products. The products that rated the highest in creaminess also scored high in overall liking. Flavor played the most important role in evaluating creaminess in full fat products but when the fat was removed, visual, physical stirring, and in-mouth texture became more important for creaminess perception.
Milk Aftertaste
16
samples had higher maximum intensities and persistence of sweet and sweet related attributes in the aftertaste. Chung (2009) demonstrated that overall liking scores of 10 milks (varying fat levels, heat treatments, and lactose free samples) from consumer tests with Korean females were positively correlated with the aftertaste liking scores. Milks that were liked the least had low liking scores in aftertaste.
Milk Solids-non-fat
Solids-non-fat (SNF) is calculated by subtracting the milkfat content from the total solids (U.S. Food and Drug Administration, 2015). SNF improved the flavor and consumer acceptance of milk beverages according to (Wahid-Ul-Hamid and Munus, 1960).
Standardizing 2% and 3% milk from 9.2% NFS to 12-15% total solids using a combination of cream, normal skim milk, condensed or reinforced skim milk, and/or distilled water increased consumer preference above that of unfortified 4% milk. However, when SNF was added to whole milk, consumer preference was shifted back to whole milk over lower-fat milks with SNF as long as the total solids were the same or higher than the other treatments (Devero, 1973). Adding SNF was more easily detected and had a greater influence on
17
Lactose-free
Lactose-free milk is a product that a segment of consumers purchase due to lactose intolerance. Lactose intolerance stems from a lack of the enzyme lactase which breaks lactose into monosaccharides for easier digestibility. Approximately 80% of Asians and Native Americans are lactose intolerant, 75% of African Americans, 51% of Hispanic Americans, and 21% of Caucasian Americans are also lactose intolerant (UGA, 2015). According to the Total U.S. Multi-Outlet + Conv. Retail Monthly Milk Snapshot, lactose free milk increased in volume sales by 6.5% in 2014 (DMI, 2014). There are no FDA
requirements for products to be labeled lactose free but it is required by law that
manufacturers must not mislead consumers (FDA, 2015). Lactose-free labeling is considered a nutrient claim and according to 21 CFR 101.13, the label may be used in such a case that the food would normally contain the nutrient and through processing the food contains little to none of the nutrient in the end. Lactose-free milk can be produced by the addition of lactase to hydrolyze lactose into monosaccharides and/or ultra or nanofiltration (Jansson et al., 2014; Adhikari et al., 2010). A trained panel conducted descriptive analysis on
commercially available lactose-free skim, reduced fat, and whole milk compared to their regular milk counterparts (Adhikari et al., 2010). Lactose-free skim was higher in chalky texture, lack of freshness, light oxidized, and processed flavors than the standard skim, along with fat feel, dairy fat flavor, dairy sweet, and overall sweetness. Lactose-free reduced fat milk was significantly different from regular reduced fat milk with higher intensities of color, chalkiness, viscosity, cooked flavor, and sweetness. Lactose-free whole milk was also
18
testing, regular whole milk was liked best while lactose-free skim was the least accepted. Lactose-free reduced fat and lactose-free whole milks were at parity with regular skim and reduced fat milk (Adhikari et al., 2010). Chapman et al. (2001) conducted descriptive
analysis on ultrapasteurized lactose-free milks and regular milks. Lactose-free milks were all different from regular milks in sweetness, caramelized flavor, and viscosity. The perceived difference in viscosity was thought to be related to the increase in sweetness of the lactose-free samples. A separate study evaluated consumer acceptance of lactose-lactose-free milk amongst 893 participants compared to soy beverages. Two percent fat lactose-free cow’s milk scored the highest in liking followed by lactose-free skim which was rated higher than soy milk (Palacios et al., 2009). Palacios et al. (2010) reported that children rated lactose-free cow’s milk higher than soy milk in flavor acceptance.
Milk Labeling
Factors other than flavor can affect milk consumption and what type of milk is purchased. Black women, employed women, rural area women, and women who smoked were less likely to consume milk but by location, women in the Midwest, West, and
Northeast were more likely to consume milk compared to other regions of the United States (Kim and Douthitt 2004). Labeling of milk affects purchasing amongst market options. Legally, the name milk may be followed by any characterizing flavoring and on the principal display panel or panels on the label where the font is not less than half the height of the word ‘milk,’ manufacturers may also claim vitamin addition, the heat process used, and if the milk
19
households, affluent households, and household heads with some college education were more likely to purchase organic milk. Their study also showed that once a decision was made to buy organic, households stayed with that choice even as size increased. By regulations of the FDA, to label a product as 100% Organic, the product must only be made from organic materials or in the case of milk, cow’s fed only organic ingredients. To be labeled as
Organic, the product must contain at least 95% organic material and must be certified by a third-party organization accredited by the USDA (Food Marketing Institute, 2004). The feed the milking cattle receive must be at least 95% organic material but not necessarily pasture based. Cattle must be managed organically for 12 months prior to application of certification and a producer must be inspected annually after certification is obtained (U.S. Food and Drug Administration, National Organic Program, 2013). No studies were found where flavor of organic milk versus conventional were compared. Kiesel and Villas-Boas (2007) showed that the use of the USDA organic seal increased purchase probability of organic milk.
Omega-3 fatty acids as a nutrient addition must meet the 10 percent minimum
nutrient requirement to be claimed on the label. To label milk as a good source of omega-3’s, manufacturers must ensure 10-19 percent of the recommended daily intake of such nutrient is present in the food according to 21 CFR 101.54. The milk may be labeled ‘high’ in such
nutrient if 1 serving contains 20 percent or more of the recommended daily intake (RDI). Other labels such as ‘grass-fed’ or ‘pasture based’ require that 99 percent of the cow’s energy source must come from grass and or forage (Agriculture Marketing Service, 2006).
20
biologically inactive if injected in humans or taken orally, and naturally occurring bGH and manufactured rbGH compounds are biologically indistinguishable (FDA, 2009). Voluntary labeling of rBGH free milk increased the demand for such products (Kiesel and Buschena, 2005). Dhar and Foltz (2005) found consumers were willing to pay significantly more for rBST-free and organic milk. Organic labeling did not affect purchase intent but did have a positive effect on consumer satisfaction for chocolate milk (Kim et al., 2013). Kanter et al. (2009), however, concluded that all milk types were stigmatized by rBST-free and organic labels. They hypothesized that the introduction of these labels could potentially reduce demand for all milk types.
Packaging Options
21
deteriorated in flavor faster than milk in barrier and foil boards. They concluded that the cardboard flavor migrated from the nonbarrier packaging into the milk. Mestdagh et al. (2005) showed packages with a light barrier provided protection from light oxidation while bottles with an active oxygen binding layer and bottles with a UV-absorbing additive did not. Green polyethylene terephthalate (PET) bottles and low-density polyethylene (LDPE)
pouches showed better protection against lipid oxidation and vitamin A degradation than clear PET bottles (Cladman et al., 1998). Multilayer pigmented bottles showed the best protection for shelf life followed by the monolayer titanium dioxide-pigmented high-density polyethylene (HDPE) bottle of the packages tested by Moyssiadi et al. (2004).
Oxidation in Milk
22
consumer acceptance decreased to an average of 3.5 (Walsh et al., 2015). Vitamin A degradation and light oxidation flavor development was explored by Whited et al. (2002).Whole milk, reduced fat, and skim milk samples were taken directly from the manufacturer and exposed to a fluorescent light box inside a cooler to imitate storage in grocery store shelves. Moderate oxidized flavors were detected by a trained panel in whole milk and reduced fat milk after 4 hours of light exposure while in skim, after 8 hours. Skim milk developed oxidized flavors at a slower rate than whole and reduced fat milk (Whited et al., 2002). Vickers et al. (1999) tested the relationship between liking ratings of light
oxidized milk with consumption habits. Throughout several experiments, consumers rated their liking of milk with light oxidation flavor and with light oxidation flavor. That same milk was then placed in the university dining hall to test if the off flavor affected
consumption. Results showed a difference in ratings by 1 point on the 9-point hedonic scale when consumers rated light oxidized flavored milk compared to defect free milk, with the control milk scoring higher. However they saw no difference in the consumption of control milk to the test milks in the cafeteria setting.
The Role Habit Plays
23
shown as a significant factor in consumption of sweet, salty, and fatty foods (Tuorila and Pangborn, 1988).
CONCLUSION
Many factors affect milk flavor, acceptance, and purchase among consumers. Milk fat contributes largely to milk flavor and to the appearance of milk but there are not many
24
REFERENCES
Adhikari, K., L.M. Dooley, E. Chambers IV, and N. Bhumiratana. Sensory Characteristics of Commercial Lactose-free Milks Manufactured in the United States. J Food Sci Technol. 2010;43:113-118.
Agriculture Marketing Service, United States Department of Agriculture. 2014. Estimated U.S. Sales (2000-2012). Accessed on June 8, 2014.
http://www.ams.usda.gov/AMSv1.0/ams.fetchTemplateData.do?startIndex=1&templ ate=TemplateV&navID=IndustryMarketingandPromotion&leftNav=IndustryMarketi ngandPromotion&page=FluidMilkSalesDataMonthlyandYeartoDate&acct=dmktord Agriculture Marketing Service, United States Department of Agriculture. 2006. United States
Standard for Livestock and Meat Marketing Claim, Grass (Forage) Fed Claim. Accessed on September 8,2015. http://www.gpo.gov/fdsys/pkg/FR-2006-05- 12/html/E6-7276.htm
Alviola IV, P.A., and O. Capps Jr. Household Demand Analysis of Organic and
Conventional Fluid Milk in the United States Based on the 2004 Nielsen Homescan Panel. Agribusiness. 2010;26:369-388.
Aouadhi, C., H. Simonin, H. Prévost, M. de Lamballerie, A. Maaroufi, S. Mejri.
Optimization of pressure-induced germination of Bacillus sporothermodurans spores in water and milk. Food Micro. 2012;30:1-7.
Barbano, D.M., Y. Ma, M.V. Santos. Influence of Raw Milk Quality on Fluid Milk Shelf Life. J. Dairy Sci. 2006;89:E15-E19.
25
Brewer, J.L., A.J. Blake, S.A. Rankin, L.W. Douglass. Theory of Reasoned Action predicts milk Consumption in women. J Am Diet Assoc. 1999;99:39-44.
Bus, A.E.M., and A. Worsley. Consumers’ Sensory and Nutritional Perceptions of Three Types of Milk. Public Health Nutr. 2003;6:201-208.
Campbell, W., M.A. Drake, and D.K. Larick. The Impact of Fortification with Conjugated Linoleic Acid (CLA) on the Quality of Fluid Milk. J. Dairy Sci. 2003;86:43-51. Cano-ruiz, M.E. and R.L. Richter. Effect of Homogenization Pressure on the Milk Fat
Globule Membrane Proteins. J Dairy Sci. 1997;80:2732-2739.
CDC (Center for Disease Control and Prevention). 2013. Raw Milk Questions and Answers. Accessed on June 8, 2014. http://www.cdc.gov/foodsafety/rawmilk/raw-milk-
questions-nd-answers.html
Cempirkova, R. Psychotrophic vs. Total Bacterial Counts in Bulk Milk Samples. Vet Med 2002;47:227-233.
Chapman, K.W., K.J. Boor. Acceptance of 2% Ultra-Pasteurized Milk be Consumers, 6-11 Years Old. J. Dairy Sci. 2001;84:951-954.
Chapman, K.W., H.T. Lawless, and K.J. Boor. Quantitative Descriptive Analysis and
Principle Component Analysis for Sensory Characterization of Ultrapasteurized Milk .J Dairy Sci. 2001;84:12-20.
Chung, S. Effects of Milk Type and Consumer Factors on the Acceptance of Milk Among Korean Female Consumers. J. Food Sci. 2009;74:S286-S295.
26
Croissant A.E., S.P. Washburn, L.L. Dean, and M.A. Drake. Chemical Properties and
Consumer Perception of Fluid Milk from Conventional and Pasture-Based Production Systems. J. Dairy Sci. 2007;90:4942-4953.
Coppa, M., B. Martin, P. Pradel, B. Leotta, A. Priolo, and V. Vasta. Effect of a Hay-Based Diet of Different Upland Grazing Systems on Milk Volatile Compounds. J Agric Food Chem. 2011;59:4947-4954.
Dairy Management Incorporate, DMI. Total U.S. Multi-Outlet + Conv. Retail Monthly Milk Snapshot. Calendar year 2014 Issue. 2014.
Devero, J.E. Effects of Varying Nonfat Solids and Fat on Consumer Acceptance of Milk Beverages. J Dairy Sci. 1973;56:286-291.
Dhar, T., and J.D. Foltz. Milk by Any Other Name… Consumer Benefits from Labeled Milk. Am. J. Agric. Econ. 2005;87:214-228.
Dhiman, T.R., G.R. Anand, L.D. Satter, and M.W. Pariza. Conjugated linoleic acid content of milk from cows fed different diets. J Dairy Sci. 1999;82:2146-2156.
FDA, U.S. Food and Drug Administration. Problems Digesting Dairy Products? 2015. Accessed on August 31, 2015.
http://www.fda.gov/forconsumers/consumerupdates/ucm094550.htm#look
FDA, U.S. Food and Drug Administration. Report on the Food and Drug Administration’s
Review of the Safety of Recombinant Bovine Somatotropin. 2009. Accessed on August 31, 2015.
27
Francis, L.L., D.H. Chambers, S.H. Kong, G.A. Milliken, I.J. Jeon, and K.A. Schmidt. Serving Temperature Effects on Milk Flavor, Milk Aftertaste, and Volatile Compound Quantification in Nonfat and Whole Milk. J Food Sci. 2006;70:S413 S418.
Food Marketing Institute. Natural and Organic Foods. 2004. Accessed on August 31, 2015. http://www.fda.gov/ohrms/dockets/dockets/06p0094/06p-0094-cp00001-05-Tab-04- Food-Marketing-Institute-vol1.pdf
Gandy, A.L., M.W. Schilling, P.C. Coggins, C.H. White, Y.Yoon, and V.V. Kamadia. The Effect of Pasteurization Temperature on Consumer Acceptability, Sensory
Characteristics, Volatile Compound Composition, and Shelf Life of Fluid Milk. J. Dairy Sci. 2008;91:1769-1777.
Goering, H.K., C.H. Gordan, T.R. Wrenn, J. Bitman, R.L. King, and F.W. Douglas Jr. Effect of Feeding Protected Safflower Oil on Yield, Composition, Flavor, and Oxidative Stability of Milk. J Dairy Sci. 1976;59:416-425.
Gould, B. W., T. L. Cox, and F. Perali. The Demand for Fluid milk Products in the U.S.: A Demand Systems Approach. Western J. Ag. Econ. 1990;15:1-12.
Greenbank, G.R. The Oxidized Flavor in Milk and Dairy Products: A Review. J Dairy Sci 1948;31:913-933.
Ha, Y.L., J. Storkson, and M.W. Pariza. Inhibition of benzo(a)-pyrene-Induced mouse forestomach neoplasia by conjugated dienoic derivatives of linoleic acid. Cancer Res. 1990;50:1097-1101.
28
Ip, C., J.A. Scimeca, and H. Thompson. Conjugated linoleic acid: A powerful anticarcinogen from animal fat sources. Cancer 1994;74:1050-1054.
Jahreis, G., J. Fritsche, and H. Steinhart. Conjugated linoleic acid in milk fat: High variation depending on production system. Nutr Res 1997;17:1479-1484.
Jansson, T., M.R. Clausen, U.K. Sundekilde, N. Eggers, S. Nyegaard, L.B. Larsen, C. Ray, Sundgren, H.J. Andersen, and H.C. Bertram. Janzen, J.J., and J.M. Rogers.
Preference and Acceptance of Solids-Enriched Milk in Homes. J Dairy Sci. 1967;50:1882-1885.
Jensen, K. Fluid Milk Purchase Patterns in the South: Effects of Use of Nutrition Information and Household Characteristics. J. Agr. Applied Econ. 1995;21:644-657.\
Jervis, S.M., P. Gerard, S. Drake, K. Lopetcharat, and M.A. Drake. The Perception of Creaminess in Sour Cream. J Sens Stud. 2014;29:248-257.
Jones, E.L., K.J. Shingfield, C. Kohen, A.K. Jones, B. Lupoli, A.S. Grandison, D.E. Beever, C.M. Williams, P.C. Calder, and P.Yaqoob. Chemical, Physical, and Sensory
Properties
of Dairy Products Enriched with Conjugated Linoleic Acid. J Dairy Sci. 2005;88:2923- 2937.
Joubert, P.R.J., and J. Poalses. What’s in a name? The Effect of a Brand Name on the Consumer’s Evalution of Fresh Milk. Int J Consum Stud. 2012;36:425-431.
29
Kelly, M.L., E.S. Kolver, D.E. Bauman, M.E. Van Amburgh, and L.D. Muller. Effect of intake of pasture on concentrations of conjugated linoleic acid in milk of lactating cows. J Dairy Sci. 1998;81:1630-1636.
Khanal, R.C., T.R. Dhlman, A.L. Ure, C.P. Brennand, R.L. Boman, and D.J. McMahon. Consumer Acceptability of Conjugated Linoleic Acid-Enriched Milk and Cheddar Cheese from Cows Grazing on Pasture. J Dairy Sci. 2005;88:1837-1847.
Kiesel, K., D. Buschena, and V. Smith. Do Voluntary Biotechnology Labels Matter to the Consumer? Evidence from the Fluid Milk Market. Am. J. Agric. Econ. 2005;87:378- 392.
Kiesel, K., and S.B. Villas-Boas. Got Organic Milk? Consumer Valuations of Milk Labels after the Implementation of the USDA Organic Seal. J. Agr. Food Ind. Org. 2007;5:1- 37.
Kim, S., and R.A. Douthitt. The Role of Dietary Information in Women’s Whole Milk and
Low Fat Milk Intakes. Int J Consum Stud. 2004;28:245-254.
Kim, M.K., K. Lopetcharat, and M.A. Drake. Influence of Packaging Information on Consumer Liking of Chocolate Milk. J. Dairy Sci. 2013;96:4843-4856.
Kinsella, J.E., S. Patton, and P.S. Dimick. The Flavor Potential of Milk Fat. A Review of Its Chemical Nature and Biochemical Origin. J. Am. Oil Chem. Soc. 1967;44:449-454. Krebs, A. L. 2013. Beyond the Gallon Jug: How Can Innovation Change the Path of Fluid
Milk? Dairy Management Inc. Accessed on June 8, 2014. http://www.cobank.com/Knowledge-
30
Lacerda, E.C.Q., L.C. Bauer, J.S. Oliveira, F.F. Silva, S.A. Carvalho, M.S. Macedo, N.E. de Souza, and J.I. Simionato. Effect of the dietary inclusion of dried oregano (Origanum vulgare L.) on the characteristics of milk from Holstein x Zebu cows. Anim. Feed Sci. Technol. 2014;192:101-105.
Lara-Zamudio, Y., S. Villalpando, T. Shamah-Levy, V. Mundo-Rosas, A. Contreras-
Manzano, and H. Lamadrid-Figueroa. Defatted Milk is Preferred by Mexican School- age Children over Whole Milk in a Sensorial Study. Ann Nutr Metab. 2013;62:214- 222.
Larsen, M.K., U. Kidmose, T. Kristensen, P. Beaumont, and G. Mortensen. Chemical
Composition and Sensory Quality of Bovine Milk as Affected by Type of Forage and Proportion of Concentrate in the Feed Ration. J Sci Food Agric. 2013;93:93-99. Mann, G.R., S.E. Duncan, K.F. Knowlton, A.D. Dietrich, and S.F. O’Keefe. Effects of
Mineral Content of Bovine Drinking Water: Does Iron Content Affect Milk Quality? J Dairy Sci. 2013;96:7478-7489.
Mestdagh. F., B.D. Meulenaer, J.D. Clippeleer, F. Devlieghere, and A. Huyghebaert. Protective Influence of Several Packaging Materials on Light Oxidation of Milk. J Dairy Sci. 2005;88:499-510.
Modler, H.W., D.B. Emmons, F.C. Commins, L. Hurd, and K.S. Cowley. Consumer Evaluation of Two-Percent Milk Containing Added Feed-Flavor. J Dairy Sci. 1977;60:1355-1362.
31
Moyssiadi, T., A. Badeka, E. Kondyli, T. Vakirtzi, I. Savvaidis, and M.G. Kontominas. Effect of Light Transmittance and oxygen Permeability of Various Packaging Materials on Keeping Quality of Low Fat Pasteurized Milk: Chemical and Sensorial Aspects. Int. Dairy J. 2004;14:429-436.
Nevens, W.B., M.B. Alleman, and L.T. Peck. The Effect of Fat in the Ration Upon The Percentage Fat Content of the Milk. J Dairy Sci. 1926;9:307-345.
Oupadissakoon, G., D.H. Chambers, and E. Chambers IV. Comparison of the Sensory Properties of Ultra-High-Temperature (UHT) Milk from Different Countries. J Sens Stud. 2009;24:427-440.
Palacios, O.M., J. Badran, M.A. Drake, M. Reisner, and H.R. Moskowitz. Consumer Acceptance of Cow’s Milk Verses Soy Beverages: Impact of Ethnicity, Lactose
Intolerance, and Sensory Preference Segmentation. J Sens Stud. 2009;24:731-748. Palacios, O.M., J. Badran, L. Spence, M.A. Drake, M. Reisner, and H.R. Moskowitz.
Measuring Acceptance of Milk and Milk Substitutes Among Younger and Older Children. J Food Sci. 2010;75:S522-S526.
Palmquist, D.L., A.D. Beaulieu, and D.M. Barbano. Feed and Animal Factors Influencing Milk Fat Composition. J. Dairy Sci. 1993;76:1753-1771.
Pangborn, R.M. and W.L. Dunkley. Sensory Discrimination of Fat and Solids-not-fat in Milk. J. Dairy Sci. 1964;47:719-726.
32
Petty, M.F., and F.M. Scriven. The Use of Fourier Analysis to Compare the Sensory Profiles of Products. J Sens Stud. 1991;6:17-23.
Phillips, L.G., M.L. McGiff, D.M. Barbano, and H.T. Lawless. The Influence of Fat on the Sensory Properties, Viscosity, and Color, of Lowfat Milk. J Dairy Sci. 1995;78:1258- 1266.
Porubcan, A.R., and Z.M. Vickers. Characterizing Milk Aftertaste: The Effects of Salvation Rate, PROP Taster Status, or Small Changes in Acidity, Fat, or Sucrose on
Acceptability
of Milk to Milk Dislikers. Food Qual. Prefer. 2005;16:608-620.
Raats, M.M., R. Shepherd. Free-Choice Profiling of Milks and Other Products Prepared with Milks of Different Fat Contents. J Sens Stud. 1992;7:179-203.
Ramaswamy, N., R.J. Baer, D.J. Schingoethe, A.R. Hippen, K.M. Kasperson, and L.A. Whitlock. Short Communication: Consumer Evaluation of Milk High in Conjugated Linoleic Acid. J Dairy Sci. 2001;84:1604-1609.
Richardson-Harman, N.J., R. Stevens, S. Walker, J. Gamble, M. Miller, and A McPherson. Mapping Consumer Perceptions of Creaminess and Liking for Liquid Dairy Products. Food Qual Prefer. 2000;11:239-246.
Robb, C.A., L.M. Reynolds, and M. Abdel-Ghany. Consumer Preference Among Fluid Milks: Low-Fat vs. High-Fat Milk Consumption in the United States. Int J Consum Stud. 2007;3:90-94.
Shipe, W.F., R. Bassette, D.D. Deane, W.L. Dunkley, E.G. Hammond, W.J. Harper, D.H. Kleyn, M.E. Morgan, J.H. Nelson, and R.A. Scanlan. Off Flavors of Milk:
33
Simon, M., and A.P. Hansen. Effect of Various Dairy Packaging Materials on Shelf Life and Flavor of Ultrapastuerized Milk. J. Dairy Sci. 2001;84:784-791.
Stewart, H., D. Dong, and A. Carlson. Is Generational Change Contributing to the Decline in Fluid Milk Consumption? J. Ag. Resource Econ. 2012;37:435-454.
Stewart, H., D. Dong, and A. Carlson. 2013. Why are Americans Consuming Less Fluid Milk? A Look at Generational Differences in Intake Frequency. Economic Research Service. Economic Research Report Number 149:1-29.
Tamsma, A., F.E. Kurtz, R.S.Bright, and M.J. Pallansch. Contribution of Milk Fat to the Flavor of Milk. J Dairy Sci. 1969;52:1910-1913.
Tepper, B.J. and T. Kuang. Perception of Fat in a Milk Model System Using Multidimensional Scaling. J Sens Stud. 1996;11:175-190.
Timmen, H., and S. Patton. Milk fat globules: Fatty acid composition, size, and in vivo regulation of fat liquidity. Lipids 1988;23:685-689.
Tuorila, H., and R.M. Pangborn. Prediction of reported consumption of selected fat- containing food. Appetite 1988;11:81-85.
University of Georgia, UGA. Lactose Intolerance. 2015. Accessed on October 6, 2015. https://www.uhs.uga.edu/nutrition/lactoseintolerance.html
Urbach. G. Effect of Feed on Flavor in Dairy Foods. J. Dairy Sci. 1990;73:3639-3650. USDA APHIS. Determining U.S. Milk Quality Using Bulk-tank Somatic Cell Counts. 2011.
Accessed on August 29, 2015.
34
U.S. Food and Drug Administration. M-I-92-13: Recommended Levels of Vitamins A & D in Milk Products. 1992. Accessed on October 4, 2015.
http://www.fda.gov/Food/GuidanceRegulation/GuidanceDocumentsRegulatoryInfor
mation/Milk/ucm082152.htm.
U.S. Food and Drug Administration. CFR- Code of Federal Regulations Title 21 101.62. 2015. Accessed on August 30, 2015.
https://www.accessdata.fda.gov/scripts/cdrh/cfdocs/cfcfr/CFRSearch.cfm?fr=101.62 U.S. Food and Drug Administration. CFR- Code of Federal Regulations Title 21 131.110.
2015. Accessed on August 30, 2015.
http://www.accessdata.fda.gov/scripts/cdrh/cfdocs/cfcfr/CFRSearch.cfm?CFRPart=13 1showFR=1
U.S. Food and Drug Administration. Grade “A” Pasteurized Milk Ordinance. 2009. Accessed on August 28, 2015.
http://www.fda.gov/downloads/Food/GuidanceRegulation/UCM209789.pdf
U.S. Food and Drug Administration. National Organic Program- Organic Milk Operations, Audit Report. 2013. Accessed on September 8, 2015.
http://www.usda.gov/oig/webdocs/01601-0002-32.pdf
Varnam, A.H., and J.P. Sutherland. Milk and Milk Products, Technology, Chemistry, and Microbiology. Chapman & Hall. London, UK. 1994. Pgs76-85.
35
Villeneuve, M.P., Y. Lebeuf, R. Gervais, G.F. Tremblay, J.C. Vuillemard, J. Fortin, and P.Y. Chouinard. Milk Volatile Organic Compounds and Fatty Acid Profile in Cows Fed Timothy Hay, Pasture, or Silage. J Dairy Sci. 2013;96:7181-7194.
Wahid-Ul-Hamid, S.S., and L.J. Manus. Effect of Changing the Fat and Nonfat Solids of Milk. J Dairy Sci. 1960;43:1430-1434.
Walsh, A.M., S.E. Duncan, H. Potts, and D.L. Gallagher. Comparing quality and emotional responses as related to acceptability of light-induced oxidation flavor in milks. Food Res Inter. 2015;76:293-300.
Walstra, P., J.T.M. Wouters, and T.J. Geurts. Dairy Science and Technology, Second Edition. Taylor and Francis Group. Boca Raton, FL. 2006 p.17- 166.
White, C.H. Consumer Reaction to Colored Plastic Milk Jugs. J Dairy Sci. 1985;68:261-264. White, S.L., J.A. Bertrand, M.R. Wade, S.P. Washburn, J.T. Green Jr., and T.C. Jenkins.
Comparison of Fatty Acid Content of Milk from Jersey and Holstein Cows Consuming Pasture or a Total Mixed Ration. J. Dairy Sci. 2001;84:2295-2301. Whited, L.J., B.H. Hammond, K.W. Chapman, and K.J. Boor. Vitamin A Degradation and
Light-Oxidized Flavor Defects in Milk. J Dairy Sci. 2002;85:351-354.
Woodward, T.E. Factors Influencing Percentage of Fat in Milk. J Dairy Sci. 1923;5:466-478. Yayota, M., M. Tsukamoto, Y. Yamada, and S. Ohtani. Milk Composition and Flavor Under
36
37
MILKFAT THRESHOLD DETERMINATION AND THE EFFECT OF MILKFAT CONTENT ON CONSUMER PREFERENCE OF FLUID MILK
K.S. McCarthy*, K. Lopetcharat†, and M.A. Drake1
*
Department of Food, Bioprocessing & Nutrition Sciences, Southeast Dairy Foods Research Center, North Carolina State University, Raleigh 27695
†
Nouveau Centric Co. Ltd. Bangkok 10250 Thailand
1
Corresponding Author: MaryAnne Drake
Box 7624, Department of Food Science
North Carolina State University Raleigh, NC 27695-7624 Phone: 919-513-4598
Fax: 919-513-0014
E-mail: [email protected]
38
INTERPRETIVE SUMMARY
39
ABSTRACT
Milk consumption has been in decline since the 1960’s. Milkfat plays a critical role in
sensory properties of fluid milk. The firstobjective of this study was to determine the change in milkfat needed to produce a detectable or just noticeable difference (JND) to consumers in skim, 1%, 2%, and whole milks. The second objective was to evaluate how milkfat affected consumer preferences for fluid milk. Threshold tests were conducted to determine the JND for each reference milk (skim, 1%, 2%, and whole milk) with a minimum of 60 consumers for each JND. The JND was determined for milks by visual appearance without tasting and tasting without visual cues. Serving temperature effect of 4, 8, or 15◦C on tasting JND values were also investigated. The established JND values were then used to conduct 2-AFC
preference tests with milks. Consumers were assigned to three groups based on self-reported milk consumption, skim milk drinkers (n=59), low-fat milk drinkers (consumed 1% or 2% milk) (n=64), and whole milk drinkers (n=49). Follow-up interviews were conducted where consumers were asked to taste and explain their preference between milks that showed the most polarization within each consumer segment. Descriptive sensory analysis was
performed on the milks used in the follow-up interviews to quantify sensory differences. Visual-only JNDs were lower than tasting-only JND values (P < 0.05). Preference testing revealed three distinct preference curves among the consumer segments. Skim milk drinkers preferred skim milk and up to 2% milkfat but disliked milk higher in fat due to it being “too thick,” “too heavy,” “flavor and texture like cream,” “too fatty,” and “looks like half and half.” Low-fat milk drinkers preferred 2% milk up to 3.25% (whole milk) but then disliked
40
The findings of this study provide insight on how the industry might adjust milkfat to increase milk preference and remain within the standards of identity of milk.
41
INTRODUCTION
Fluid milk has seen a steady decline in sales over the last several decades while other dairy products such as yogurt and cheese have increased in per capita consumption in the United States. From 1975 to 1995 to 2014, milk consumption decreased from 29.6 to 24.6 to 19.0 gallons per person (United States Department of Agriculture, 2015).While total
consumption has declined, there have also been changes in the type of milk most commonly purchased. In the 21 years spanning 1966 and 1987, low-fat milk increased in sales by 30.0% while whole milk sales decreased by 44.8% (Gould et al., 1990). Sales of 2% reduced fat milk alone have outsold whole milk every month since January 2005 while skim milk sales have remained relatively stable (Agriculture Marketing Service, 2014).
42
(Phillips et al., 1995). Another study evaluated appearance and its relationship to perceived thickness. Quinones et al. (1997) studied the influence of increased protein concentration on viscosity, color, and other sensory properties in skim and 1% milk. A high correlation was found between instrumental whiteness and trained panel thickness of milk. Instrumental whiteness increased with increased protein content concurrent with sensory thickness but that pattern was not observed with instrumental relative viscosity of the samples.
Milkfat is also associated with the desirable consumer attribute of creaminess. Richardson-Harman et al. (2000) showed that creaminess was defined by high fat dairy products that exhibited dairy flavors such as cream aroma, butter aroma, vanilla flavor and texture characteristics of mouth coating, slipperiness, and higher viscosity. Creaminess was positively related to product liking. Tepper and Kuang (1996) evaluated the perception of fat content in skim milk using a select group of milk consumers. Results showed powdered natural cream flavor and not the addition of vegetable oil provided the sensation of higher fat content in skim milk. Jervis et al. (2014) evaluated the effect of different modalities on perceived creaminess and how creaminess affected overall liking in sour cream. In full fat sour cream, flavor played the biggest role when assessing creaminess. As fat was removed, other modalities of visual appearance, physical stirring, and in-mouth texture played a more important role in fat perception. They also reported that samples which scored high in overall liking also were rated highly in creaminess. These studies collectively demonstrate that both appearance and flavor contribute to creamy perception in dairy products and that creaminess is a desired attribute in dairy products.
43
stimulus to elicit a detectable difference (Allen, 1981). Drake et al. (2012) determined JND values for sodium chloride in dairy products. The authors proposed that this information could be used to reduce NaCl without consumers detecting differences. Previous work has established that milkfat content of fluid milk is a critical sensory parameter for appearance, flavor, and mouthfeel but the role of specific concentrations of milkfat has not been
determined. The objectives of this study were to determine the change in milkfat needed to produce a detectable difference or just noticeable difference (JND) to consumers in skim, 1%, 2%, and whole milks. The second objective was to evaluate how milkfat affected preferences for fluid milk. With this knowledge we hope that the industry will be able to optimize fluid milk within each category to a more preferred product that still falls within the standard of identity of milk under USDA regulations and or strategically position milk and identify areas for milk beverage innovation.
MATERIALS AND METHODS
Sample Preparation
Raw milk was obtained from the North Carolina State University Dairy Enterprise System. A cold bowl separator was used to skim the milkfat and the raw milk was then standardized to 0.1%, 3.25% or 42.0% milkfat. After the fat content of milk was
44
(AOAC International, 1992: method number 989.05). Milk was transported and stored with black plastic coverings and was mixed and prepared for sensory testing with overhead lights off to prevent light oxidation.
Threshold Tests
45
For tasting without visual cues, the JND for each reference milkfat was evaluated by a 5-series, ascending forced choice (3-AFC) threshold test. Step factors for each threshold test were determined by preliminary tests to select a range within which most consumers would detect differences. A step factor of 2.2 was used for skim milk, a step factor of 1.7 was used for 1% milk, a step factor of 1.5 was used for 2%, and a step factor of 1.4 was used for whole milk. In testing without visual cues, panelist tasted the milks under red lights and the milk was served in 177 mL, white Styrofoam cups to minimize visible differences in the milks. The reference milk was served in two of the white Styrofoam cups and the third white Styrofoam cup contained the test sample of the milk with an increased milkfat concentration. Each cup contained 59 mL of the designated sample and was labeled with a random 3-digit code. Milks were served at 4C except for the tests that evaluated serving temperature effects. For each series, consumers were presented with all 3 samples. They were asked to taste the milks in the order presented on the ballot and to select the one they thought was different. Cups within each series were presented in a randomized balanced order presentation across all panelists. A 3-minute wait was imposed between each series to prevent carryover effects. The session was limited to a 5-series to prevent fatigue.
When consumers were to only visually evaluate the milks, samples (59mL) were served in 177 mL clear plastic tumblers with random 3-digit codes under normal indoor lighting conditions. Since consumers did not taste samples, an 8-series 3-AFC was used with all other aspects of preparation and data collection remaining the same as the tasting
46
step factor of 1.5 was used for skim milk, and a step factor of 1.3 was used for 1%, 2%, and whole milk.
Preference Testing
The calculated JND values from the threshold tests for skim, 1%, and 2% milk were used to conduct preference testing to determine how the just noticeable fat difference affected consumer preferences for milks. The whole milk JND values were not used as they far exceeded any milk that would be commercially available. The milks evaluated included skim milk (0.1% milkfat), 1%, 2%, whole milk (3.25% milkfat), 4.5% (skim tasting JND), 6.1% (1% tasting-only JND), and 6.6% (2% tasting-only JND). The tasting-only JNDs were used as these covered both the visual JND and the tasting JND of each reference milk. Milks were prepared in the same manner as for the threshold tests and served (59mL) in 177 mL clear plastic tumblers with random 3-digit codes. Preference tests with all senses engaged were investigated with self-reported consumer groups of skim milk drinkers (n=59), low-fat milk drinkers (defined as those who drank 1% or 2% milk) (n=64), and whole milk drinkers (n=49). Consumers were again recruited from the online database maintained by the Sensory Service Center (Raleigh, NC). Consumers tasted all possible combinations of the 7 milks (21 pairs total) (Table 1) of the reference and test milks served at 4°C (a forced choice
47
Preference Follow-up Interviews
A subset (minimum of n=10 from each group) of the consumers who completed the preference testing were asked to participate in follow-up interviews. Milks were prepared in the same manner as for the JND and preference testing. Skim milk consumers were presented with 3 pairs of milk separately and asked to identify which sample of the pair they preferred and then were asked to explain why. The 3 pairs that were given were skim versus 2% milk, 2% milk versus whole milk, and skim versus milk standardized to 6.6% milkfat. Low-fat milk drinkers were presented with 3 pairs as well, skim versus 2% milk, 2% versus whole milk, and 2% versus 6.6% milkfat milk. Whole milk drinkers were presented with 2 pairs, skim versus whole milk and whole milk versus 6.6% milkfat milk. These pairs were chosen for each consumer segment based on the preference test results and the most polarization within each group. Each interview lasted approximately 30 minutes. Panelists who completed the interview were compensated with a gift card.
Descriptive Analysis
Descriptive analysis was conducted on the same milks used in the follow-up
interviews, a subset from the preference test, to document the analytical sensory properties of each milk. The descriptive panel was comprised of eight trained panelists (ages 22-45 y) and were all employed by North Carolina State University. Each panelist had a minimum of 65 hours of prior descriptive analysis training on food flavor and mouthfeel/texture attributes using the Spectrum™ method (Meilgaard et al., 2007), and at least 20 hours of prior experience with the evaluation of sensory properties of fluid milk and milk powders
48
shaken and 85 mL was dispensed into coded 118 mL plastic soufflé cups with lids. Sample preparation was conducted with overhead lights off to avoid any light oxidation of the samples. At the beginning of each evaluation session, panelists were calibrated with 3 commercial warm up samples of half and half, whole milk, and skim milk that panelists had previously characterized. Panelists expectorated samples and between samples, panelists rinsed with deionized water and cleansed their palate with unsalted crackers. A 3-minute wait time between samples was enforced. The order of presentation of samples was randomized to account for presentation and carryover effects.
Opacity, color, and viscosity were evaluated in separate sessions from flavor to prevent interactions. For the evaluation of opacity, references of water and whole fat milk were provided to panelists. All samples were served in black 118 mL plastic soufflé cups with lids and random 3-digit codes. Color was evaluated by dispensing approximately 80 mL of each sample into 100 mm x 10 mm disposable, plastic petri dishes (Thermo Scientific, Waltham, MA, USA). The petri dishes were placed on a white paper background and Behr paint chips (‘ultra pure white’ PPU18-06=0.0 and ‘glass of milk’ P260-1u=3.5) were used as
references for yellow color. Each milk was evaluated in separate sessions in triplicate by each panelist using an adapted sensory lexicon from Croissant et al. (2007) (Table 2).
Statistical Analysis
49
constructed for the 2-AFC tests (ASTM, 1973). Preference curves were then plotted based on the proximity matrix for each consumer group. Qualitative data from the interviews were tallied for the most common answers among each group. Descriptive analysis data was analyzed by ANOVA with means separation.
RESULTS AND DISCUSSION
Threshold Tests
50
descriptive panel found no difference in flavor of nonfat or whole milk when served at 4°C or 15°C or in cheese flavors at 5°C, 12°C, or 21°C (Drake et al., 2005).
Preference Testing
A total of 172 self-reported milk consumers participated in the milk paired preference tests, 30.2% males and 69.8% females, 19-35y, and mostly Caucasian (65.3%). Overall, when consumers were given skim milk in a pair, the higher milkfat sample was always preferred (P < 0.05). Two-percent milk was preferred over whole milk but when given the option of 1% compared to 4.5% milkfat milk, 4.5% was preferred (P < 0.05). Consumers reverted back to preferences for a lower fat sample, 2% milk, when presented with the 6.6% milk (P < 0.05) (Figure 1).
More differences in milkfat preference were noted when results were separated by typical milkfat content consumed. When skim milk drinkers were presented with skim milk versus 1% milk, they preferred 1% (P < 0.05). They also preferred 2% over skim milk (P < 0.05). When given 1% or 2% versus whole milk, the reduced fat milks were preferred. Skim, 1%, and 2% were always preferred when presented with a test sample above 4.5% milkfat (P < 0.05) (Figure 2). Overall skim milk drinkers preferred 1% and 2% more than skim milk and whole milk. However, when fat content increased to 4.5% and above, they chose skim, 1%, and 2% (P < 0.05) (Figure 2). Low-fat milk drinkers preferred 1%, 2%, and whole milk over skim milk (P < 0.05) (Figure 3). When given 1% versus whole milk, whole milk was