ABSTRACT
TYNER, BRYCE PAUL. African Easterly Waves: Evolution in Potential Vorticity Fields and Interactions with Upper-level Troughs. (Under the direction of Dr. Anantha R. Aiyyer.)
In the first part of our study, we examine the evolution of African Easterly Waves (AEWs) leading to (TCs) in the Atlantic during 2000-2008 from isentropic potential vorticity (PV) and Lagrangian streamline perspectives. TC formation is commonly preceded by axisymmetrization of PV, scale contraction of the wave, and formation of closed circulation within the wave. In these cases, PV associated with the synoptic scale wave is irreversibly deformed and subsumed within the developing vortex. Less commonly, filamention of the PV leads to separation and independent propagation of the wave and the TC vortex. In an example presented here, the remnant wave with a closed circulation persisted for several days after separation from the TC. A second TC did not result, suggesting existence of a midtropospheric closed gyre is not sufficient for TC genesis. Cases of prolonged co-existence of wave and TC are rarely observed. In these weak cases, an AEW and a weak TC continue remain coupled for a few days, followed by the dissipation of the TC and continued propagation of the wave, suggesting an elasticity in AEW evolution. The ITCZ breakdown pathway to TC genesis is frequently observed in the isentropic PV view of AEW evolution. Also of common occurrence is merging of tropical and extratropical PV anomalies, which appears to help maintain some waves. The results of our this are broadly consistent with recent Lagrangian analyses of AEW evolution during TC genesis, with a few differences. The time series analysis in this study suggests the formation of a meso-α proto-vortex occurs nearly simultaneously rather than prior to the formation of active convection.
c
Copyright 2011 by Bryce Paul Tyner
African Easterly Waves: Evolution in Potential Vorticity Fields and Interactions with Upper-level Troughs
by
Bryce Paul Tyner
A thesis submitted to the Graduate Faculty of North Carolina State University
in partial fulfillment of the requirements for the Degree of
Master of Science
Atmospheric Sciences
Raleigh, North Carolina
2011
APPROVED BY:
Dr. Gary M. Lackmann Dr. Walter A. Robinson
DEDICATION
BIOGRAPHY
I was born and raised in Virginia Beach, VA, and I have always had an appreciation for hurri-canes. In my years growing up, I recall the fury of storms such as Bertha (1996), Fran (1996), Bonnie (1998), and Isabel (2003). After graduating from the International Baccalaureate Pro-gram at Princess Anne High School in June of 2004, I began attending NC State University the following fall. I graduated with a double BS in Meteorology and Marine Science as a vale-dictorian in May of 2008. I then began my MS in August of the same year.
ACKNOWLEDGEMENTS
TABLE OF CONTENTS
List of Tables . . . vi
List of Figures . . . vii
Chapter 1 Evolution of African Easterly Waves in Potential Vorticity Fields . 1 1.1 Introduction . . . 1
1.2 Data . . . 3
1.3 Results . . . 5
1.3.1 Subjective classification of wave evolution . . . 5
1.3.2 Illustrative Examples . . . 6
1.4 Discussion and Conclusions . . . 13
Chapter 2 Interaction of African Easterly Waves and Upper-level Troughs . . 36
2.1 Introduction . . . 36
2.1.1 Objectives . . . 39
2.2 Data . . . 40
2.2.1 Interaction Definition . . . 40
2.2.2 Potential Vorticity . . . 40
2.2.3 Tangential Velocity Flux Convergence . . . 40
2.2.4 Reilly Emanuel Parameter . . . 41
2.2.5 Algorithm Results . . . 41
2.3 Case Studies . . . 42
2.3.1 Tammy (2005) . . . 42
2.3.2 Case Study: Null 2 (2005) . . . 45
2.4 Discussion and Conclusions . . . 47
Chapter 3 Summary . . . 59
Appendix . . . 62
Appendix A Appendix A: Wave Tracking Algorithm . . . 63
LIST OF TABLES
Table 1.1 Analyzed type A, B, and C storms. Asterisks indicate storms that devel-oped from a quasi-linear PV strip. . . 16
LIST OF FIGURES
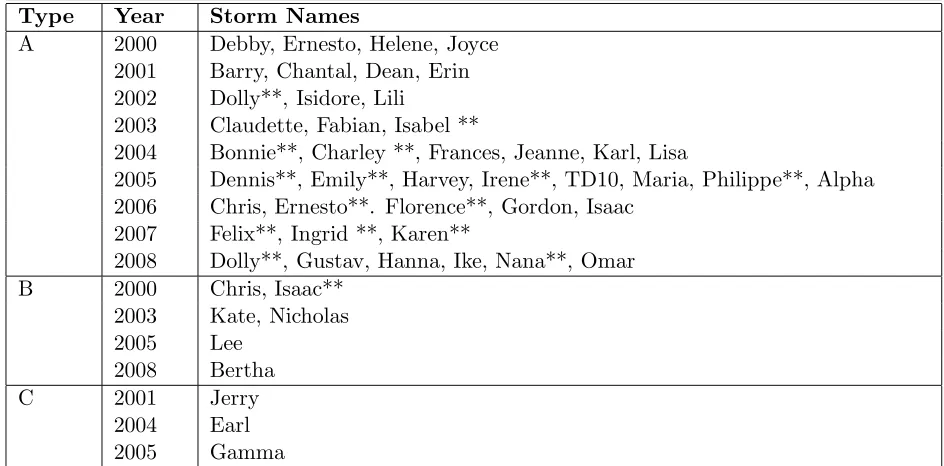
Figure 1.1 Idealized schematic illustrating the (a) Type A, (b) Type B, and (c) Type C wave fates after TC genesis. Wave-following streamlines are overlayed on 315 K potential vorticity (shaded), and the direction of propagation is given by the arrows. Time increases from right to left, and the second plot from the left in each panel represents the idealized system at the time of TC genesis. . . 17 Figure 1.2 Hovmoller diagram of 315 K potential vorticity (10 PVU, shaded) and
TRMM precipitation (mm/hr, contours) averaged over 6◦-latitude range
following the pre-Dolly AEW. Time and location of TC genesis is indi-cated by an ‘X’ in the figure. . . 18 Figure 1.3 315 K potential vorticity (10 PVU, shaded) and 600 hPa streamfunction
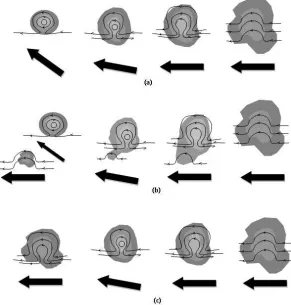
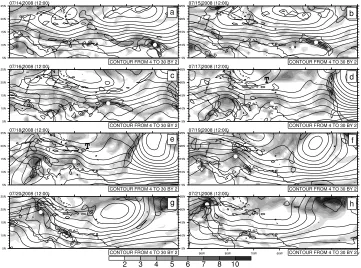
(contours) showing the evolution of the AEW leading to tropical storm Dolly in 2008. Each panel is 24 hours apart, starting at 1200 UTC 14 July 2008. The white filled circle marks the position of the AEW, and the mid-latitude PV merger is designated by a ‘T’. . . 19 Figure 1.4 310-320 K layer averaged potential vorticity (10 PVU, shaded), 600 hPa
streamlines (thin contours), and TRMM precipitation (mmhr−1
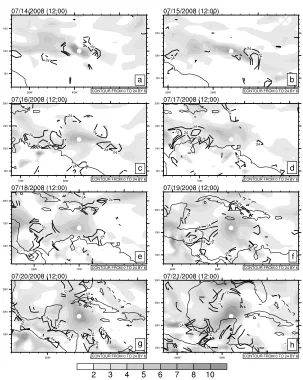
, dark contours) in wave-following frame. Each panel is 24 hours apart, starting at 1200 UTC 14 July 2008. The white filled circle marks the position of the AEW. . . 20 Figure 1.5 310-320 K layer averaged potential vorticity (shaded), and filamentation
time (contours; interval 6 h; only values less than or equal to 24 h shown). Each panel is 24 hours apart, starting at 1200 UTC 14 July 2008. The white filled circle marks the position of the AEW. . . 21 Figure 1.6 Time series of 315 K potential vorticity (10 PVU, thick black line),
TRMM rainfall (inday−1
, dashed black line), both averaged within a 3◦
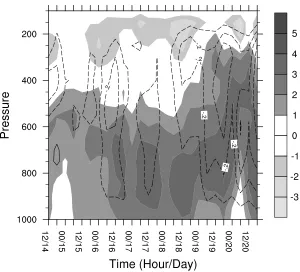
box following the pre-Dolly wave, and a measure of axisymmetry of the gyre within the wave (thick gray line). Dashed vertical lines mark signif-icant events during the evolution of the wave. . . 22 Figure 1.7 Vertical structure of relative vorticity (s−1
, shaded) and vertical velocity (ms−1
, contours) averaged within a 3◦ box following the pre-Dolly AEW. 23
Figure 1.8 Hovmoller diagram of 315 K potential vorticity (10 PVU, shaded) and TRMM precipitation (mmhr−1
, contours) averaged over 6◦-latitude range
following the pre-Bertha AEW. Time and location of TC genesis is indi-cated by an ‘X’ in the figure. . . 24 Figure 1.9 315 K potential vorticity (10 PVU, shaded) and 600 hPa streamfunction
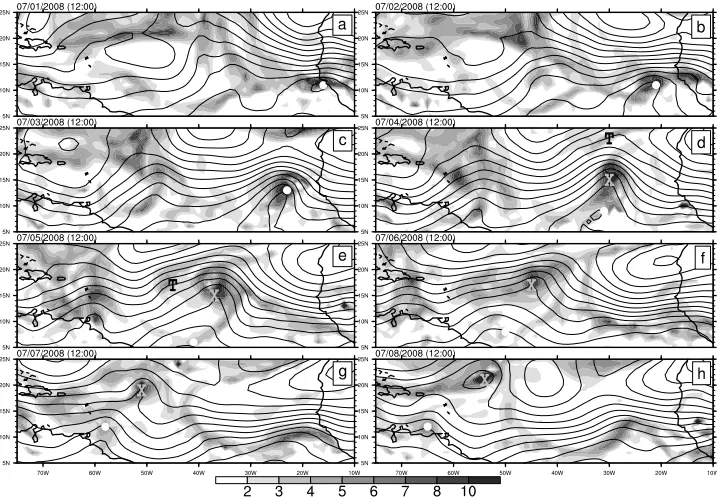
Figure 1.10 310-320 K layer averaged potential vorticity (10 PVU, shaded), 600 hPa streamlines (thin contours), and TRMM precipitation (mmhr−1
, dark contours) in wave-following frame. Each panel is 24 hours apart, starting at 1200 UTC 1 July 2008. The white filled circle marks the position of the AEW. . . 26 Figure 1.11 310-320 K layer averaged potential vorticity (10 PVU, shaded), and
fil-amentation time (contours; interval 6 h; only values less than or equal to 24 h shown). Each panel is 24 hours apart, starting at 1200 UTC 1 July 2008. The white filled circle marks the position of the AEW. . . 27 Figure 1.12 Time series of 315 K potential vorticity (10 PVU, thick black line),
TRMM rainfall (inday−1
, dashed black line), both averaged within a 3◦
box following the pre-Bertha wave, and a measure of axisymmetry of the gyre within the wave (thick gray line). Dashed vertical lines mark significant events during the evolution of the wave. . . 28 Figure 1.13 Vertical structure of relative vorticity (s−1
, shaded) and vertical velocity (ms−1
, contours) averaged within a 3◦ box following the pre-Bertha AEW. 29
Figure 1.14 Hovmoller diagram of 315 K potential vorticity (10 PVU, shaded) and TRMM precipitation (mmhr−1
, contours) averaged over 6◦-latitude range
following the pre-Earl AEW. Time and location of TC genesis is indicated by an ‘X’ in the figure. . . 30 Figure 1.15 315 K potential vorticity (shaded) and 600 hPa streamfunction
(con-tours) showing the evolution of the AEW leading to tropical storm Earl in 2004. Each panel is 24 hours apart, starting at 1200 UTC 12 August 2004. The white filled circle marks the position of the AEW. . . 31 Figure 1.16 310-320 K layer averaged potential vorticity (10 PVU, shaded), 600 hPa
streamlines (thin contours), and TRMM precipitation (mmhr−1
, dark contours) in wave-following frame. Each panel is 24 hours apart, starting at 1200 UTC 12 August 2004. The white filled circle marks the position of the AEW. . . 32 Figure 1.17 310-320 K layer averaged potential vorticity (10 PVU, shaded), and
fil-amentation time (contours; interval 6 h; only values less than or equal to 24 h shown). Each panel is 24 hours apart, starting at 1200 UTC 12 August 2004. The white filled circle marks the position of the AEW. . . . 33 Figure 1.18 Time series of 315 K potential vorticity (10 PVU, thick black line),
TRMM rainfall (inday−1
, dashed black line), both averaged within a 3◦
box following the pre-Earl wave, and a measure of axisymmetry of the gyre within the wave (thick gray line). Dashed vertical lines mark signif-icant events during the evolution of the wave. . . 34 Figure 1.19 Vertical structure of relative vorticity (s−1
, shaded) and vertical velocity (ms−1
, contours) averaged within a 3◦ box following the pre-Earl wave. . 35
Figure 2.2 200 hPa tangential velocity flux convergence for various times in the evo-lution for Tammy (2005). Radii are scaled 10−2
km. TVFC is displayed in units of ms−1
day−1
. . . 50 Figure 2.3 Average relative humidity for various times surrounding Tammy (2005).
The solid line depicts the relative humidity at the 600 hPa level and the dashed line at the 850 hPa level. . . 51 Figure 2.4 Average 200-850 hPa vertical shear for various times surrounding Tammy
(2005). . . 52 Figure 2.5 Average Reilly-Emanuel (ER) Parameter surrounding Tammy (2005).
Averages are shown for distances from storm center 3 km in blue, 5 km in red, and 7 km in green. . . 53 Figure 2.6 600 hPa (blue shaded) and 250 hPa (red shaded) PV at (a) 00z 11th
September, (b) 00z 12 September, (c) 00z 13 September, (d) 00z 14 September, (e) 18z 14 September, and (f) 00z 15 September. Units are in PVU. The system of interest is outlined with a blue circle. . . 54 Figure 2.7 Average relative humidity for various times surrounding Null 2 (2005).
The solid line depicts the relative humidity at the 600 hPa level and the dashed line at the 850 hPa level. . . 55 Figure 2.8 Average 200-850 hPa vertical shear for various times surrounding Null
2 (2005). . . 56
Chapter 1
Evolution of African Easterly Waves
in Potential Vorticity Fields
1.1
Introduction
the process of TC genesis (e.g. Sobel and Bretherton, 1999; Kuo et al., 2001; Li et al., 2003). The intertropical convergence zone (ITCZ) breakdown pathway is another route to closed circulations, developing from amplifying waves in an unstable environment. Guinn and Schubert (1993) and Ferreira and Schubert (1997) used a shallow water barotropic model to examine ITCZ breakdown in the eastern Pacific. In their simulations, an initially zonal strip of cyclonic PV anomaly is unstable to perturbations that amplify via barotropic instability and irreversibly deform the PV strip into a series of eddies. While Ferreira and Schubert (1997) were describing eastern Pacific storms, the authors recognized the applicability of ITCZ breakdown to the Atlantic.
An additional path to formation of a closed circulation within neutral waves has been suggested by Dunkerton et al. (2009; henceforth refered as DMW09). In their Lagrangian framework, TC genesis is preceded by the formation of a closed gyre within a critical layer. This critical layer forms when the wave enters a region where its propagation speed matches the environmental flow. The authors suggest the formation of the closed gyre helps buffer the air within the wave from the intrusion of dry air and preconditions the region for deep convection. According to the authors, the gyre-pouch formation is most applicable to neutrally propagating waves that have left their initiation region of the unstable African easterly jet (AEJ). However, the authors do suggest that disturbances forming from ITCZ breakdown may also support this so-called marsupial paradigm and formation of a closed gyre in a critical layer.
Observations often show that the AEW wavepacket does not entirely transform into a vortex. Often, sharpening of the trough leads to its breakdown similar to mid-latitude cut-off cyclones, an analogy that has also been noted by Lindzen (1974) and DMW09. Once cut-off, the propagation paths of the tropical cyclone and the residual waves are usually different. The AEW continues to follow the waveguide set by the background PV gradient, while the TC path is determined by the environmental steering current. After separation, most of the waves are observed to decay eventually. However, National Hurricane Center (NHC) storm reports occasionally indicate that a wave can continue on and possibly even lead to the formation of another TC. For example, the storm reports for Franklin and Gert in 2005 suggest that the same wave was the precursor to both storms. Occasionally, the storm reports also designate a decayed tropical storm as an open wave. The potential to survive the TC formation process and the apparent elasticity in reverting back to a wave state are intriguing flavors of AEW evolution that need to be better documented in order to improve our understanding of the role of the wave in TC genesis.
waves. Isentropic PV is conserved for adiabatic and frictionless flow, and thereby serves as a good tracer of synoptic scale disturbances. Routine examination shows that despite localized non-conservation, AEWs can be clearly tracked in isentropic PV fields. Under the assumption that frictional effects are secondary, non-conservation of isentropic PV can be directly linked to convection (e.g., Brennan and Lackmann (2005)). Isentropic PV has effectively been used as a tool to understand the process of TC genesis in many prior studies (e.g., Davis and Bosart (2001)). A coherent maximum in PV can be associated with a closed circulation under the assumption of a suitable balance condition. Thus, the development of sub-synoptic circularly-symmetric PV patches within a parent wave is consistent with the description of a gyre-pouch in wave-following frame. The PV view does not necessitate the estimation of the wave phase speed that the Lagrangian approaches require, which can often have significant uncertainties in their derivations (e.g. Dunkerton et al., 2009). Furthermore, the action at a distance property of PV can be used to infer the potential for existence of a closed circulation at multiple levels.
The specific objectives of this study are to:
• Compare the formation of closed gyres from an isentropic axisymmetrization PV perspec-tive to the evolution from a Lagrangian framework;
• Determine the relative frequency of TC genesis within a quasi-linear strip of isentropic PV;
• Determine if AEWs can survive the complex process of TC genesis, and if so, the relative frequency of such survival;
• For cases where the wave does not surfive, determine what dynamic processes result in the demise of the wave.
1.2
Data
The primary data used here are the GFS final analysis fields and Tropical Rainfall Measuring Mission (TRMM) multisatellite precipitation analysis (TMPA; TRMM product 3B42; Huffman et al. (2007)). Both data sets are on 1◦ latitude-longitude grids. While there are inherent
We focus on tropical storms that met the following criteria: (1) Clear AEW source of origin; (2) minimal baroclinic and upper level forcing. A total of 51 storms were chosen for this study. These cases are broadly consistent with the non-baroclinic origin TCs classified in McTaggart-Cowan et al. (2008a). We also include some cases categorized as weak tropical transition by them on the basis of subjective inspection of the data.
Throughout the paper, isentropic PV is shown either on the 315 K surface or averaged over the 310-320 K layer. The 315 K level corresponds to roughly 650 hPa in the tropics and about 600 hPa in the subtropics; as such, it is an ideal surface to examine both AEW circulation and equatorward intrusion of PV of mid-latitude origin. Changing the analysis level to 320 K did not significantly alter any of the results shown here.
PV maxima associated with AEWs are identified using an algorithm that (1) searches isentropic PV fields for local maxima that exceed 0.2 PVU (1 PVU = 10−6
m2
Ks−1
kg−1
); and (2) ensures that at least 1 closed PV contour of value 0.1 PVU less than the central maximum can be drawn. PV is bilinearly interpolated to a cylindrical grid, with the local PV max as the center of the grid. Qualitative estimate of axisymmetry of the PV patches is then obtained by taking the ratio of the largest to smallest axis of the PV patch after projecting the data on a cylindrical frame. The axes are measured for the contour that is e−1
of the maximum PV at the center. This aspect ratio based definition of asymmetry is based on a similar definition in previous studies (e.g., Melander 1987). Values closer to 1 denote a more axisymmetric vortex compared to larger values. Similar results were obtained when we used an alternate definition based on the azimuthal variance of PV at set distances from the wave center wherein symmetric vortices have near zero PV variance (not shown).
The isentropic PV framework also allows us to explore the process of PV thinning associated with AEWs. A useful diagnostic is the Okubo-Weiss filamentation time, which is defined as the e-folding time scale of the quasi-horizontal isentropic PV gradient (Rozoff et al., 2006). Since PV thinning is associated with an increase in PV gradient, this diagnostic provides a succinct way of identifying areas of rapid change in AEW structure. These rapid changes occur in such processes as ITCZ breakdown and separation of the TC and wave. In a recent study, Tsai et al. (2010) derived a version of the Okubo-Weiss filamentation time for three-dimensional divergent flow constrained by material conservation of isentropic PV. Adapting their formulation and neglecting the effect of earth’s curvature terms on the equations of motion (given the proximity to the equator), the filamentation time is written as:
τf il = 2{δ+ (S
2
strain-dominated regions, and small values of this diagnostic indicate rapid increase in PV gradient and potential for cut-off low formation. Tsai et al. (2010) examined three cases of PV fila-mentation of upper-level troughs, including one in the tropics. While the applicability of the filamentation time defined above is questionable when non-conservative processes are present, some insight in AEW evolution can be gained in areas away from active convection. Small values of filamentation time highlight strain-dominated regions, where the PV associated with the AEW is expected to thin.
1.3
Results
1.3.1 Subjective classification of wave evolution
In animations of PV fields, AEWs exhibit a complex and rich array of behavior ranging from undulations in zonally elongated PV anomalies to coherent isolated patches within the trough of the large-scale synoptic wave. The zonally elongated PV features form in association with ITCZ convection and appear to be very common modes of AEW evolution. Fourteen of the 51 analyzed cases featured this evolution. Thus, as in the eastern Pacific, ITCZ breakdown is an important source of TC precursors. After examining the evolution of all 51 cases, the broad range of AEW evolution during TC genesis was subjectively classified into three categories.
• Type A: PV associated with the wave contracts in horizontal scale through axisymmetriza-tion and the wave’s PV field is irreversibly deformed. TC genesis is followed by a change in the speed and direction of the TC relative to the initial propagation direction of the wave, indicating that the TC vortex is no longer constrained to follow the AEW waveg-uide. Of the 51 storms considered here, 42 were classified as type A (Table 1.1). An idealized schematic of this evolution is shown in Fig. 1.1a.
• Type B: The wave and TC-vortex separate and the wave evolves independently, as seen in both isentropic PV and wave-following streamlines. Filamentation of the PV leads to separation of the TC from the wave, akin to a cut-off low formation in the mid-latitudes. Typically, the TC acquires a rapid poleward motion while the remnant wave continues to propagate westward. This behavior is less commonly seen as only 6 cases in our data set fit this description (Table 1.1), and the idealized schematic of this evolution is shown in Fig. 1.1b.
hybrid wave-TC evolution were identified (Table 1.1), and the idealized schematic of this evolution is shown in Fig. 1.1c.
The results tabulated above indicate that the most common post TC genesis fate of AEWs is that of being subsumed within the developing storm or rapid decay soon after (Type A). In only about 1 in 10 cases, the remnant wave circulation is coherent enough to continue propagating after TC genesis. Examination of PV fields suggests that merging of PV from breaking mid-latitude troughs or from neighboring easterly wavepackets are common sources of invigoration of a decaying wave after separation of the TC.
Subjective examination of the structure of the PV field indicates that of the 51 TCs con-sidered here, 16 cases can be classified as ITCZ breakdown type. In these cases, typically a linear PV strip that forms in conjunction with ITCZ convection over North Africa is advected westward into the Atlantic. Broadly similar to the idealized simulations of Guinn and Schubert (1993) and Ferreira and Schubert (1997), breakdown of the PV strip leads to coherent cyclonic gyres. The commonality of observed ITCZ breakdown differs from the composite analysis in Magnusdottir and Wang (2008). In the paper, the authors describe the summer months as dominated by AEWs that originate over the African continent, with no prevalant linear PV strip present over the Atlantic.
For the sake of convenience, henceforth, we refer to both quasi-neutral waves emerging from North Africa and those forming from ITCZ breakdown in the Atlantic as AEWs. In the following section, an example from each category described above is presented to illustrate the key features of the respective AEW evolution.
1.3.2 Illustrative Examples Type A: Dolly 2008
Tropical Storm Dolly (2008) formed at 1200 UTC 20 July 2008 within an AEW that had emerged from the west coast of Africa about nine days earlier. A 6◦-latitude range following
the pre-Dolly AEW was used to develop a Hovmoller diagram of 315 K potential vorticity and TRMM precipitation. Fig. 1.2 shows that the AEW can be clearly tracked from eastern Atlantic to the Caribbean Sea in both PV and TRMM precipitation. An increase in convection around 1200 UTC 16 July while located near 60◦W is accompanied by an increase in the area averaged
PV following the wave. The phase speed of the wave is nearly constant at around 8.5 ms−1
. Another period of increase in 315 K PV and enhanced convection began around 0000 UTC 19 July, indicative of the TC-genesis process that was already underway.
• Seven days prior to TC genesis (Fig. 1.3a), the precursor to Dolly appears as an elongated PV band that was associated with ITCZ convection over Africa and advected westward by the mean flow. The streamfunction contours are nearly zonal. At this time, the pre-Dolly feature is part of a basin-wide undulating PV strip.
• The subsequent sequence of charts show the breakdown of the PV strip in a manner consistent with Guinn and Schubert (1993) and Ferreira and Schubert (1997). There is clear evidence of pooling of PV into distinct eddies connected to their neighbors by thin filaments.
• By 1200 UTC 17 July (Fig. 1.3d), three cyclonic gyres have resulted after the breakdown of the PV strip.
• The streamfunction field shows a gradual sharpening of the trough and development of the Dolly wavepacket. By 1200 UTC 20 July (Fig. 1.3g), the PV within the pre-Dolly wave is much more axisymmetric compared to the associated PV shown in previous panels.
• The last panel (Fig. 1.3h) corresponds to the official designation of tropical depression and shows that the trough has contracted further and the PV within the trough has increased.
• Merger of PV of midlatitude origin with AEWs is seen in several panels. For instance, in Figs. 1.3 c-e, an equatorward breaking and thinning midlatitude trough merges with the pre-Dolly AEW.
Figure 1.4 shows the 310-320 K layer averaged PV, TRMM precipitation and streamlines in wave-following frame for the same times as in Fig. 1.3. The Lagrangian streamlines are calculated in a manner similar to DMW09, where the estimated wave phase speed is subtracted from the total flow. Wave phase speed is calculated from the Hovmoller diagram (Fig. 1.2) as noted earlier. Key aspects of AEW evolution in this Lagrangian framework are:
• Seven days prior to TC genesis (Fig. 1.4a), the circulation surrounding the elongated PV maximum is not associated with closed streamlines. The bulk of the precipitation is to the south of the PV strip, with a weak maximum just to the west of the wave center. Diabatic generation of PV, with enhancement in the lower troposphere, is expected in areas of precipitation.
of the PV filaments connecting the gyres that formed from the breakdown of the original PV strip.
• As the PV continues to axisymmetrize over the next 96 hours, precipitation shifts closer to the wave center. The PV filament connecting the pre-Dolly gyre to its neighbors continues to thin, and even breaks on the eastern side. Over the days leading to the formation of the tropical depression, both PV and precipitation rates are observed to increase.
In the Lagrangian framework, closed gyre formation is consistent with axisymmetrization of PV and is associated with an increase in precipitation near the wave center. Diabatic PV generation aids the axisymmetrization by increasing the PV anomaly, which further enhances the nonlinear PV advection and pooling of the PV within the gyre. Figure 1.5 shows the 310-320 K layer averaged PV and filamentation time (24 h or less, as in Tsai et al. (2010)) computed using the layer averaged winds. As previously mentioned, shorter filamentation times denote strain-dominated regions and are located outside the core PV anomaly. The shortest filamentation times are found on either side of the AEW PV anomaly, and are consistent with the stretching and thinning of PV on those time scales (e.g., Figs. 1.5c and 1.5d). During the process of TC genesis, filamentation times remain quite long or not defined, consistent with the PV anomaly becoming more axisymmetric and vorticity dominating straining flow (e.g., Fig. 1.5g).
A period of axisymmetrization and increase in area average PV and precipitation commences around 0000 UTC 15 July, as seen in the 315 K PV precipitation (Fig. 1.6). Initially, it appears that precipitation leads PV enhancement, but they appear to evolve nearly simultaneously after the gyre forms. After the formation of the closed gyre on the 16th of July, a period of nearly steady evolution is followed by a second round of axisymmetrization, enhanced PV generation, and increased precipitation commencing around 1200 UTC 18 July, leading up to and beyond the formation of the tropical depression.
In summary, during the processes of TC genesis for Dolly, the precursor wave was deformed and axisymmetrized. After TC genesis, the wave did not propagate further, as the system underwent a complete transformation into a nonlinear vortex. In the earth-relative frame, the flow associated with the wave sharpened, as represented by the streamfunction, and the wavepacket contracted in scale. After TC genesis, Dolly propagated more northward, consistent with the environmental steering current.
Type B: Bertha 2008
Bertha formed close to the west African coast from an AEW around 0600 UTC 3 July 2008. Using a 6◦-latitude range following the disturbance, the Hovmoller diagram in Fig. 1.8 shows
the evolution of the AEW during and post TC-genesis. The TC and the wave separate around 0000 UTC 4 July, soon after which the TC acquires rapid northward motion and moves out of the averaging latitudinal range of the Hovmoller plot. Subsequently, the wave begins to weaken and diabatic activity nearly ceases by 5 July. Despite this weakening of diabatic activity, the remnant PV continues to propagate westward and maintains its strength for over 96 hours. The key features in the sequence of PV and streamfunction fields in the earth relative frame (Fig. 1.9) are:
• The precursor AEW appears as a strong PV anomaly embedded within a zonally oriented PV strip on the 315 K surface. In the first panel (Fig. 1.9a), a closed contour in stream-function field can be seen. The streamstream-function field shows an open wave-like structure 24 hours later (Fig. 1.9b). At this time, there is a secondary PV anomaly just to the east of the primary anomaly.
• By 3 July, the two PV anomalies within the AEW have merged and TC genesis has occurred (Fig. 1.9c). The AEW has a southwest to northeast tilt. One day later, the TC and the remnant wave have separated (Fig. 1.9d).
• On 5 July, the TC is located over 10◦ poleward of the remnant wave, and the two are
connected by a thin PV filament. Over the next couple of days, the separation between the two increases. Simultaneously, PV from a mid-latitude trough (marked by the symbol T) is advected cyclonically around the TC and it eventually merges with the remnant AEW (Figs. 1.9f,g).
The sequence of TC formation and separation seen in Figs. 1.9d-f bears a similarity to cut-off low formation in the midlatitudes via the cyclonic wave breaking process. The PV associated with the AEW appears to wrap cyclonically in association with the accentuated southwest to northeast tilt.
In the Lagrangian wave-following frame there exists a closed circulation surrounding the large PV anomaly just off the west African coast (Fig. 1.10a). Precipitation is broadly centered within the gyre. About 30 hours after TC genesis (Fig. 1.10d), the closed circulation associated with the tropical storm and the PV of the remnant wave have begun to separate. At this time, there is precipitation associated with the remnant wave. In the remaining panels, the focus is on the remnant wave. As the PV of mid-latitude origin wraps around the TC and merges with the wave, the circulation amplifies. In fact, by 1200 UTC 8 July, a closed gyre has formed again in association with the wave (Fig. 1.10h). The wave continues to propagate towards the west-northwest for several days while maintaining the closed gyre (not shown). Notably however, there is no significant convective activity associated with this wave. The wave eventually merges with an extratropical system in the Gulf of Mexico. Thus, despite the formation of a second gyre that remains coherent for 2-3 days, a second TC does not result.
The filamentation time analysis for Bertha (2008) is shown in Fig. 1.11. As was the case in Dolly (2008), the shortest filamentation times are found on the eastern and western sides of the AEW PV anomaly. Unlike Dolly (2008), however, the filamentation time scales are much shorter, with values as low as 6-12 hours present to the south of the main PV anomaly in Fig. 1.11b-d. The short filamentation times are consistent with the thinning of PV to the south of the main PV anomaly. This thinning PV structure is analogous to the filamentation resulting in the formation of cut-off lows in the mid-latitudes, as described in Tsai et al. (2010). Following this period of filamentation of PV, the filamentation time scale becomes longer or no longer defined, shown in Fig. 1.11f-h). This is consistent with the dominance of vorticity over straining flow. The result is a more axisymmetric PV anomaly associated with the wave propagating to the west.
by deep convection within the wave which leads to amplification of lower-tropospheric vorticity. The separation of the wave and TC is marked by the discontinuity in vorticity around 1200 UTC 3 July. Following the separation, the vorticity in the remnant wave is mainly confined to mid and upper troposphere. Merger with upper-tropospheric vorticity of extratropical origin is evident between 5-7 July. As noted earlier, convective activity is absent, as seen in the lack of significant upward vertical velocity.
In summary, near the time of TC genesis, the parent wave and TC decoupled, leading to separate propagation characteristics. The wave continued to propagate to the west for several days, according to the waveguide, whereas the TC propagated according to the environmen-tal steering flow. Filamentation of PV allows the wave to continue propagating, rather than subsuming within the TC circulation. The wave’s circulation amplifies and closes off after TC genesis, in part due to merging with PV from a mid-latitude system. However, the lack of con-vective coupling with the parent wave likely prevented a second case of TC genesis associated with the wave.
Type C: Earl, 2004
Earl formed on 13 August 2004 from an AEW that moved off the coast of west Africa on 10 Au-gust. After propagating across the Atlantic for several days, the wave moderately strengthened. NHC classified the system a depression at 1800 UTC 13 August. Over the next 24 hours, the system continued to slowly strengthen, and NHC classified the system a tropical storm at 1800 UTC 14 August. By 1800 UTC 15 August, the system began to weaken, and the official NHC forecast designated it as an open wave on 16 August. The remnant wave eventually crossed into eastern Pacific and led to the formation of Hurricane Frank on 23 August. This remarkable evolution is of interest for several reasons, notably for the apparent elasticity of the AEW. Key observations are enumerated below.
• The 310-320 K averaged PV and 600 hPa streamfunction fields in the earth-relative frame for this AEW (Fig. 1.15) show an initially weak but coherent wavepacket that moves due westward and axisymmetrizes during and after TC genesis (Figs. 1.15 b,c).
• Even though the system is no longer designated a TC, the AEW remains coherent and crosses Central America on 18 August. While the streamfunction fields clearly show the wavepacket, the PV is deformed, possibly due to interaction with the topography.
• As seen in subsequent panels (Fig. 1.16b-h), a closed gyre exists most of the wave life-time except for a couple of days during its passage over the Central American highlands. Throughout this evolution, the wave remains coupled to convection, as seen in the pre-cipitation within the gyre.
The time series of PV, precipitation and axisymmetry (Fig. 1.18) shows the complex evolu-tion of this AEW. Formaevolu-tion of the closed gyre is preceded by an increase in precipitaevolu-tion and area averaged 315 K PV. Axisymmetrization continues after TC formation in association with an increase in wave-averaged PV. Even after the decay of the TC around 0000 UTC 16 August, the gyre persists for over a day until the time the wave begins to cross into eastern Pacific. The rapid loss of axisymmetry and decrease in area averaged PV reverses after the remnant wave reaches the eastern Pacific. The gyre is reestablished around 1800 UTC 19 August, and the PV strengthens as precipitation rate increases. Frank forms approximately 84 hours after the reestablishment of the gyre.
The filamentation time analysis shown in Fig. 1.17 is consistent with this complex evolution of the AEW during and after TC genesis. Near the time of TC genesis, the filamentation time is undefined near the PV anomaly, as shown in Fig. 1.17b. This continues for the next 48 hours, as the rotational flow continues to dominate over straining flow. However, as the tropical cyclone weakens, the filamentation time increases significantly on the periphery of the PV anomaly (Fig. 1.17d). The PV associated with the tropical cyclone thins, consistent with the evolution to a much weaker system. This weaker, open wave propagates to the west over the next several days, with long or undefined filamentation times on the periphery of the PV anomaly (Fig. 1.17e-h).
This evolution is consistent with the cross section of vorticity and vertical velocity (Fig. 1.19). The main feature of interest here is the initial downward building of relative vorticity until the closed gyre forms in the lower troposphere. After this, the enhanced relative vorticity remains in the lower troposphere, while deep convection exists nearly throughout the lifetime of the wave. The only exception to this occurs during the passage over Central America. The vortic-ity recovers quickly after reaching the eastern Pacific on 19 August, as seen in the deep cyclonic vorticity column with anticyclonic vorticity in the upper troposphere.
1.4
Discussion and Conclusions
The overarching purpose of this study was to compare the evolution of AEWs undergoing TC genesis from an isentropic axisymmetrization PV perspective to the evolution from a Lagrangian framework. Only tropical, nonbaroclinic AEWs were considered. In isentropic PV fields, the evolution of AEWs is rich and varied, ranging from quasi-neutral wavepackets to breakdown of linear PV strips associated with the ITCZ. Typically, the PV associated with the AEW begins to axisymmetrize several days prior to the formation of the TC. This is confirmed visually as well as using a metric of axisymmetry diagnosed from the wave-centered PV distribution. Once a TC forms within a parent wave, three outcomes are possible for the synoptic-scale wave:
• The wave is deformed and axisymmetrized. In these cases, the wave ceases to propagate further. In this situation, there is a complete transformation from a quasi-linear wave to a nonlinear vortex. In earth-relative frame, the streamfunction associated with the wave sharpens as the wavepacket shrinks in scale. This outcome is the most common.
• The wave and TC decouple, leading to separate propagation. This scenario may be similar to mid-latitude wave breaking and wrap-up of low PV around the deformed trough, leading to a cut-off low, while the remnant wave continues to propagate. NHC storm reports occasionally indicate that the remnant wave can continue and possibly even lead to the formation of another storm. For example, the storm reports for Tropical Storm Franklin and Gert (2005) indicate the same wave was the precursor to both storms. In the case illustrated here, the AEW underwent a cylconic wave breaking. After the separation of the TC, the remnant wave continued to propagate for several days but did not lead to a second TC. About 10% of cases considered in this paper exhibit this evolution.
• The wave and TC can co-exist and propagate together for some time after TC genesis. In the case described here, the TC decays and the wave survives to eventually lead to a second TC. This outcome is relatively uncommon in the Atlantic, as only 3 of the 51 analyzed storms exhibited this evolution.
Wang et al. (2010), in that the gyre forms when the wave moves into a region where a critical layer forms. While the role of diabatic process was not explicitly diagnosed, it is likely that PV generation in the lower troposphere accelerated the axisymmetrization.
In light of the recently proposed marsupial paradigm for TC genesis by DMW09, the results presented here suggest:
• Our results are broadly consistent with those of DMW09 and Wang et al. (2010), in that TC genesis is commonly preceded by the formation of a closed circulation in the midtroposphere several days in advance.
• It is also seen here that the existence of a closed circulation does not guarantee TC genesis. In the case of the remnant wave after formation of Bertha (2008), a closed gyre exists for several days without further development. The quasi-neutral wave persists through PV merger, but the circulation is confined to the middle troposphere and does not have a significant convective signal associated with it.
• DMW09 draw a line of causality from the formation of a cats eye within the critical layer of the propagating wave, organization of convection, and eventual TC genesis by a bottom up aggregation of vorticity. In the results seen here, the formation of the meso-α proto-vortex is nearly simultaneously accompanied by active convection, shown by the time-series analyses. However, once the vortex forms, it does become a locus of further convection.
• The proto-vortex is not confined to a single level but typically covers a significant part of the lower troposphere, as the vortex scale shrinks horizontally and is stretched vertically. The role of preexisting convection is likely critical in setting the vertical extent of this vor-tex through vertical advection of vorticity, as shown in the wave following cross-sections.
• DMW09 suggested a potential for a cooperative relationship between the proto-vortex and the synoptic scale wave. In this cooperative relationship, the larger scale wave provides a sheltered environment for the vortex, which in turn helps maintain the wave through diabatic feedback. However, the results of this study suggest that a convectively active, amplifying proto-vortex leading to TC genesis hastens the destruction of the wave by irre-versibly deforming the wave. In this process, the wave is subsumed within the developing TC or breaks, leaving a weaker remnant circulation.
The use of PV to describe the evolution of the AEWs before, during, and after TC genesis permits a Lagrangian analysis of the gyre’s structure while avoiding error in estimating wave phase speed. The action at a distance principle of PV permits its use to infer the potential for existence of a closed gyre beyond the level where the PV is observed. Isentropic PV analysis also permits similar analysis after TC genesis, as it can be applied to both wavy and non-wavy disturbances. Future studies will use PV inversion techniques to analyze the scale of PV anomalies that lead to the existence of closed gyres. The use of PV inversion techniques will also aid in better understanding if the analogy to mid-latitude wave breaking is dynamically sound. This can be shown by removing the PV contribution from the associated wave to test if the streamlines close off, regardless of the circulation associated with the storm.
Based on the isentropic PV analysis in this study, the ITCZ breakdown pathway to TC genesis was observed to be quite frequent, with this pathway representing 14 of the 51 analyzed cases of TC genesis. These observed cases of ITCZ breakdown are similar to the idealized simulations of Guinn and Schubert (1993) and Ferreira and Schubert (1997), where a linear strip of PV leads to coherent cyclonic gyres. The commonality of ITCZ breakdown cases differs from the composite analysis in Magnusdottir and Wang (2008), in which the authors use spectral filtering to analyze the mid-tropospheric vorticity field in the Atlantic. We suggest the lack of a coherent ITCZ structure on which AEWs can grow described in their paper is a product of the spectral filtering methods used. In the Eastern Pacific, the PV strip is often zonally uniform for extended periods of time, allowing for spectral filtering techniques to depict a coherent ITCZ structure. In the Atlantic, the PV is projected onto a zonally-varying yet, resulting in a zonally nonuniform PV field. In turn, the spectral filtering techniques are unable to capture the ITCZ structure in this region.
Type Year Storm Names
A 2000 Debby, Ernesto, Helene, Joyce 2001 Barry, Chantal, Dean, Erin 2002 Dolly**, Isidore, Lili
2003 Claudette, Fabian, Isabel **
2004 Bonnie**, Charley **, Frances, Jeanne, Karl, Lisa
2005 Dennis**, Emily**, Harvey, Irene**, TD10, Maria, Philippe**, Alpha 2006 Chris, Ernesto**. Florence**, Gordon, Isaac
2007 Felix**, Ingrid **, Karen**
2008 Dolly**, Gustav, Hanna, Ike, Nana**, Omar B 2000 Chris, Isaac**
2003 Kate, Nicholas 2005 Lee
2008 Bertha
C 2001 Jerry
2004 Earl
2005 Gamma
Figure 1.2: Hovmoller diagram of 315 K potential vorticity (10 PVU, shaded) and TRMM precipitation (mm/hr, contours) averaged over 6◦-latitude range following the pre-Dolly AEW.
Figure 1.4: 310-320 K layer averaged potential vorticity (10 PVU, shaded), 600 hPa streamlines (thin contours), and TRMM precipitation (mmhr−1
Figure 1.6: Time series of 315 K potential vorticity (10 PVU, thick black line), TRMM rainfall (inday−1
, dashed black line), both averaged within a 3◦ box following the pre-Dolly wave, and
Figure 1.7: Vertical structure of relative vorticity (s−1
, shaded) and vertical velocity (ms−1
Figure 1.8: Hovmoller diagram of 315 K potential vorticity (10 PVU, shaded) and TRMM pre-cipitation (mmhr−1
, contours) averaged over 6◦-latitude range following the pre-Bertha AEW.
Figure 1.10: 310-320 K layer averaged potential vorticity (10 PVU, shaded), 600 hPa stream-lines (thin contours), and TRMM precipitation (mmhr−1
Figure 1.12: Time series of 315 K potential vorticity (10 PVU, thick black line), TRMM rainfall (inday−1
, dashed black line), both averaged within a 3◦ box following the pre-Bertha wave, and
Figure 1.13: Vertical structure of relative vorticity (s−1
, shaded) and vertical velocity (ms−1
Figure 1.14: Hovmoller diagram of 315 K potential vorticity (10 PVU, shaded) and TRMM precipitation (mmhr−1
, contours) averaged over 6◦-latitude range following the pre-Earl AEW.
Figure 1.16: 310-320 K layer averaged potential vorticity (10 PVU, shaded), 600 hPa stream-lines (thin contours), and TRMM precipitation (mmhr−1
Figure 1.18: Time series of 315 K potential vorticity (10 PVU, thick black line), TRMM rainfall (inday−1
, dashed black line), both averaged within a 3◦ box following the pre-Earl wave, and
Figure 1.19: Vertical structure of relative vorticity (s−1
, shaded) and vertical velocity (ms−1
Chapter 2
Interaction of African Easterly
Waves and Upper-level Troughs
2.1
Introduction
It is well established that environmental factors play an important role in tropical cyclogenesis (TC genesis). Gray (1988) describes many of these environmental influences on TC genesis. He notes that the most important factor in determining the likelihood of TC genesis is the ambient synoptic scale flow. Upper-level shearing synoptic patterns can prevent TC genesis and can cause an exisiting tropical cyclone to dissipate. Using data from twelve radiosondes, McBride and Zehr (1981) determined that TC genesis is primarily modulated by external influences. The results from their study suggest a need for large positive zonal shear to the north and negative zonal shear to the south of the developing system. Sadler (1976) examined the role of the tropical upper tropospheric trough (TUTT) in genesis of early season typhoons in the Western North Pacific that developed in June 1971. He found that the anomalous extension of the TUTT into the western Pacific significantly aided in storm development. The development mechanism is based on the role of the accompanying sub-equatorial ridge (SER) to the south of the TUTT. This SER reduces the shear in the western North Pacific for the lower-level troughs. Furthermore, the SER and TUTT aid in increasing the outflow for the lower-level trough, leading to compensating convergence and increased associated convection. This model for storm development was tested in a follow-up study for an outbreak of four simultaneous typhoons in July 1972 by Sadler (1978).
axisymmetric numerical model. The results suggest the developing storm rapidly intensified due to tangential velocity fluxes into the storm. The composite nondeveloping storm did not intensify, due to weaker tangential velocity fluxes. This tangential velocity flux convergence exerts a cyclonic stress in the upper troposphere that acts to destabilize the gradient wind balance of an axisymmetric vortex, pressure gradient, and centrifugal forces. This results in the generation of a secondary circulation in the form of upper-level outflow and lower level inflow, aiding in storm development. Challa and Pfeffer (1990) used a fully three-dimensional hurricane model and found that without significant tangential velocity fluxes, their initial disturbances did not develop into hurricanes. Gray (1998) also points out that externally forced convergence is often responsible for initiating and enhancing the deep convection required for TC genesis.
There have been a number of studies aimed at specifically understanding the effect of mid-latitude troughs on the strength of pre-existing tropical cyclones. Holland and Merrill (1984) examined the role of the environment on storm intensity, strength, and size changes of a cyclone. They conclude that an externally-forced upper-level outflow several hundred kilometers away from a storm center can have a substantial effect on the core of the cyclone, due to the low inertial stability in this outflow region. This environmentally-driven outflow could then initi-ate an invigoriniti-ated convective region, enhancing warm core development. Molinari and Vollaro (1989) and Molinari and Vollaro (1990) examined the role of the tangential velocity flux via an upper-level trough in the intensification of Hurricane Elena (1985). One of the major questions they sought to answer was if enhanced tangential velocity fluxes precede deepening or simply reflect that deepening is underway. In their analysis, they show there was a delayed response to deepening; i.e., the fluxes were shown to have a “causal” relationship to the intensification. The eddy flux momentum produced an outflow maximum that tracked inward with the eddy momentum source with time. When the outflow reached the storm core, rapid pressure falls ensued. A follow-up study by Molinari et al. (1995) used a PV framework to study the interac-tion of Elena with the upper-level trough. The PV anomaly associated with the upper trough thinned and never crossed the storm center due to the influence of the outflow anticylone. This resulted in a reduction in shear and allowed the storm to strengthen. While the potential for PV superposition and tangential velocity flux convergence are considered to be positive aspects of a trough interaction, the attendant vertical shear is a major detriment. Using compositing techniques, Merrill (1988) determined there was often an upper-level trough associated with nonintensifying storms.
be associated with tropical intensification due to upper-level trough interactions, but other en-vironmental factors must be considered in this determination besides tangential velocity flux convergence.
Hanley et al. (2001) conducted a composite study of the interactions between tropical cy-clones and upper-level troughs. After examining all Atlantic tropical cycy-clones from 1985-1996, they used tangential velocity flux convergence and vertical wind shear to divide the storms into various categories. “Favorable superposition” was a case where an upper-level PV maximum approached from the west. In this case, shear decreased with time and deepening occurred as the PV max approached and superposition occurred. The upper-level trough never passes the storm, as the upper-level PV max diminishes due to diabatic processes. In the “favorable distant interaction” cases, the trough approached but did not superimpose with the surface low. The result was increased shear, but because the storm was located in the right entrance region of the jet, the storm was still able to develop. In the “unfavorable distant interaction” cases, similar synoptic features were present as in the “favorable distant interaction” cases, but the shear was slightly higher. The result was the storm unable to intensify due to the effect of shear being larger than the jet’s forcing for ascent. They conclude that storms interacting with troughs are more likely to intensify than weaken.
There have been other several studies of the role of upper-level troughs in Atlantic TC genesis. Bracken and Bosart (2000) identified various sub-regions of development. Twenty-four cases formed in the “Bahamas” sub-region, off the southeast and mid-Atlantic coast of the United States. Here, an inverted V structure was observed, with a slight positive tilt. These TC genesis cases were associated with a highly-amplified trough-ridge pattern, and the disturbance was located in between the trough and ridge. Weak shear was observed in this region of TC genesis, as the trough was not accompanied by strong flow. McTaggart-Cowan et al. (2008b) studied a climatology of TC genesis in the Atlantic from 1948-2004. They utilized Q-vector forcing for ascent as a measure of upper trough interaction and lower-level baroclinicity for categorizing all TC genesis cases in these years. They determined approximately 31 percent of Atlantic storms formed with strong upper trough forcing.
and Diana (1984) in the Atlantic. They conclude it is the superposition of the upper-level and lower-level local PV maxima that leads to TC genesis.
Demaria et al. (1993) examined several cases of TC intensification. In two cases, enhanced tangential velocity flux convergence occurred in the stages where a wave was beginning to transform into a storm. For Hurricane Dean (1989), they noted a small region of eddy flux convergence when the system was developing from an AEW, due to an upper-level trough at 200 hPa to the north of the storm. They speculate the interaction was likely important for the initial formation of Dean from an AEW. For Tropical Storm Arthur (1990), they detected an enhanced tangential velocity flux convergence once again when the storm was developing from a tropical wave. However, the study did not show conclusively the role of this enhanced momentum flux convergence in the process of TC genesis.
As shown, there has been a strong focus on the important roles of environmental forcing on TC genesis. There has also been a strong focus on the interaction of pre-existing tropical cyclones and upper-level troughs. However, far fewer studies directly analyze the impact of mid-latitude troughs on the process of TC genesis from AEWs. In particular, there has not been a comprehensive observational study of non-developing and developing AEWs interacting with upper-level troughs. Many previous studies have indicated the process of TC genesis for AEWs is different than TC genesis occuring in other regions and situations (e.g., Dunkerton et al. 2009, Serra et al. 2008). Better understanding of the interaction of AEWs and upper-level troughs will serve two purposes. It will help better depict the role of synoptic scale processes in TC genesis. It will also help Atlantic operational forecasters in their outlook for TC genesis during such interactions.
2.1.1 Objectives
An objective method is implemented to find all cases from 2000-2008 years in which an AEW interacts with an upper-level trough. The study includes both cases of TC genesis as well as null cases. The goals of this study are to answer the following questions:
• How often do AEWs and upper-level troughs “interact?”
• What are the favorable and unfavorable aspects of the AEW and upper-level trough interactions?
2.2
Data
2.2.1 Interaction Definition
The GFS final analysis 1◦ data set from 2000-2008 was used to find the interacting AEWs
and upper-level troughs. An algorithm was created to track AEW and upper-level troughs in June-November. It identifies trough axes from streamfunction fields by locating and connecting points where the meridional wind vanishes. The AEWs were tracked along the 850 hPa isobaric surface, while the upper-level troughs were tracked at the 200 hPa surface. When using the 600 hPa level to track the AEWs, very similar results were obtained (not shown). An interaction was defined as a case where a point in the AEW and upper-level trough axes were situated within a threshold of 400 km from one another for at least 24 hours. Furthermore, only cases where the AEW was located to the east of the upper-level trough were studied. Cases where the upper-level trough was located to the east of the wave are not expected to greatly impact the characteristics of an AEW to the west (e.g., Reilly and Emanuel 1991). Select null TC genesis cases interacting with mid-latitude troughs are then compared to cases of TC genesis using various fields, including area-averaged relative humidity, vertical shear, tangential velocity flux convergence, and a measure of forced ascent.
2.2.2 Potential Vorticity
Ertel PV is examined on 200 hPa and 600 hPa isobaric surfaces for the select case studies. PV has several useful aspects. Because PV increases towards the top of the troposphere, superim-posed plots of 200 hPa and 600 hPa can easily be created, as described in Atallah et al. (2007). These plots are developed with the use of different contour levels for each isobaric surface. Fur-thermore, as many studies have shown (e.g., Reilly and Emanuel 1991), upper tropospheric PV can induce low level cyclonic circulation, a necessary condition for TC genesis. The upper tro-pospheric PV also provides forcing for ascent, potentially aiding in the stretching of pre-existing vorticity and increasing the relative humidity throughout the depth of the troposphere.
2.2.3 Tangential Velocity Flux Convergence
Flux convergence of eddy momentum was calculated as in Molinari and Vollaro (1989). Phys-ically interpretable units of ms−1
day−1
were used in this analysis and describes eddy flux convergence of tangential velocity. As in Molinari and Vollaro (1989), this tangential velocity flux convergence (TVFC hereafter) is defined as:
∂v ∂t =−
1
r2
∂ ∂rr
2
u′v′
where r is the distance from the wave center and u′v′ is the azimulthally averaged product
2.2.4 Reilly Emanuel Parameter
Reilly (1992) examines the role of upper-level troughs on tropical cyclone formation using case studies from 1991 in the western North Pacific. A forcing parameter (RE parameter hereafter) is used in the analysis, defined as:
F = -1/N Pk Pi,j (Vi,j,k~ −V40~i,j)· ∇Qi,j,k
where N is the total number of terms in the summation; Vi,j,k~ is the analysis velocity at
isentropic level k, horizontal grid points i,j; V40~i,j is the 400 hPa horizontal wind velocity for
grid points i,j; and Qi,j,k is the value of Ertel’s PV at grid point i,j, level k.
The summation in k is made over 350K to 370K isentropic levels, with 5◦ spacing. The
summation in i and j is made over varying distances from the center of the AEW and in the cases of developing TCs, from the best track center of the storm. These distances range from 3-7◦ latitude/longitude, consistent with the results presented in Reilly (1992). The forcing
parameter provides a measure of average PV advection near the tropopause as viewed in the frame of a parcel at 500 hPa. Positive values of the forcing parameter should correspond to forced ascent, with negative values corresponding to externally forced descent. In the thesis, the authors determined strong positive values of the forcing parameter precede periods of rapid intensification, with forcing parameter values from 0.4-4x10⁻¹¹
m2
Kkg−1
s−2
.
2.2.5 Algorithm Results
2.3
Case Studies
2.3.1 Tammy (2005) Potential Vorticity
The AEW that corresponded to Tammy (2005) moved off the African coast by 1800 UTC 23 September, shown in Fig. 2.1a. The wave was relatively strong, with PV values at 600 hPa over .90 PVU. For several days, the wave propagated to the west with a typical phase speed represented by Cape Verde AEWs. By 0000 UTC 30 September, shown in Fig. 2.1b, the wave was located near 60◦W, with PV values over .70 PVU. By 0000 UTC 2 October, the wave began
interacting with an upper-level trough located just to the east of the northern Bahamas. The upper-level trough at this time was relatively weak, with PV values associated with it only as high as 3 PVU in a very localized area, as shown in Fig. 2.1c.
Over the next 48 hours, the upper-level trough remained relatively stationary, but weakened signficantly. By 0000 UTC 4 October, the upper-level trough had PV values below 1 PVU, as shown in Fig. 2.1d. This weakened trough continued to interact with the west-northwesterly propagating AEW, while another mid-latitude system began approaching the east coast. The disturbance was nearly superimposed with the trough axis by 0000 UTC 4 October. At 0600 UTC 5 October, the NHC officially declared the system a depression. The superimposed 200 hPa and 600 hPa PV at this time, shown in Fig. 2.1e, indicates an intensified system with PV values over 1 PVU near the center of the storm just off the Florida coast. The upper-level trough that was once located near the northern Bahamas is no longer visible. During this time, the secondary mid-latitude trough was approaching the system from the west, with 200 hPa PV values as high as 2 PVU associated with it just to the west of the system. Over the next 24 hours, Tammy (2005) continued to strengthen as it approached the northern Florida and southern Georgia at 0000 UTC 6 October, as shown in Fig. 2.1f. PV values at this time at 600 hPa were over 1.5 PVU, indicating a strengthened system. After this time, Tammy (2005) moved over land and weakened, before dissipating on 7 October as it merged with the secondary mid-latitude system.
scale PV anomaly associated with a strong mid-latitude trough.
Tangential Velocity Flux Convergence
Fig. 2.2 shows a plot of the azimuth-averaged 200 hPa TVFC for 3-6 October 2005. Initially, weak negative TVFC moved from a radius of 1400 km towards the center of the storm. This weak negative TVFC increased in magnitude and reached the center of the storm around 0600 UTC 4 October. The values of negative TVFC reached as high as -16 ms−1
day−1
at this time. These negative values are indicative of a decrease in cyclonic tangential winds and would be unfavorable for cyclogenesis. The negative TVFC likely originates as AEW approaches the upper-level ridge ahead of the latitude trough. As the AEW moves closer to the mid-latitude trough, the negative TVFC is replaced by positive values that propagate inward from about 1800 km radius at 0000 UTC 4 October to within 300 km of the wave center by 0000 UTC 4 October, just prior to TC genesis. After the formation of the TC, a second round of inward propagating TVFC ensues from around 600 km on 1200 UTC 5 October to the storm core on 0600 UTC 6 October. It is suggested that these two periods of TVFC likely aided in TC genesis and later tropical cyclone intensification.
Relative Humidity
Previous studies have emphasized the need for high relative humidity values in the mid and lower troposphere. Gray (1979) shows that relative humidity values must be greater than 50-60% for TC genesis to occur. In order to better examine the environmental conditions prior to and during TC genesis for Tammy (2005), average relative humidity was calculated within a 10◦ by 10◦ box surrounding the center of the wave and later tropical cyclone along various
isobaric surfaces and is shown in Fig. 2.3. The 850 hPa relative humidity plot indicates a very moist environment prior to TC genesis. At 1800 UTC 3 October, the average relative humidity was near 75%. Over the next 36 hours, the relative humidity steadily increased. At the time of TC genesis at 0600 UTC 5 October, the relative humidity was up to near 81%. At 600 hPa, relative humidity was near 70% at 0600 UTC 3 October. Over the next 36 hours, the relative humidity fluctuated between 68-72%, well above the necessary condition for TC genesis. In the 24 hours prior to TC genesis, the relative humidity increased from 68% to 78%. The increased mid-level humidity served as a favorable environment for TC genesis.
Vertical Wind Shear
As in the case of relative humidity, the 200-850 hPa vertical shear was averaged within a 10◦ by
10◦ box surrounding the center of the wave and later tropical cyclone. A time series of this
average vertical shear is plotted in Fig. 2.4. Prior to TC genesis, the average shear remained relatively constant, fluctuating between 16 ms−1
and 20 ms−1
. Following TC genesis, the shear increased to even higher levels, with values reaching as high as 24 ms−1
at 0600 UTC 6 October. These vertical shear values are much higher than suggested in Gray (1979) of 10 ms−1
. The strong vertical shear from the impacts of the upper-level trough and approaching secondary mid-latitude system likely hindered development. Even as the upper-level trough weakened and the wave became superimposed with this feature, strong vertical shear remained.
RE Parameter
The RE parameter time series for Tammy (2005) is shown in Fig. 2.5. TC genesis for Tammy (2005) occurred at 0600 UTC 5 October. The plot indicates weak forced vertical motion via PV advection for much of the time prior to TC genesis, with values below .2x10−11
m2
Kkg−1
s−2
. In the 12 hours prior to TC genesis, however, there was sharp increase in the parameter for the 3 km averaged domain, with values peaking near .35x10−11
m2
Kkg−1
s−2
at 0000 UTC 5 October. Although weaker than the observed values for cases of TC genesis in the western North Pacific shown in Reilly (1992), the increase in the parameter prior to TC genesis does suggest the weak PV anomaly associated with the upper-level trough provided some weak ascent that may have aided in TC genesis.
Comparison to Harvey (2005)
Although not shown, similar results were found for the analyses of Harvey (2005). The asso-ciated AEW interacted with an upper-level trough stretched across the west-central Atlantic. Throughout this time period, the wave remained weak, with maximum PV values below .90 PVU throughout this time. Over the next 24 hours, however, the upper level trough weakened and split, with two localized weak PV centers developing from the trough. Coincident with this upper-level trough weakening was the AEW increasing in strength. These trends continued for the next several days, with the NHC officially declaring the system a tropical storm at 0600 UTC 3 August.
a period of intensification beginning 0600 UTC 3 August. This is consistent with the results from Molinari and Vollaro (1989), where the authors found a period of rapid intensification for Hurricane Elena (1985) immediately following a strong area of TVFC reaching a close radius of 300 km from the storm center.
For Harvey (2005), average shear values were high during the period where the upper-level trough was strong. Prior to TC genesis, as the upper-level trough weakened, shear values decreased significantly to supportive levels for TC genesis. Based on this analysis, TC genesis occurred in spite of relatively strong vertical shear. This provides further support that only weak upper-level troughs and associated PV anomalies can positively impact the process of TC genesis for AEWs.
In contrast to Tammy (2005), the analysis of the RE parameter for Harvey (2005) indicated no significant positive forcing parameter when calculated from the 3, 5, or 7 km boxes around the disturbance center. Immediately prior to TC genesis, at the 5 km radius, there was actually weak negative values for the forcing parameter, indicating weak forced descent. Based on the analysis, the weak upper-level troughs may have aided in the generation of cyclonic vorticity via tangential velocity flux convergence, but the influence on forced ascent was much weaker.
2.3.2 Case Study: Null 2 (2005) Potential Vorticity
Null 2 (2005) interacted with a series of weak upper-level troughs as it propagated to the west. The evolution of the 200 hPa and 600 hPa PV for Null 2 (2005) is shown in Fig. 2.6. At 0000 UTC 11 September in Fig. 2.6a, soon after propagating off the African coast, the AEW associated with Null 2 (2005) was located near the remnants of a weak upper-level trough that had become nearly stationary over the eastern Atlantic. The wave was relatively strong, with PV values as high as 1.5 PVU at this time period at 600 hPa. Over the next 24 hours, the wave continued to propagate to the west towards the weak upper-level trough. The strength of both the wave and upper-level trough remained relatively constant throughout this time period. The upper-level trough began to move slightly to the west in such a way as to maintain a relatively constant distance to the AEW. By 0000 UTC 12 September, the PV maximum associated with the wave was located near 27◦ W, as shown in Fig 2.6b. Over the next 24 hours, a secondary
PV maximum over 1.9 PVU. However, over the next 24 hours, the wave underwent a period of rapid weakening as it continued to interact with the AEW. By 1800 UTC 14 September, while still interacting with the upper-level trough, the wave was much weaker and the PV signature was much more diffuse, shown in Fig. 2.6e, with PV values up to only 1.5 PVU. This weakening trend continued over the next several days, with the upper-level trough also weakening. By 0000 UTC 15 September, the AEW, once quite strong was barely detectable. Based on this analysis, there were periods throughout the interaction in which the AEW appeared quite strong in terms of its PV signature. However, TC genesis was never able to occur throughout the interaction.
Relative Humidity
Average relative humidity is plotted for Null 2 (2005) at 600 hPa and 850 hPa isobaric surfaces in Fig. 2.7. At 850 hPa, the relative humidity was near 65% at 0000 UTC 11 September, near the start of the interaction with the upper-level trough. Between 0000 UTC 12 September and 1800 UTC 13 September, the relative humidity steadily increased. By 1800 UTC 13 September, the average relative humidity was quite high near 71%. The moist low-level environment illustrated by the figure provides evidence of a relatively conducive environment in terms of low-level moisture for successful TC genesis. The 600 hPa plot of average relative humidity is a sharp contrast to the low-level relative humidity. Throughout the interaction, the average relative humidity surrounding the distubance was quite low, with values well below 40%. This is well below the threshold shown in Gray (1979) for TC genesis to be able to occur. The lack of significant mid-level moisture for Null 2 (2005) likely played a key role in preventing the development of the system into a tropical cyclone.
Vertical Wind Shear
The average 200 hPa-850 hPa vertical shear surrounding Null 2 (2005) is plotted in Fig. 2.8. For the first 24 hours in the analysis period, the vertical shear remained quite low, below 12 ms−1
. This would indicate a shear structure conducive to tropical cyclone development. However, as shown in the previous section, the mid-level relative humidity was very low during this period. Thus, the overall environment was not conducive to TC genesis. After 0000 UTC 12 September, the vertical shear began to increase. By 1200 UTC 13 September, the vertical shear was near 16 ms−1
. Although there were several periods of reduced shear after this time, the vertical shear remained above 12 ms−1
for the remainder of the analysis period.
In summary, the vertical shear profile indicated an environment conducive to TC genesis early in the analysis period. After the first 24 hours, the vertical shear increased well above 12 ms−1