The use of Cox regression and genetic
algorithm (CoRGA) for identifying risk
factors for mortality in older people
Rabiah Ahmad and Peter A. Bath
The increase in the proportion and number of older people in developed coun-tries has resulted in research investigating risk factors for adverse health out-comes, including mortality. However, research has been limited by the range of risk factors included in regression models. This is partly because traditional statistical methods and software packages allow a restricted number of variables and combinations of variables. This article describes ongoing research to over-come these limitations through the CoRGA program, which combines Cox regres-sion with a genetic algorithm for the variable selection process. CoRGA was used to try and identify the best combination of risk factors for 4-year all-cause mor-tality. The combination of 10 risk factors identified by CoRGA included both known and new risk factors for mortality in older people. Further research is seeking to develop the program further and to identify further risk factors for all-cause mortality in older people.
Keywords
Cox regression, genetic algorithm, mortality, risk factors, software package
Introduction
The increase in the population of older people in developed countries has created chal-lenges for health policy makers, service managers and planners, as well as healthcare professionals [1]. Associated with the increase in the numbers and proportions of older people is an increase in the levels of disability among people of advanced age, and a need for improvements in health and social care services used by them. To provide a better
Copyright © 2004 SAGE Publications (London, Thousand Oaks, CA and New Delhi) Vol 10(3): 221–236 [1460-4582(200409)10:3;221–236; DOI: 10.1177/1460458204042236] www.sagepublications.com
understanding of the levels of poor health and disability among older people, research on health outcomes has sought to describe the epidemiology of specific causes of illness and disability, e.g. falls, stroke, cardiovascular disease. The identification of risk factors for all-cause mortality in older people has also attracted much interest in longitudinal studies of older people, because of the information it provides about the health and wellbeing of the population of older people.
Research over the last few decades has revealed a variety of risk factors for mortality among older people, e.g. from health, medical and social science perspectives [24]. Previous research on all-cause mortality has applied conventional statistical techniques, e.g. regression analyses, for identifying risk factors from data gathered in longitudinal studies of older people. However, common traditional statistical software packages, e.g. SPSS Statistical Package for the Social Sciences and SAS, do not provide random selec-tion procedures, and only those data and variables that are selected by the researchers themselves are considered for inclusion as independent variables in regression models. This means that very limited combinations of risk factors can be considered and import-ant variables and potential risk factors may be overlooked or ignored. Variables that are not selected for inclusion in models may be better predictors of all-cause mortality. Therefore, the development of techniques that permit all variables to be considered for inclusion within the Cox proportional hazard models, and from these to be selected those variables that form the best combination for predicting mortality, may confirm current risk factors as being important predictors of mortality. However, it may also identify previously unknown, or unsuspected, risk factors, and enhance our understanding of the mediators of mortality among older people. This article describes a study that is developing a new approach called CoRGA (Cox regression and genetic algorithm) to select the best combi-nation of risk factors for mortality in older people.
The article contains several sections describing the overall research on CoRGA and how this research has been conducted. The methods section describes the principles of Cox regression and genetic algorithms, and how these have been combined to analyse data from the Nottingham Longitudinal Study of Activity and Ageing. Early results using CoRGA are described, together with their validation using the SPSS. The article concludes with a discussion on the potential of CoRGA for analysing risk factors for all-cause mortal-ity and future directions in this research.
Methods
Survival analyses are used for analysing risk factors for an event occurring over a period of time within a population or group of interest [5, 6]. The word ‘survival’ suggests that the event of interest could be the death (or not) of the individual, but in reality it could be any event, e.g. myocardial infarction or fall. Thus ‘survival’ refers to the length of time the person ‘survives’ before the occurrence of the event, death or otherwise. This study employs one specific method of survival analysis, Cox proportional hazards regression.
Cox proportional hazards regression
regression is important in that the dependent variable consists of a binary attribute which indicates whetherthe event of interest actually occurred, and a secondary attribute that indicates the timeto when the event of interest occurred. Therefore, if the outcome or event of interest is mortality, Cox regression not only takes into account whether the individual has died, but also considers the length of time until the person died. Cox regression uses this information to assess the importance, or statistical significance, of the independent variables as potential risk factors for the event of interest, which in this study is death.
Cox proportional hazards regression is derived from logistic regression that was developed for regressing dichotomous, or binary, outcomes. The basic logistic regression function is a transformation of outcome in linear regression. The general equation for linear regression is as follows:
y= c m1x1m2x2m3x3 . . . mnxn (1) in which the outcome variable is a continuous variable y associated with independent variables xi, where i = 1 . . . n. The degree of relationship between each of the inde-pendent variables xand the outcome yis shown by variable m. Variable mis calculated using the least squares method described elsewhere [5]. Parameter cis a constant for the equation, indicating the intercept on the y-axis for the graph of yagainst x.
When the outcome variable is binary, yis transformed using a logit calculation as follows:
log (y) = 01x12x2. . . nxn (2) Here log (y) is equal to the probability of either the presence or the absence of y. The logit of y can also be expressed as follows. Here variable pis defined as the probability of y= 1, and 1 pas the probability of y= 0.
p –––––
logit (p) = loge
1p (3)When the proportion pis 0, the log odds are minus infinity, and when the proportion pis 1, the log odds are plus infinity.
Regression models for the log odds can be fitted using a regression equation similar to that used for linear regression [9]:
p –––––
loge
1p= b0b1x1b2x2. . . bmxm (4)where pis the proportion to be predicted and x1,x2etc. are the independent or
predic-tor variables.
In the Cox proportional hazards regression, the function incorporates the additional time parameter. Thus algebraically equation (2) can be represented as follows:
y = expxh
0(t) (5)
The hazard function h0(t) gives time to death for the sample population. To obtain the
relationship between y, x and h0(t), Cox [7] introduced the maximum partial likelihood
In order to measure model adequacy, the minus twice log-likelihood ratio test is used. The smaller the value of the minus twice log-likelihood ratio for a given set of independent variables, the better is the model [8]. Additionally, Akaike proposed Akaike’s information criterion (AIC) for selecting the best model based on the minus twice log-likelihood value (further details in [10]). The model that reduces the AIC is considered a better model.
Variable section techniques for regression models
Traditionally, the Cox regression function has applied the same selection procedure as in linear and logistic regression. The stepwise selection procedure is a common technique for selecting variables to be fitted into the Cox model. This method has been applied in most studies of mortality in older people. The complete description of stepwise selection is available in Hosmer and Lemeshow [11]. The research described in this article did not apply the stepwise selection procedure as a selection technique for the Cox proportional hazard model. However, using the AIC and minus two log-likelihood values, the CoRGA model was developed to undertake a genetic search to develop a model containing the best predictors of mortality.
Genetic algorithms
Evolutionary computational tools such as genetic algorithms (GAs) have been developed as methods of searching through the high-dimensional space of possible solutions to find an optimal solution for a given problem [12] and have recently been used to tackle such problems in health and medical research [6, 13]. They are particularly suited for use in data mining in health and medical research, where there is a preponderance of variables and multivariate relationships. Genetic algorithms were developed by Holland in the 1960s as a random selection scheme inspired by biological evolution and are described in full detail elsewhere [12, 14, 15]. GAs have been applied in health and medical related research for diagnosis, prognosis, imaging, signals, planning and scheduling [13]. They have been used as variable selection tools for predicting health outcomes in combination with artificial neural networks [16, 18]. In addition, several studies have been identified that used GAs in combination with statistical techniques, e.g. linear and logistic regres-sion, for variable selection [19, 21]. However, no study has applied GA in combination with Cox regression for survival analysis.
In general, the genetic algorithm increases the size of the search space within a data set first by initiating a random potential solution coded in artificial genes on a series of chromosomes. This initial population is generated at random or using heuristics [13]. The attributes of each individual, in this study the independent variables, are encoded via genes on a chromosome. Each chromosome has a fitness function associated with it, and this measures its suitability to the problem situation being investigated, in this case the relationship with the dependent variable.
Once a full set of fitness values has been calculated, the genetic operator will play a role in the reproduction process. In genetic algorithms, selection, recombination and mutation are considered as reproduction operators to enlarge the dimensionality of the search space.
independent variables. In order to avoid premature convergence, GA provides mutation for the existing chromosomes, which introduces random changes into the genotypes of the chromosomes.
These offspring join the population and each has a fitness function associated with its genotype. Each individual has its fitness evaluated by decoding the genotype, in this case the strength of the relationship between the independent variables and the outcome variable. The value of this fitness function is used to determine whether that chromosome survives the next generation to reproduce and pass on its genetic material. Over a number of generations the population should adapt to the environment, and an optimal solution should emerge, in this case a Cox regression model with an optimal combination of risk factors.
GAs can be applied in several ways, i.e. genetic algorithms with or without elitism and steady-state GAs with or without an elitist strategy. A complete description of both methods is available in [14, 22]. In this research a steady-state GA with an elitist strategy was employed. The steady-state GAs, sometimes called incremental GAs, permit only a few of the least fit chromosomes to be replaced by genetic operators. This can be done using a fraction procedure called a generation gap. In order to increase the number of individuals for future generations, the proportion of the fraction can be expanded. It is useful to set that only successors for the current generation will be inserted for repro-duction. This term is referred to as elitism [22].
The termination process of the GA depends on the number of generations set by the user. An increased number of generations can add to the number of search spaces. However, if the number of chromosomes is small, GAs may reach premature convergence. The best solution is evolved at the final generation.
Cox regression and genetic algorithm (CoRGA)
The aim of the research described here was to use a GA combined with Cox regression to develop a model that permitted all variables to be considered for insertion into the Cox regression model. The Cox function built using Matlab is able to regress survival data and produce statistical descriptors, i.e. coefficient value, standard error, hazard ratio, 95 per cent confidence interval, minus twice log-likelihood and AIC value as described earlier. In combination with the GA, the minus twice log-likelihood and the AIC have been used as the fitness measurement for each chromosome.
In this study, the genes were represented as integers. The integer genotypes allow all variables to be included for consideration in each hazard model. Different sizes of chromo-somes permit different numbers of variables to be used in combinations. Increasing the number of chromosomes in the initial population will increase the potential combination of variables to be analysed. The chromosomes were coded in integers with length l and with number qof chromosomes in the initial population. The assumed number of vari-ables was p. Thus the maximum number of combinations or hazard models Hrandomly created without duplicating variables was given by the following equation for Il.If l is set to 1, the maximum number of hazard models is equal to the number of variables p.
H= plp (6)
The genotype represented the variables index in the data set. The initial chromosomes were decoded into actual variables before entering the Cox regression model. The Cox proportional hazard function computed the AIC from the number of chromosomes H, which represented Hhazard models. The complete array containing the AIC was used for evaluation of the ranking function.
The complete set of fitness functions included the ranking parameter to be used by the selection operator to choose the best potential parents for the intermediate gener-ation. The ranking function assigned artificial weight to each chromosome for future sampling. The fittest AIC will get the highest ranking and is ready to be selected. A stochastic universal sampling selection scheme was applied to reduce bias. The gener-ation gap was set to 1.0, which means that populgener-ations of equal numbers appear at each generation. The selected chromosomes were sent for crossover operation. The new offspring were produced through performing multipoint crossover. Figure 1 shows how selection of the chromosomes is achieved in CoRGA.
Once the chromosomes have been selected, they undergo crossover as shown in Figure 2.
Figure 3 shows how mutation is undertaken in CoRGA. A mutation probability of 0.01 was used. By the random insertion of new genetic material (i.e. new variables), the mutation process can restructure the hazard model to increase the search space that is being explored and prevent premature and suboptimal convergence.
The new offspring from the crossover and mutation processes are re-evaluated using Cox regression to determine a fitness function, the AIC value. The best chromosomes (combinations of variables) are retained in the current generation, and are reinserted into the gene pool to maintain the population size. In order to reduce bias, previously un-selected chromosomes from the initial population are mixed with the fittest model in the current generation to open a new dimension of search space in the succeeding generation.
Figure 1 Selection of chromosomes in CoRGA. Four chromosomes (Ch) are shown, together with the genes (independent variables) that they contain and the AIC value. A fitness rank is then associated with each chromosome, based on the AIC value, and the chromosomes with the highest fitness rank are selected for crossover
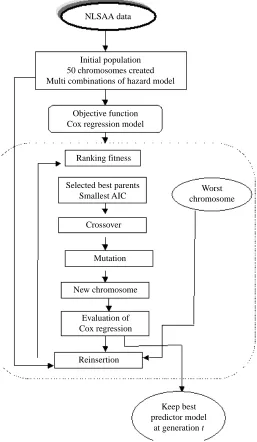
The reinsertion function in Matlab provides steady-state GAs with an elitist strategy. In this research, the generation gap was set to 1.0 and 90 per cent of the population was replaced by the fittest chromosomes. Therefore only about 10 per cent of unselected chromosomes were inserted into each succeeding generation. Figure 4 shows the overall process of CoRGA.
Use of CoRGA
A series of seven CoRGA experiments was conducted using data from the Nottingham Longitudinal Study of Activity and Ageing (NLSAA) in which the number n of genes (variables) in each chromosome was varied to identify the best combinations of nvariables Figure 2 Crossover of the selected chromosomes. Crossover is seen to be taking place at two points on each chromosome: between genes 2 and 75 and genes 75 and 81 on parent chromosome 2, and between genes 34 and 45 and genes 45 and 5 on parent chromosome 3
Ch2
34 75 5 22
Ch3
2 45 81 294
Selected parents
New offspring
Ch2
2 75 81 294
Ch3
34 45 5 22
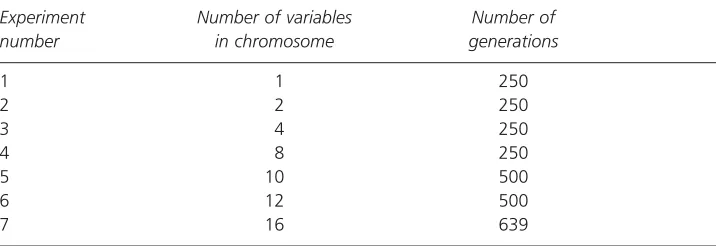
for n= 1, 2, 4, 8, 10, 12, 16. The number of generations that was set for each experiment was based on the size of chromosomes, i.e. the greater the number of genes, the longer the program took to reach convergence. Initial experiments were used to establish the approximate number of generations required to ensure convergence occurred and to avoid premature convergence. Table 1 shows the features of the experiments conducted in this research.
Figure 4 The overall process of CoRGA
Initial population 50 chromosomes created Multi combinations of hazard model
Objective function Cox regression model
Ranking fitness
Selected best parents Smallest AIC
New chromosome
Reinsertion Evaluation of Cox regression
Mutation Crossover
Worst chromosome
Keep best predictor model
Data were derived from the NLSAA. This is an ongoing survey of activity, health and wellbeing conducted within a representative sample of 1299 community-dwelling people originally aged 65 and over, of whom 1042 (406 men; 636 women) agreed to participate (response rate = 80 per cent). The baseline survey was conducted between May and September 1985, and information on mortality within the sample was provided by the UK National Health Service Central Register, where all UK deaths are recorded and which supplied copies of all the death certificates as they accrued. Interview data collected from respondents included information on cognition, physical health, psychological wellbeing, perceptions of health and wellbeing, and customary physical activity, and are described in detail elsewhere [23]. The actual data consist of four main types of variables, i.e. continuous, nominal, ordinal and logical (binary). However, CoRGA only supports continu-ous and logical data sets, so that nominal and ordinal variables were transformed into binary variables. CoRGA provides facilities to deal with missing values for individuals, by removing all cases containing missing values for the variables included in the Cox regres-sion models, in a manner similar to SPSS. Following transformation of the variables, 460 variables were available for analyses using CoRGA. CoRGA was used to identify the best combinations of risk factors for predicting 4-year mortality, i.e. mortality to 30 April 1989. Once the combination of each set of variables had been established, these variables were entered into a Cox regression model within SPSS to determine the hazard ratios, 95 per cent confidence intervals and p-values associated with each variable and category.
The overall results for the seven sets of experiments are described here, with a detailed discussion of the combination of risk factors identified in the experiment to determine the optimal combination of 10 risk factors for mortality.
Results
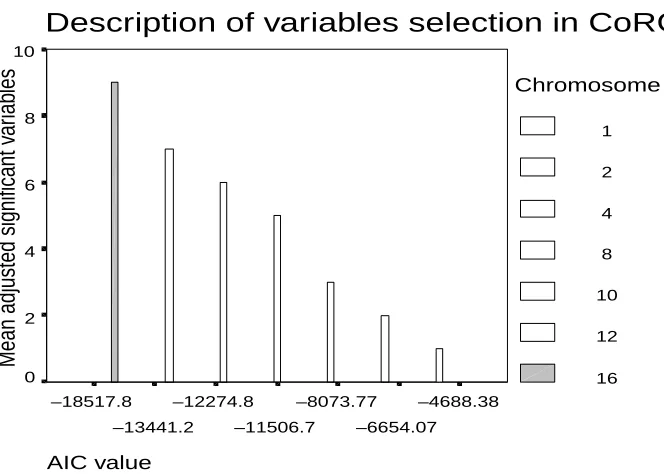
CoRGA developed models containing combinations of 1, 2, 4, 8, 10, 12, 16 risk factors for 4-year mortality. Figure 5 shows the AIC values for the final combination of risk factors for each chromosome size, according to the size of the chromosome. The highest AIC value (i.e. least negative) was computed for the model containing a single chromosome, and the lowest AIC value was obtained for the model containing 16 variables in the chromosomes. Table 1 CoRGA Experimental Features showing the number of genes in the chromosomes and the number of generations required to reach convergence
Experiment Number of variables Number of number in chromosome generations
1 1 250
2 2 250
3 4 250
4 8 250
5 10 500
6 12 500
The results for the model containing 10 genes are described in detail here. Several experiments needed to be re-executed because of certain failures, i.e. premature conver-gence and non-converconver-gence. However, further details and the results for other experiments are described elsewhere [24].
Results for 10 genes
CoRGAs successfully identified 10 variables in the final hazard model obtained after 500 generations. The AIC value for this final model was –12,274.75 (see Figure 5), and 920 cases (individuals) were included in the model once individuals with missing values for those variables were excluded. The variables that were selected by CoRGA were (in no particular order):
● period of time since separation from spouse or bereavement
● ability to raise £200 in an emergency
● number of cigarettes smoked daily
● whether employed or not
● possesses a television or radio or not ● reported age in years
● perceived activity relative to other people of the same age
● time since visited the dentist
Figure 5 Graph of AIC value in converged models according to the number of genes (variables) in the model
Description of variables selection in CoRGA
AIC value
–4688.38
–6654.07 –8073.77
–11506.7 –12274.8
–13441.2 –18517.8
Mean adjusted significant v
ar
iab
les
10
8
6
4
2
0
Chromosome size
1
2
4
8
10
12
● walks out alone or never walks out alone
● whether joint pain or stiffness causes difficulty in walking.
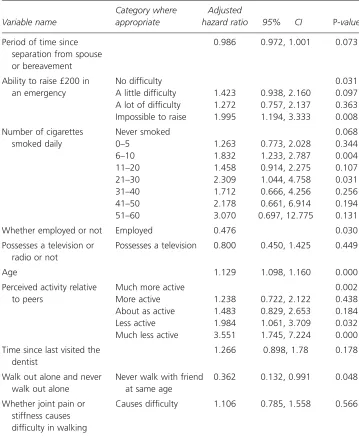
Table 2 shows the adjusted hazard ratios, 95 per cent confidence intervals (CIs) and p-values for each variable and category when all the variables were included in the Cox regression model in SPSS. It can be seen from Table 2 that, in this adjusted model, the
Table 2 Adjusted model for combination of 10 risk factors evolved by CoRGA determined using SPSS
Category where Adjusted
Variable name appropriate hazard ratio 95% CI P-value
Period of time since 0.986 0.972, 1.001 0.073
separation from spouse or bereavement
Ability to raise £200 in No difficulty 0.031
an emergency A little difficulty 1.423 0.938, 2.160 0.097 A lot of difficulty 1.272 0.757, 2.137 0.363 Impossible to raise 1.995 1.194, 3.333 0.008
Number of cigarettes Never smoked 0.068
smoked daily 0–5 1.263 0.773, 2.028 0.344
6–10 1.832 1.233, 2.787 0.004
11–20 1.458 0.914, 2.275 0.107
21–30 2.309 1.044, 4.758 0.031
31–40 1.712 0.666, 4.256 0.256
41–50 2.178 0.661, 6.914 0.194
51–60 3.070 0.697, 12.775 0.131
Whether employed or not Employed 0.476 0.030
Possesses a television or Possesses a television 0.800 0.450, 1.425 0.449 radio or not
Age 1.129 1.098, 1.160 0.000
Perceived activity relative Much more active 0.002
to peers More active 1.238 0.722, 2.122 0.438
About as active 1.483 0.829, 2.653 0.184 Less active 1.984 1.061, 3.709 0.032 Much less active 3.551 1.745, 7.224 0.000
Time since last visited the 1.266 0.898, 1.78 0.178 dentist
Walk out alone and never Never walk with friend 0.362 0.132, 0.991 0.048 walk out alone at same age
Whether joint pain or Causes difficulty 1.106 0.785, 1.558 0.566 stiffness causes
ability to raise £200 in an emergency (p = 0.031), being employed or not (p = 0.030), age (p 0.001), perceived activity (p = 0.002), and whether a person walks out alone or not (p = 0.048), were all significant predictors of 4 year mortality, independent of the other variables in the model.
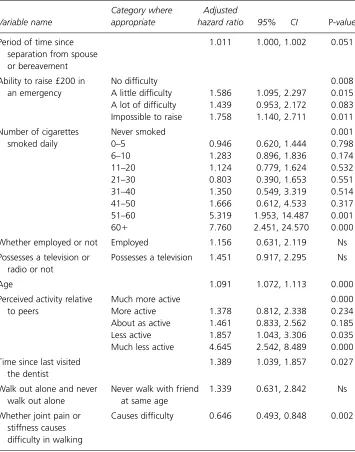
Table 3 shows the unadjusted hazard ratios, 95 per cent CIs and p-values for each variable and category when the variables were included in separate Cox regression models
Table 3 Unadjusted model for combination of 10 risk factors evolved by CoRGA determined using SPSS. Variables entered into separate models. Ns = non-significant
Category where Adjusted
Variable name appropriate hazard ratio 95% CI P-value
Period of time since 1.011 1.000, 1.002 0.051
separation from spouse or bereavement
Ability to raise £200 in No difficulty 0.008
an emergency A little difficulty 1.586 1.095, 2.297 0.015
A lot of difficulty 1.439 0.953, 2.172 0.083 Impossible to raise 1.758 1.140, 2.711 0.011
Number of cigarettes Never smoked 0.001
smoked daily 0–5 0.946 0.620, 1.444 0.798
6–10 1.283 0.896, 1.836 0.174
11–20 1.124 0.779, 1.624 0.532
21–30 0.803 0.390, 1.653 0.551
31–40 1.350 0.549, 3.319 0.514
41–50 1.666 0.612, 4.533 0.317
51–60 5.319 1.953, 14.487 0.001
60 7.760 2.451, 24.570 0.000
Whether employed or not Employed 1.156 0.631, 2.119 Ns
Possesses a television or Possesses a television 1.451 0.917, 2.295 Ns radio or not
Age 1.091 1.072, 1.113 0.000
Perceived activity relative Much more active 0.000
to peers More active 1.378 0.812, 2.338 0.234
About as active 1.461 0.833, 2.562 0.185
Less active 1.857 1.043, 3.306 0.035
Much less active 4.645 2.542, 8.489 0.000
Time since last visited 1.389 1.039, 1.857 0.027
the dentist
Walk out alone and never Never walk with friend 1.339 0.631, 2.842 Ns
walk out alone at same age
Whether joint pain or Causes difficulty 0.646 0.493, 0.848 0.002 stiffness causes
in SPSS. It can be seen from Table 3 that in the unadjusted models, the length of time since separation from spouse or bereavement (p = 0.051), the ability to raise £200 in an emergency (p = 0.008), the amount of cigarettes smoked daily (p = 0.001), age (p0.001), perceived activity (p 0.001) and whether joint stiffness causes difficulty walking (p = 0.002), were all significant predictors of 4-year mortality.
Discussion
A large amount of research has been conducted to identify risk factors for all-cause mortality in older people [2, 25, 27]. However, this body of research has been limited by both the number and selection of variables included in hazard models. In this study we have attempted to overcome these limitations by developing a selection procedure for the Cox proportional hazards regression model that is inspired by the evolutionary theory of natural selection.
The CoRGA program was used to analyse interview and mortality data for older people living in Nottingham. The variables selected in the final model for 10 variables included known risk factors for mortality, e.g. age and smoking, in the general population, not just among older people. Age has long been regarded as an important predictor of mortality, and its importance has been confirmed here, as it was highly significant in both adjusted and unadjusted models. In addition CoRGA identified a number of variables, e.g. the ability to raise £200 in an emergency, employment status, time since visited the dentist, joint pain restricting ambulatory activity, and general walking activity, which may be acting as proxy for previously implicated variables such as socio-economic circumstances, poor health and general frailty.
What is particularly interesting about the results generated by CoRGA is that risk factors were identified that were not apparent from the research literature, i.e. perceived level of activity, time since bereavement/separation. Although perceived health (some-times called self-rated health) has been identified as an independent risk factor for mortality [28, 29], to our knowledge how people perceive their activity relative to that of their peers has previously not been reported as a risk factor. The time that a person has been bereaved or separated has not previously been identified as a risk factor, and may be due to loneliness or additional risks associated with living alone [30]. CoRGA also identified possession of a radio or television as a predictor of mortality, which has not previously been reported as a risk factor, and may be acting as a proxy for depression or loneliness, or for lack of social engagement with the world. The importance of these risk factors will be subject to further research to gain a deeper understanding of their effect on mortality.
here. In this research, we are not so much trying to find the perfect combination of risk factors for mortality; rather we seek to develop our understanding of risk factors through consideration of all possible variables.
When comparing CoRGA with other intelligent analysis methods, CoRGA is able to produce a mortality (hazard) ratio with confidence intervals, which provides useful infor-mation for healthcare professionals and planners. In contrast, neural networks make predictions on individuals in the data set and then compare the results with the observed outcome, in order to develop a measure of the accuracy of the predictive models. Although this may be useful in developing prognostic models [6], it provides no infor-mation on the importance of the variables used to make the predictions. CoRGA, on the other hand, produces numerical values similar to those provided by statistical models to provide researchers with information on the relative importance of predictor variables. In addition, most non-statistical analysis tools, e.g. neural networks and recursive partition-ing, analyse survival data using binary variables only and do not include the time to the event occurring [31, 32]. The data analyses, and therefore the results, are less precise.
Using a GA approach to variable selection in CoRGA meant that a much larger set of variables could be considered for inclusion in the Cox regression than has previously been possible. Using mutation, the random genetic selection component in CoRGA helped to increase the dimensionality of space that could be searched within the data sets. These two features in CoRGA enabled new combinations of potential risk factors for all-cause mortality to be considered in Cox regression models.
A further novel aspect of the use of CoRGA was representing the genes and genotype using integer rather than binary values. This allowed each variable to be included within a model. Previous studies combining logistic regression and GAs have represented the genotype in a binary mode, which meant that not all variables were included in the logistic regression model [20, 21].
CoRGA also provides facilities for dealing with missing values. All cases containing missing values for each combination of variables (genotype) generated by the GA are removed from the Cox regression model. This mean that data sets containing missing values can be analysed using CoRGA, which means that it will be possible to use CoRGA on large data sets, and therefore a greater number of data sets. However, the disadvan-tage of this approach is that the different Cox regression models contained different numbers of cases, and that the greater the number of variables included in models (i.e. the larger the genotype or number of genes in each chromosome), the higher the number of cases that would be removed. The problem of dealing with missing values is not unique to this study and there is currently no completely satisfactory method of dealing with it. The ideal situation is to have no missing data. This may be feasible in small-scale studies in which the data collection is very tightly controlled, e.g. clinical settings, but in large-scale epidemiological studies such as the NLSAA it is almost inevitable that data will be missing. Another possible solution is to replace missing values with a suitable value derived from the variable in the sample, e.g. the mean or mode, but this method is not without limitations. We aim to conduct further research to investigate alternative methods of overcoming the problem of missing data. Further research will also use the CoRGA program to identify risk factors for mortality over different time periods and will examine in greater detail the importance of the risk factors identified here.
as long as data are available not only on whether the event occurs but on the timing of the event. Such applications would have uses in health services research, public health and epidemiology.
Conclusions
The combination of Cox regression with a genetic algorithm increased the dimensional-ity of the search space and allowed all variables to be considered for inclusion in the models for identifying risk factors for all-cause mortality. This research has introduced the use of artificial genetic searches into survival analysis and has revealed useful information on older people for public health and health service planning. The study confirmed known risk factors for mortality in older people and also identified new risk factors.
Acknowledgements
This research was undertaken through a studentship fully funded by the government of Malaysia. We are grateful for the technical support provided by Professor Peter Fleming, Department of Automatic Control and Systems Engineering, University of Sheffield in the use of the genetic algorithm in Matlab.
References
1Grundy E. Progress report: demography and gerontology: mortality trends among the oldest old.
Ageing and the Society1997; 17; 71325.
2Bassuk S S, Wypij D, Berkman L F. Cognitive impairment and mortality in the community-dwelling elderly. American Journal of Epidemiology2000; 151; 67687.
3Fried L P, Kronmal R A, Newman A B. 21 of 27 variables predicted mortality in older adults. Journal of the American Medical Association (JAMA) 1998; 279: 58592.
4Oman D, Reed D. Religion and mortality among community-dwelling elderly. American Journal of Public Health1998; 88(10); 146975.
5Altman D G. Practical Statistics for Medical Research.London: Chapman and Hall/CRC, 1991.
6Bath P A. Data mining in health and medical information. In Cronin B ed. Annual Review of Information Science and Technologyvol. 38. In press.
7Cox D R. Regression models and life tables. Journal of the Royal Statistical Society Series B (Methodological)1972; 34(2); 187220.
8Collet D. Modelling Survival Data in Medical Research. London: Chapman and Hall/CRC, 1994.
9Bland M. An Introduction to Medical Statistics321. Oxford: Oxford University Press, 1995.
10Akaike H. A new look at the statistical model identification. IEEE Transactions on Automatic Control
1974; 19; 71623.
11Hosmer D W, Lemeshow S. Applied Survival Analysis: Regression Modeling of Time to Event Data. New York: Wiley, 1999.
12Goldberg D E. Genetic Algorithms in Search, Optimization and Machine Learning. Reading, MA: Addison-Wesley, 1989.
13Peña-Rayes C A, Sipper M. Evolutionary Computation in Medicine: An Overview. Amsterdam: Elsevier, 1999.
14Withley D. A genetic algorithm tutorial. In Computer Science Technical Report. Colorado State University, 1993.
15Mitchell T M. Machine Learning. New York: McGraw-Hill, 1997.
17Jefferson M F, Pendleton N, Lucas C P, Lucas S B, Horan M A. Evolution of artificial neural network architecture: prediction of depression after mania. Methods of Information in Medicine1998; 37; 220–5.
18Bath P A, Pendleton N, Morgan K, Clague J E, Horan M A, Lucas S B. New approach to risk determination: development of risk profile for new falls among community-dwelling older people by use of genetic algorithm neural network (GANN). Journal of Gerontology: Medical Science2000;
55A(1); 17–21.
19Wallet B C, Marchette D J, Solka J L, Wegman E J. A genetic algorithm for best subset selection in linear regression. In Proceedings of the 28th Symposium on the Interface, 1996. 1999.
20Vinterbo S, Ohno-Machado L. A genetic algorithm to select variables in logistic regression: example in the domain of myocardial infarction. Journal of the American Medical Informatics Association
1999; 984–8.
21Stacey A, Kildea D. Genetic algorithm search for large logistic regression models with significant variables. In Proceedings of the 22nd International Conference on Information Technology Interfaces, ITI, Pula, Croatia, 2000.
22Colley D A. An Introduction to Genetic Algorithms for Scientists and Engineers. London: World Scientific Publishing, 1999.
23Morgan K. The Nottingham Longitudinal Study of Activity and Ageing: a methodological overview.
Age and Ageing1998; 27; 511.
24Ahmad R. PhD thesis, in preparation.
25Dyer A R, Stamler J, Greenland P. Association of weight change and weight variability with cardiovascular and all cause mortality. Chicago Western Electric Company Study2000; 177(4); 324–33.
26Korten A E, Jorm A F, Leteneur L, Jacomb P A, Henderson A S, Christensen R B. Health cognitive and psychological factors as predictors of mortality in an elderly community sample. Journal of
Epidemiology and Community Health 1999; 53; 838.
27Ho S C, Woo J, Sham A. Risk factor change in older persons. A perspective from Hong Kong: weight change and mortality. American Journal of Epidemiology1994; 150; 978–86.
28Idler E L, Benyamini Y. Self-rated health and mortality: a review of twenty-seven community studies.
Journal of Health Social Behaviour1997; 3; 21–37.
29Benyamini Y, Idler E L. Community studies reporting association between self-rated health and mortality. Research on Ageing1999; 21(3); 392–401.
30Bath P A. Social isolation and mortality: gender differences in loneliness and living alone.
Gerontologist2000; 40(special issue 1); 578.
31Carmelli D, Swan G E. The relationship of type behaviour and its components to all-cause mortality in an elderly subgroup of men from the Western Collaborative Group Study. Journal of
Psychosomatic Research1995; 40(12); 475–83.
32Xiang A, Lapuerta P, Ryutov A, Buckley J, Azen S. Comparison of the performance of neural network methods and Cox regression for censored data. Computational Statistics and Data Analysis2000;
34; 243–57.
Correspondence to:Rabiah Ahmad
Rabiah Ahmad
Health Informatics Research Group, Department of Information Studies, University of Sheffield, Western Bank, Sheffield S10 2TN, UK
Email: [email protected]
Peter A. Bath