ABSTRACT
LUISO, SALVATORE. Co/Fe-doped MoS2 Nanoparticles on Carbon Support as a Catalyst for Hydrogen Evolution Reaction. (Under the direction of Dr. Peter S. Fedkiw).
The challenge to replace fossil fuel with clean and renewable energies has led the scientific community to research alternative sources of energy. Because of the low-environmental impact and high-specific energy of hydrogen, interest in sustainable ways of producing it has increased. Water electrolysis is the best method to generate high-purity hydrogen without pollutants, but it is an energy-intensive route. The existing platinum (Pt) catalysts are highly efficient, but the cost and rarity of Pt limits its use. Therefore, seeking high-efficient and cost-effective catalyst for mass production of hydrogen is critical to the utilization of hydrogen energy. In 2005, Nørskov et al. reported that molybdenum disulfide (MoS2) showed good activity for hydrogen evolution reaction (HER).
The work in this thesis aims to develop high-efficient molybdenum sulfide catalysts. Molybdenum trisulfide (MoS3) was synthesized from acidification of ammonium tetrathiomolybdate [(NH4)2MoS4] with the addition of sodium sulfide (Na2S∙9H2O) to the reaction mixture. The synthesis parameters such as carbon support, S:Mo atomic ratio, solvent (H2O, ethylene glycol (EG)), dopants (Co/Fe) and pH were systematically studied. The physical and chemical properties of the prepared catalysts were characterized by microscopy (SEM, TEM), x-ray spectroscopy (XPS), and elemental analysis and mapping (ICP, CHNS, STEM). The electrochemical activity toward HER was studied using voltammetry and impedance tests.
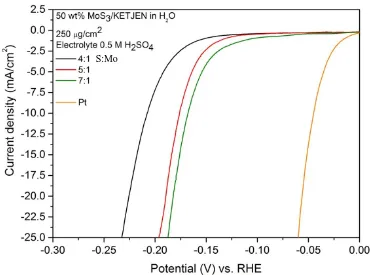
various S:Mo atomic ratios (4:1, 5:1, 7:1, 10:1) using H2O and EG as solvents. As a result, it was determined that 5:1 S:Mo ratio optimized the activity (-10 mA/cm2 at -166 mV), because MoS3 yield was increased yet the unbonded elemental sulfur was not enough to poison the catalyst. SEM and STEM showed that the dispersion of the elements (Mo, S, C) is uniform with Ketjenblack and Vulcan. In contrast to Vulcan and GNP supports, the composition of MoS3/Ketjenblack was unvaried from surface (XPS) to bulk (ICP, CHNS); elemental sulfur was absent on the surface and the catalysts were more active than MoS3/GNP (-10 mA/cm2 at -183 mV), making Ketjenblack a more suitable support for MoS3 nanoparticles. EG as a solvent improved the catalyst activity by allowing a better dispersion of carbon than H2O as a solvent and by increasing the reaction temperature to 165ºC, at which the thermal decomposition of (NH4)2MoS4 occurs. The low solubility of the latter both in H2O and EG was inferred by TEM images of the catalyst.
The best catalyst obtained from the previous section (MoS3/Ketjenblack 5:1 S:Mo ratio in EG) was chosen to study dopant (Co/Fe) effects. Co/Fe acetates corresponding to 2%-5%-10 wt.% of Co/Fe were added during the synthesis of MoS3. Although the final amount of dopants in the catalyst was significantly lower than expected (< 0.3 wt.%), the activity (-171/-184 mV at -10 mA/cm2) and STEM of doped catalysts provided an understanding of the role of dopants. The ineffective doping may be due to low temperature of the reaction and low solubility of (NH4)2MoS4.
the particle size decreased (1-2 nm) but also so did the yield to MoS3 (-8 wt.%); hence, the activity/catalyst mass improved (-169 mV at -10 mA/cm2).
Co/Fe-doped MoS
2Nanoparticles on Carbon Support as a Catalyst for
Hydrogen Evolution Reaction.
by Salvatore Luiso
A thesis submitted to the Graduate Faculty of North Carolina State University
in partial fulfillment of the requirements for the degree of
Master of Science
Chemical and Biomolecular Engineering
Raleigh, North Carolina 2015
APPROVED BY:
_______________________________ _______________________________ Saad A. Khan Stefano Menegatti
_______________________________ Peter S. Fedkiw
ii DEDICATION
Ad Angela
“Ti amo.
Non ho nessun pensiero che non sia tuo;
non ho nel sangue nessun desiderio che non sia per te.
Lo sai. Non vedo nella mia vita altra compagna, non vedo altra gioia.
Rimani.
Riposati. Non temere di nulla.
Dormi stanotte sul mio cuore…”
“I love you,
I don’t have any thoughts that are not yours;
I don’t have in my blood any desires that are not for you,
You know. I don’t see in my life any other partners, I don’t see any other joy.
Stay.
Have rest. Don’t fear anything.
Sleep on my hearth tonight…”
iii BIOGRAPHY
iv ACKNOWLEDGMENTS
I would like to gratefully and sincerely thank my advisor Dr. Peter S. Fedkiw for his guidance, understanding, patience, and most importantly, his friendship during my graduate studies at North Carolina State University. His mentorship was paramount in providing a well-rounded experience consistent my long-term career goals. He encouraged me to not only grow as an experimentalist and an engineer but also as an instructor and an independent thinker. I look forward to working with him in the years to come. Not all graduate students are given the opportunity to develop their own individuality and self-sufficiency by being allowed to work with such independence. For everything he has done for me I thank Dr. Saad Khan. He was my first contact in the department and he always helped me in so many different ways. I would also like to thank Dr. Stefano Menegatti, who was a pioneer to successfully continue his studies at NC State after the degree at University of Bologna. I thank Stefano for his advises and his necessary help.
A special thanks goes to professors Giulio Cesare Sarti and Valerio Cozzani, who allowed and suggested me to leave my country to gain experience and knowledge at NC State. Without them I would have never realized my American dream.
v I also would like to thank the administrative staff, Saundra, Shirley, and Angela. Special thanks to Sandra for having been my magic wand to solve all the problems and paperwork required. I couldn’t make it without her advices and help.
A big thank goes also to my lovely friends from the PhD program, Barbara, Ria and Russell, in memory of the days and nights we spent together, studying, enjoying life and sharing wonderful moments, which made my life in Raleigh as beautiful as at home.
A very warm thank is for Deborah and Robert, my American parents, who treated me as their son, and who helped, served and advised me in so many ways that I will never forget. Their love and their humanity opened my mind to a more beautiful world.
vi
TABLE OF CONTENTS
LIST OF TABLES ... x
LIST OF FIGURES ... xiii
CHAPTER 1: HYDROGEN PRODUCTION BY WATER ELECTROLYSIS THROUGH ADVANCED LOW-COST CATALYSTS ... 1
1.1 INTRODUCTION ... 1
1.1.1 Water electrolysis ... 2
1.1.2 MoS2 as an electrocatalyst for the HER ... 5
1.1.3 Amorphous, crystalline and clusters of Molybdenum sulfides ... 9
1.1.4 Doping MoSx with Fe, Co and Ni ... 10
1.1.5 MoS2 Nanoparticles grown on carbon materials ... 14
1.2 HYPOTHESIS ... 21
1.3 OPERATIONAL STATEMENT ... 21
1.4 REFERENCES ... 23
CHAPTER 2: EQUIPMENT AND EXPERIMENTS: NEW RECIPE FOR THE SOLVOTHERMAL SYNTHESIS OF MOS3 NANOPARTICLES ... 29
2.1 OLD PROCEDURE ... 29
2.1.1 The reactants ... 29
2.1.2 The synthesis ... 30
2.1.3 The ink ... 33
vii
2.2 VARIATIONS TO THE OLD PROCEDURE ... 35
2.2.1 Reactants ... 35
2.2.2 Solvents ... 37
2.3 ELECTROCHEMICAL TESTS ... 39
2.3.1 iR compensation ... 40
2.4 ORGANIZATION OF EXPERIMENTS ... 41
2.5 DATA PROCESSING ... 44
2.6 PHYSICAL CHARACTERIZATION ... 45
2.7 REFERENCES ... 47
CHAPTER 3: RESULTS AND DISCUSSION ... 49
3.1 EFFECTS OF CARBON SUPPORTS, SOLVENTS AND INITIAL COMPOSITIONS ON MOS3 CATALYSTS FOR HYDROGEN EVOLUTION REACTION ... 49
3.1.1 Electrochemical results: GNP support at different S:Mo ratio in water ... 50
3.1.2 Thermogravimetric analysis results ... 67
3.1.3 Electrochemical results: GNP support at different S:Mo ratio in ethylene glycol ... 71
3.1.4 ... Electrochemical results: KETJENBLACK support at different S:Mo ratio in water ... 76
3.1.5 Electrochemical results: KETJENBLACK support at different S:Mo ratio in ethylene glycol ... 87
viii
3.1.7 ... Electrochemical results: VULCAN support at different S:Mo ratio in ethylene
glycol ... 105
3.1.8 Loading effect: GNP, KETJENBLACK and VULCAN supports ... 111
3.1.9 Material characterization: GNP, KETJENBLACK and VULCAN supports ... 115
3.1.10 Discussion ... 125
3.2 EFFECTS OF IRON AND COBALT AS DOPANTS FOR MOS3/KETJENBLACK .. ... 130
3.2.1 Electrochemical results: Co-doped MoS3/Ketjenblack ... 131
3.2.2 Materials characterization: Co-doped MoS3/Ketjenblack ... 136
3.2.3 Electrochemical results: Fe-doped MoS3/Ketjenblack ... 140
3.2.4 Materials characterization: Fe-doped MoS3/Ketjenblack ... 146
3.2.5 Discussion ... 150
3.3 DIMETHYLFORMAMIDE AS A SOLVENT FOR MOS3/KETJENBLACK ... 154
3.3.1 Electrochemical results ... 155
3.3.2 Materials characterization ... 159
3.3.3 Discussion ... 162
3.4 SODIUM HYDROXIDE: THE KEY COMPOUND FOR THE DISSOLUTION OF (NH4)2MOS4 ... 164
3.4.1 Electrochemical results ... 165
3.4.2 Materials characterization ... 169
3.4.3 Discussion ... 173
ix
CHAPTER 4: CONCLUSIONS ... 181
4.1 EFFECT OF S:MO RATIO ... 182
4.2 EFFECT OF CARBON SUPPORT ... 184
4.3 EFFECT OF DOPANTS... 185
4.4 CHANGE IN THE CATALYST SYNTHESIS CONDITION: SOLVENT AND MO-PRECURSOR ... 187
4.5 REFERENCES ... 190
CHAPTER 5: FUTURE WORK ... 192
APPENDICES ... 195
Appendix A – CHN/S Analysis ... 196
x
LIST OF TABLES
Tab. 1.1 Summary of relevant studies on the MoS2 as a catalyst for the hydrogen evolution reaction. ... 18
Tab. 2.1 Carbons surface area. ... 37
Tab. 2.2 Characteristics of water and ethylene glycol in the synthesis of MoS3. ... 38 Tab. 3.1 Matrix of the first series of experiments to synthesize MoS3 on a carbon support and at different S:Mo ratio. ... 49
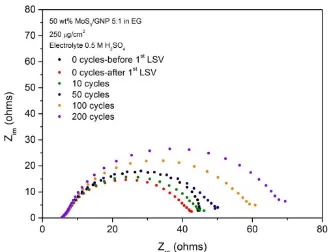
Tab. 3.2 Summary of results for MoS3/GNP, S:Mo = 4:1 after 0 (before and after the 1st LSV),10,50,100,200 cycles of CV stability tests. ... 53
Tab. 3.3 Summary of results for MoS3/GNP, S:Mo = 5:1 after 0 (before and after the 1st LSV),10,50,100,200 cycles of CV stability tests. ... 57
Tab. 3.4 Summary of results for MoS3/GNP, S:Mo = 7:1 after 0 (before and after the 1st LSV),10,50,100,200 cycles of CV stability tests. ... 61
Tab. 3.5 Summary of results for MoS3/GNP, S:Mo = 10:1 after 0 (before and after the 1st LSV),10,50,100,200 cycles of CV stability tests. ... 64
Tab. 3.6 Summary data of real weight percentage of C, H, N, S, Mo, S:Mo ratio, charge-transfer resistance, capacitance per unit area, Tafel slope, exchange current, potential at -10 mA/cm2 for MoS3/GNP, S:Mo = 4/5/7/10:1 after 0 cycles of CV stability tests. ... 66
Tab. 3.7 Summary of results for MoS3/GNP, S:Mo = 4:1 in EG after 0 (before and after the 1st LSV),10,50,100,200 cycles of CV stability tests. ... 72
Tab. 3.8 Summary of results for MoS3/GNP, S:Mo = 5:1 in ethylene glycol after 0 (before and after the 1st LSV),10,50,100,200 cycles of CV stability tests. ... 75
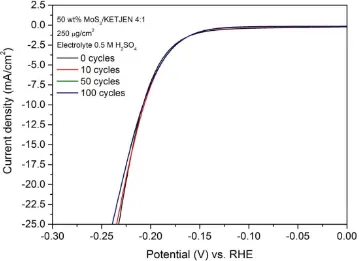
Tab. 3.9 Summary of results for MoS3/KETJEN, S:Mo = 4:1 after 0 (before and after the 1st LSV),10,50,100 cycles of CV stability tests. ... 78
Tab. 3.10 Summary of results for MoS3/KETJEN, S:Mo = 5:1 after 0 (before and after the 1st LSV),10,50,100,200 cycles of CV stability tests. ... 81
Tab. 3.11 Summary of results for MoS3/KETJEN, S:Mo = 7:1 at 250, 350 and 500 μg/cm2 loading. ... 84
Tab. 3.12 Summary of results for MoS3/KETJEN, S:Mo = 4:1 in ethylene glycol after 0 (before and after the 1st LSV),10,50,100,200 cycles of CV stability tests. ... 88
Tab. 3.13 Summary of results for MoS3/KETJEN, S:Mo = 5:1 in ethylene glycol after 0 (before and after the 1st LSV),10,50,100,200 cycles of CV stability tests. ... 91
Tab. 3.14 Summary of results for MoS3/KETJEN, S:Mo = 7:1 in ethylene glycol after 0 (before and after the 1st LSV),10,50,100,200 cycles of CV stability tests. ... 93
xi
Tab. 3.16 Summary of results for MoS3/VULCAN, S:Mo = 5:1 after 0 (before and after the 1st
LSV),10,50 cycles of CV stability tests. ... 100
Tab. 3.17 Summary of results for MoS3/VULCAN, S:Mo = 7:1 after 0 (before and after the 1st LSV),10,50 cycles of CV stability tests. ... 103
Tab. 3.18 Summary of results for MoS3/VULCAN, S:Mo = 4:1 in ethylene glycol after 0 (before and after the 1st LSV),10,50,100 cycles of CV stability tests. ... 106
Tab. 3.19 Summary of results for MoS3/VULCAN in ethylene glycol, S:Mo = 5:1 after 0 (before and after the 1st LSV),10,50,100 and 200 cycles of CV stability tests. .... 109
Tab. 3.20Summary data of real weight percentage of C, H, N, S, Mo, S:Mo ratio, charge-transfer resistance, capacitance per unit area, Tafel slope, exchange current, potential at -10 mA/cm2 for MoS3 on GNP, Ketjenblack and Vulcan, S:Mo = 5:1 in ethylene glycol after 0 cycles of CV stability tests ... 116
Tab. 3.21 Compositions analysis of MoSx electrocatalysts from XPS (top) and ICP-CHNS (bottom) made on GNP, Ketjen, Vulcan at S:Mo 5:1 in ethylene glycol. ... 122
Tab. 3.22 Binding energy and assignment of the characteristic peaks found in the XPS spectra (Mo 3d5/2 and S 2p3/2) of MoSx electrocatalysts pure from Sigma-Aldrich, supported on GNP, KetjenBlack and Vulcan, at S:Mo 5:1 in ethylene glycol. .... 122
Tab. 3.23 Chemical states and peak area ratios of MoSx electrocatalysts pure from Sigma-Aldrich, supported on GNP, KetjenBlack and Vulcan, at S:Mo 5:1 in ethylene glycol. ... 123
Tab. 3.24 Matrix of the second series of experiments.... 131
Tab. 3.25 Reactants needed to obtain the desired doped products at S:Mo 5:1. ... 132
Tab. 3.26 Reactants needed to obtain the desired doped products at S:Mo 7:1. ... 132
Tab. 3.27 Summary of results for Co-doped MoS3/Ketjenblack in ethylene glycol, S:Mo = 5:1 and 7:1 after 0 cycles of CV stability tests. ... 135
Tab. 3.28 Data of real weight percentage of C, H, N, S, Mo, S:Mo ratio, charge-transfer resistance, capacitance per unit area, Tafel slope, exchange current, potential at -10 mA/cm2 for Co-doped MoS3/Ketjenblack in ethylene glycol, S:Mo = 5:1 and 7:1. ... 136
Tab. 3.29 Compositions analysis of MoSx electrocatalysts from XPS (top) and ICP-CHNS (bottom) doped with 2%Co and 5%Co on Ketjenblack, at S:Mo 5:1 in ethylene glycol. ... 138
Tab. 3.30 Binding energy and assignment of the characteristic peaks found in the XPS spectra (Mo 3d5/2 and S 2p3/2) of MoSx electrocatalysts pure from Sigma-Aldrich, and doped with 2%Co and 5%Co on Ketjenblack, at S:Mo 5:1 in ethylene glycol. ... 139
xii
Tab. 3.32 Reactants needed to obtain the desired doped products at S:Mo 5:1. ... 141
Tab. 3.33 Reactants needed to obtain the desired doped products at S:Mo 7:1. ... 141
Tab. 3.34 Summary of results for Fe-doped MoS3/Ketjenblack in ethylene glycol, S:Mo = 5:1 and 7:1 after 0 cycles of CV stability tests. ... 144
Tab. 3.35 Data of real weight percentage of C, H, N, S, Mo, S:Mo ratio, charge-transfer resistance, capacitance per unit area, Tafel slope, exchange current, potential at -10 mA/cm2 for Fe-doped MoS3/Ketjenblack in ethylene glycol, S:Mo = 5:1 and 7:1. ... 146
Tab. 3.36 Compositions analysis of MoSx electrocatalysts from XPS (top) and ICP-CHNS (bottom) doped with 2%Fe and 5%Fe on Ketjenblack, at S:Mo 5:1 in ethylene glycol. ... 148
Tab. 3.37 Binding energy and assignment of the characteristic peaks found in the XPS
spectra (Mo 3d5/2 and S 2p3/2) of MoSx electrocatalysts pure from Sigma-Aldrich, and doped with 2%Fe and 5%Fe on Ketjenblack, at S:Mo 5:1 in ethylene glycol.
... 149
Tab. 3.38 Chemical states and peak area ratios of MoSx electrocatalysts pure from Sigma-Aldrich, and doped with 2%Fe and 5%Fe on Ketjenblack, at S:Mo 5:1 in ethylene glycol. ... 149
Tab. 3.39 Mixtures of solvents used in the attempt to completely dissolve (NH4)2MoS4. ... 155 Tab. 3.40 Summary of solvents, amount of sulfuric acid and S:Mo ratio used in the DMF
experiments. The final pH, color of the filtrate solution and weight of the catalysts are reported. ... 156
Tab. 3.41 Summary of results for MoS3/Ketjenblack at 5:1 and 7:1 S:Mo ratio in DMF+H2O and DMF+EGafter 0 cycles of CV stability tests. ... 159
Tab. 3.42 Data of real weight percentage of C, H, N, S, Mo, S:Mo ratio, charge-transfer resistance, capacitance per unit area, Tafel slope, exchange current, potential at -10 mA/cm2 for MoS3/Ketjenblack at 5:1 and 7:1 S:Mo ratio in DMF+H2O and DMF+EG. ... 160
Tab. 3.43 Summary of results for MoS3/Ketjenblack at 4:1 and 5:1 S:Mo ratio in ethylene glycol at different final pHs after 0 cycles of CV stability tests. ... 168
Tab. 4.1 Summary data of relevant studies on the MoS2 as a catalyst for the hydrogen
xiii
LIST OF FIGURES
Fig. 1.1 Scheme of an electrolytic cell for hydrogen production.... 3
Fig. 1.2 Exchange current density as a function of hydrogen adsorption free energy for various HER catalyst materials. The trend in the data defines a so-called “volcano plot” for the HER. Platinum, with slightly negative hydrogen absorption energy, has the highest HER activity. ... 5
Fig. 1.3 Schematic of the difference in conductivity to the active sites on nanoplatelets (a) and nanoparticles (b). ... 7
Fig. 1.4 a) Hopping of electrons in the vertical direction of MoS2 layers. The right side illustrates the potential distribution in the multilayer film and the hopping of electrons through the potential barrier in the interlayer gap. b) The exchange current density of the MoS2 film as a function of the layer number. ... 8
Fig. 1.5 Structure of molybdenum trisulfide. ... 10
Fig. 1.6 (a) and (d) are the schematic diagram of Co/MoS2 and Ni/MoS2 systems. The corresponding partial density of states projected on sd orbitals are given in (b) and (e); the corresponding electronic deformation densities are shown in (c) and (f).The yellow and green denote S and Mo, the blue and pink are Co and Ni, respectively 12 Fig. 1.7 (a) Molecular model of MoS2 showing its lamellar structure and (b) molecular model of the interface region between MoS2 and Co9S8 as present on unsupported Co/MoS2 catalyst. ... 13
Fig. 1.8 LSV polarization curves for GCEs modified with (A) MoS2/MCNs, (B) a mixture of MoS2 and MCNs, (C) pure MoS2 and (D) MCNs in 0.5 M H2SO4; scan rate: 2 mV/s ... 17
Fig. 2.1 Scheme of the synthesis procedure for MoS3 nanoparticles on carbon support. ... 33
Fig. 2.2 Glassy carbon electrode with Teflon coat. Radius = 0.25 cm. ... 34
Fig. 2.3 Set-up configuration for the electrochemical tests system. ... 40
Fig. 2.4 Equivalent Randles circuit R1(QR2) where R1= solution resistance, R2 = charge-transfer resistance and Q = constant phase element (CPE). ... 44
Fig. 3.1 Current density-potential curves from LSV after 0,10,50,100,200 cycles of CV stability tests for MoS3/GNP, S:Mo = 4:1. ... 51
Fig. 3.2 Current density vs Potential curves from CV after 0,10,50,100,200 cycles of CV stability tests for MoS3/GNP, S:Mo = 4:1. ... 51
Fig. 3.3 Impedance curves from EIS after 0,10,50,100,200 cycles of CV stability tests for MoS3/GNP, S:Mo = 4:1. ... 52
xiv
Fig. 3.5 Current density-potential curves from LSV after 0,10,50,100,200 cycles of CV
stability tests for MoS3/GNP, S:Mo = 5:1. ... 55 Fig. 3.6 Current density vs Potential curves from CV after 0,10,50,100,200 cycles of CV
stability tests for MoS3/GNP, S:Mo = 5:1. ... 55 Fig. 3.7 Impedance curves from EIS after 0,10,50,100,200 cycles of CV stability tests for
MoS3/GNP, S:Mo = 5:1. ... 56 Fig. 3.8 Tafel plot from LSV after 0,10,50,100,200 cycles of CV stability tests for MoS3/GNP,
S:Mo = 5:1. ... 56
Fig. 3.9 Current density-potential curves from LSV after 0,10,50,100,200 cycles of CV
stability tests for MoS3/GNP, S:Mo = 7:1. ... 58 Fig. 3.10 Current density vs Potential curves from CV after 0,10,50,100,200 cycles of CV
stability tests for MoS3/GNP, S:Mo = 7:1. ... 59 Fig. 3.11 Impedance curves from EIS after 0,10,50,100,200 cycles of CV stability tests for
MoS3/GNP, S:Mo = 7:1. ... 60 Fig. 3.12 Tafel plot from LSV after 0,10,50,100,200 cycles of CV stability tests for
MoS3/GNP, S:Mo = 7:1. ... 60 Fig. 3.13 Current density-potential curves from LSV after 0,10,50,100,200 cycles of CV
stability tests for MoS3/GNP, S:Mo = 10:1. ... 62 Fig. 3.14 Current density vs Potential curves from CV after 0,10,50,100,200 cycles of CV
stability tests for MoS3/GNP, S:Mo = 10:1. ... 62 Fig. 3.15 Impedance curves from EIS after 0,10,50,100,200 cycles of CV stability tests for
MoS3/GNP, S:Mo = 10:1. ... 63 Fig. 3.16 Tafel plot from LSV after 0,10,50,100,200 cycles of CV stability tests for
MoS3/GNP, S:Mo = 10:1. ... 63 Fig. 3.17 Current density-potential curves from LSV after 0 cycles of CV stability tests for
MoS3/GNP, at 4:1, 5:1, 7:1 and 10:1 S:Mo ratio. Pt data are also reported. ... 65 Fig. 3.18 TGA of Thiomolybdate and Molybdate run in air from room T to 250° C at 5°C/min (a), with 1 hour hold at 250°C (b). ... 69
Fig. 3.19 TGA run in nitrogen from room T to 500° C at 5°C/min and hold at 500°C for 2 hours of Ammonium Tetrathiomolybdate (a) and MoS3/Ketjenblack carbon (b). .... 70 Fig. 3.20 Current density-potential curves from LSV after 0,10,50,100,200 cycles of CV
stability tests for MoS3/GNP, S:Mo = 4:1 in ethylene glycol. ... 71 Fig. 3.21 Current density-potential curves from LSV after 0,10,50,100,200 cycles of CV
stability tests for MoS3/GNP, S:Mo = 5:1 in ethylene glycol. ... 73 Fig. 3.22 Current density vs Potential curves from CV after 0,10,50,100,200 cycles of CV
stability tests for MoS3/GNP, S:Mo = 5:1 in ethylene glycol. ... 73 Fig. 3.23 Impedance curves from EIS after 0,10,50,100,200 cycles of CV stability tests for
xv
Fig. 3.24 Tafel plot from LSV after 0,10,50,100,200 cycles of CV stability tests for
MoS3/GNP, S:Mo = 5:1 in ethylene glycol. ... 74 Fig. 3.25 Current density-potential curves from LSV after 0 cycles of CV stability tests for
MoS3/GNP, at 4:1 and 5:1, made in water and ethylene glycol. Pt data are also reported. ... 76
Fig. 3.26 Current density-potential curves from LSV after 0,10,50,100 cycles of CV stability tests for MoS3/KETJEN, S:Mo = 4:1. ... 77 Fig. 3.27 Current density-potential curves from LSV after 0,10,50,100,200 cycles of CV
stability tests for MoS3/KETJEN, S:Mo = 5:1. ... 79 Fig. 3.28 Current density vs Potential curves from CV after 0,10,50,100,200 cycles of CV
stability tests for MoS3/KETJEN, S:Mo = 5:1. ... 79 Fig. 3.29 Impedance curves from EIS after 0,10,50,100,200 cycles of CV stability tests for
MoS3/KETJEN, S:Mo = 5:1. ... 80 Fig. 3.30 Tafel plot from LSV after 0,10,50,100,200 cycles of CV stability tests for
MoS3/KETJEN, S:Mo = 5:1. ... 80 Fig. 3.31 Current density-potential curves from LSV at 250, 350 and 500 μg/cm2 loading for
MoS3/KETJEN, S:Mo = 7:1. ... 82 Fig. 3.32 Current density vs Potential curves from CV at 250, 350 and 500 μg/cm2 loading
for MoS3/KETJEN, S:Mo = 7:1. ... 83 Fig. 3.33 Impedance curves from EIS at 250, 350 and 500 μg/cm2 loading for MoS
3/KETJEN, S:Mo = 7:1. ... 83
Fig. 3.34 Tafel plot from LSV at 250, 350 and 500 μg/cm2 loading for MoS
3/KETJEN, S:Mo = 7:1. ... 84
Fig. 3.35 Curves for potential at -10 mA/cm2 and capacitance at different loadings for
MoS3/Ketjenblack at S:Mo = 7:1 ... 85 Fig. 3.36 Current density-potential curves from LSV after 0 cycles of CV stability tests for
MoS3/KETJENBLACK, at 4:1, 5:1 and 7:1 S:Mo ratio. Pt data are also reported. 86 Fig. 3.37 Current density-potential curves from LSV after 0,10,50,100,200 cycles of CV
stability tests for MoS3/KETJEN, S:Mo = 4:1 in ethylene glycol. ... 88 Fig. 3.38 Current density-potential curves from LSV after 0,10,50,100,200 cycles of CV
stability tests for MoS3/KETJEN, S:Mo = 5:1 in ethylene glycol. ... 89 Fig. 3.39 Current density vs Potential curves from CV after 0,10,50,100,200 cycles of CV
stability tests for MoS3/KETJEN, S:Mo = 5:1 in ethylene glycol. ... 90 Fig. 3.40 Impedance curves from EIS after 0,10,50,100,200 cycles of CV stability tests for
MoS3/KETJEN, S:Mo = 5:1 in ethylene glycol. ... 90 Fig. 3.41 Tafel plot from LSV after 0,10,50,100,200 cycles of CV stability tests for
MoS3/KETJEN, S:Mo = 5:1 in ethylene glycol. ... 91 Fig. 3.42 Current density-potential curves from LSV after 0,10,50,100,200 cycles of CV
xvi
Fig. 3.43 Current density-potential curves from LSV after 0 cycles of CV stability tests for MoS3/KETJENBLACK in ethylene glycol, at 4:1, 5:1 and 7:1 S:Mo ratio. Pt data are also reported. ... 94
Fig. 3.44 Current density-potential curves from LSV after 0 cycles of CV stability tests for MoS3/KETJEN, at 4:1, 5:1 and 7:1, made in water and ethylene glycol. Pt data are also reported. ... 95
Fig. 3.45 Current density-potential curves from LSV after 0,10,50,100 cycles of CV stability tests for MoS3/VULCAN, S:Mo = 4:1. ... 96 Fig. 3.46 Current density-potential curves from LSV after 0,10,50 cycles of CV stability tests
for MoS3/VULCAN, S:Mo = 5:1. ... 98 Fig. 3.47 Current density vs Potential curves from CV after 0,10,50 cycles of CV stability
tests for MoS3/VULCAN, S:Mo = 5:1. ... 98 Fig. 3.48 Impedance curves from EIS after 0,10,50 cycles of CV stability tests for
MoS3/VULCAN, S:Mo = 5:1.... 99 Fig. 3.49 Tafel plot from LSV after 0,10,50 cycles of CV stability tests for MoS3/VULCAN,
S:Mo = 5:1. ... 99
Fig. 3.50 Current density-potential curves from LSV after 0,10,50 cycles of CV stability tests for MoS3/VULCAN, S:Mo =7:1. ... 101 Fig. 3.51 Current density vs Potential curves from CV after 0,10,50 cycles of CV stability
tests for MoS3/VULCAN, S:Mo = 7:1. ... 102 Fig. 3.52 Impedance curves from EIS after 0,10,50 cycles of CV stability tests for
MoS3/VULCAN, S:Mo = 7:1.... 102 Fig. 3.53 Tafel plot from LSV after 0,10,50 cycles of CV stability tests for MoS3/VULCAN,
S:Mo = 7:1. ... 103
Fig. 3.54 Current density-potential curves from LSV after 0 cycles of CV stability tests for MoS3/VULCAN, at 4:1, 5:1 and 7:1 S:Mo ratio. Pt data are also reported. ... 104 Fig. 3.55 Current density-potential curves from LSV after 0,10,50,100 cycles of CV stability
tests for MoS3/VULCAN in ethylene glycol, S:Mo = 4:1.... 106 Fig. 3.56 Current density-potential curves from LSV after 0,10,50, 100, 200 cycles of CV
stability tests for MoS3/VULCAN in ethylene glycol, S:Mo = 5:1. ... 107 Fig. 3.57 Current density vs Potential curves from CV after 0,10,50, 100, 200 cycles of CV
stability tests for MoS3/VULCAN in ethylene glycol, S:Mo = 5:1. ... 108 Fig. 3.58 Impedance curves from EIS after 0,10,50,100,200 cycles of CV stability tests for
MoS3/VULCAN in ethylene glycol, S:Mo = 5:1. ... 108 Fig. 3.59 Tafel plot from LSV after 0,10,50,100,200 cycles of CV stability tests for
MoS3/VULCAN in ethylene glycol, S:Mo = 5:1. ... 109 Fig. 3.60 Current density-potential curves from LSV after 0 cycles of CV stability tests for
xvii
Fig. 3.61 Current density-potential curves from LSV after 0 cycles of CV stability tests at 50, 150, 250, 350 and 500 μg/cm2 loading for MoS
3/GNP, S:Mo = 5:1. ... 112 Fig. 3.62 Summary of capacitance and potential at -10 mA/cm2 vs loading for MoS3/GNP,
S:Mo = 5:1. ... 112
Fig. 3.63 Current density-potential curves from LSV after 0 cycles of CV stability tests at 50, 150, 250, 350 and 500 μg/cm2 loading for MoS
3/KETJEN, S:Mo = 5:1. ... 113 Fig. 3.64 Summary of capacitance and potential at -10 mA/cm2 vs loading for
MoS3/KETJEN, S:Mo = 5:1. ... 113 Fig. 3.65 Current density-potential curves from LSV after 0 cycles of CV stability tests at 50,
150, 250, 350 and 500 μg/cm2 loading for MoS
3/VULCAN, S:Mo = 5:1.... 114 Fig. 3.66 Summary of capacitance and potential at -10 mA/cm2 vs loading for
MoS3/VULCAN, S:Mo = 5:1.... 114 Fig. 3.67 SEM images of MoS3 on GNP in water S:Mo ratio 4:1 (a), 5:1 (b), 7:1 (c), 10:1 (d)
Location: center of the plate; Zoom: x50 ... 117
Fig. 3.68 SEM images of MoS3 on GNP: S:Mo 4:1 ratio in water (a) and Ethylene Glycol (b), S:Mo ratio 5:1 in water (c) and Ethylene Glycol (d).Location: center of the plate; Zoom: x50 ... 118
Fig. 3.69 SEM images of MoS3 in Ethylene Glycol, S:Mo ratio 5:1 on GNP (a),
KETJENBLACK (b) and VULCAN (c). Location: center of the plate; Zoom: x50 118
Fig. 3.70 Profile of MoS3/Ketjenblack film 5:1 in ethylene glycol deposited on a glassy carbon plate. ... 120
Fig. 3.71 TEM images at two different spots for each sample of xGNP (a) and (b),
Ketjenblack (c) and (d), Vulcan (e) and (f), MoS3/Ketjenblack in ethylene glycol, S:Mo ratio 5:1 (g) and (h). ... 121
Fig. 3.72 X-ray photoelectron spectra of MoS3/GNP 5:1 in ethylene glycol from (a) S(2p) and (b) Mo(3d). C1s 285.0 eV. ... 124
Fig. 3.73 X-ray photoelectron spectra of MoS3/Ketjenblack 5:1 in ethylene glycol from (a) S(2p) and (b) Mo(3d). C1s 285.0 eV. ... 124
Fig. 3.74 X-ray photoelectron spectra of MoS3/Vulcan 5:1 in ethylene glycol from (a) S(2p) and (b) Mo(3d). C1s 285.0 eV. ... 125
Fig. 3.75 Current density vs potential from LSV after 0 cycles of CV stability for
MoS3/Ketjenblack doped with 2 wt%, 5 wt% and 10 wt% cobalt., at 5:1 S:Mo ratio. Pt data are also reported. ... 133
Fig. 3.76 Current density vs potential from LSV after 0 cycles of CV stability for
MoS3/Ketjenblack doped with 2 wt% and 5 wt% cobalt., at 7:1 S:Mo ratio. Pt data are also reported. ... 133
xviii
Fig. 3.78 Current density vs Potential curves from CV after 0 cycles of CV stability tests Co-doped MoS3/Ketjenblack at 5:1 and 7:1 S:Mo ratio. ... 134 Fig. 3.79 STEM FEI Titan 80-300 elemental mapping and survey of MoS3/Ketjenblack 5:1
ratio with 2% Co (top) and 5% Co (bottom). ... 137
Fig. 3.80 X-ray photoelectron spectra of 2%Co-MoS3/KETJENBLACK 5:1 in ethylene glycol from (a) Mo(3d) and (b)S(2p). C1s 285.0 eV. ... 140
Fig. 3.81 X-ray photoelectron spectra of 5%Co-MoS3/KETJENBLACK 5:1 in ethylene glycol from (a) Mo(3d) and (b)S(2p). C1s 285.0 eV. ... 140
Fig. 3.82 Current density vs potential from LSV after 0 cycles of CV stability for
MoS3/Ketjenblack doped with 2 wt%, 5 wt% and 10 wt% of iron, at 5:1 S:Mo ratio. Pt data are also reported. ... 142
Fig. 3.83 Current density vs potential from LSV after 0 cycles of CV stability for
MoS3/Ketjenblack doped with 2 wt% and 5 wt% of iron, at 7:1 S:Mo ratio. Pt data are also reported. ... 142
Fig. 3.84 Tafel plot from LSV after 0 of CV stability tests for Fe-doped MoS3/Ketjenblack at 5:1 and 7:1 S:Mo ratio. ... 143
Fig. 3.85 Current density vs Potential curves from CV after 0 cycles of CV stability tests Fe-doped MoS3/Ketjenblack at 5:1 and 7:1 S:Mo ratio. ... 143 Fig. 3.86 Current density vs potential from LSV after 0 cycles of CV stability for Co/Fe
doped MoS3/Ketjenblack at 5:1 and 7:1 S:Mo ratio. Pt data are also reported. ... 145 Fig. 3.87 Impedance curves from EIS after 0 cycles of CV stability tests for Co/Fe doped
MoS3/Ketjenblack at 5:1 and 7:1 S:Mo ratio. ... 145 Fig. 3.88 STEM FEI Titan 80-300 elemental mapping and survey of MoS3/Ketjenblack 5:1
ratio with 2% Fe (top) and 5% Fe (bottom). ... 147
Fig. 3.89 X-ray photoelectron spectra of 2%Fe-MoS3/KETJENBLACK 5:1 in ethylene glycol from (a) Mo(3d) and (b)S(2p). C1s 285.0 eV. ... 150
Fig. 3.90 X-ray photoelectron spectra of 5%Fe-MoS3/KETJENBLACK 5:1 in ethylene glycol from (a) Mo(3d) and (b)S(2p). C1s 285.0 eV. ... 150
Fig. 3.91 Current density vs potential from LSV after 0 cycles of CV stability for
MoS3/Ketjenblack at 5:1 and 7:1 S:Mo ratio in DMF+H2O and DMF+EG. Pt data are also reported. ... 157
Fig. 3.92 Impedance curves from EIS after 0 cycles of CV stability tests for MoS3/Ketjenblack at 5:1 and 7:1 S:Mo ratio in DMF+H2O and DMF+EG. ... 158 Fig. 3.93 Tafel plot from LSV after 0 cycles of CV stability tests for MoS3/Ketjenblack at 5:1
and 7:1 S:Mo ratio in DMF+H2O and DMF+EG. ... 158 Fig. 3.94 TEM images of MoS3/Ketjenblack 5:1 made in DMF + EG at two different
magnifications. Particle sizes: 1-2 nm.... 161
xix
Fig. 3.96 Current density vs potential from LSV after 0 cycles of CV stability for
MoS3/Ketjenblack at 4:1 and 5:1 S:Mo ratio in ethylene glycol at different final pHs. Pt data are also reported. ... 166
Fig. 3.97 Tafel plot from LSV after 0 cycles of CV stability tests for MoS3/Ketjenblack at 4:1 and 5:1 S:Mo ratio in ethylene glycol at different final pHs. ... 166
Fig. 3.98 Current density vs potential from CV after 0 cycles of CV stability tests for
MoS3/Ketjenblack at 4:1 and 5:1 S:Mo ratio in ethylene glycol at different final pHs.
... 167
Fig. 3.99 Impedance curves from EIS after 0 cycles of CV stability tests for MoS3/Ketjenblack at 4:1 and 5:1 S:Mo ratio in ethylene glycol at different final pHs. ... 167
Fig. 3.100 Filtrate solutions after the synthesis and filtration of MoS3/Ketjenblack at 5:1 S:Mo in ethylene glycol at pH higher (left) and lower (right) than 2.65. ... 169
Fig. 3.101 TEM images of MoS3/Ketjenblack 5:1 made in EG + NaOH at two different magnifications. pH = 3-4 H2SO4. Particle size < 1 nm. ... 170 Fig. 3.102 TEM images of MoS3/Ketjenblack 4:1 made in EG + 120 mg NaOH at two
different magnifications. pH = 4-5 HCl. Particle size < 1 nm. ... 171
Fig. 3.103 STEM elemental mapping of MoS3/Ketjenblack 5:1 in EG + NaOH. pH = 3-4 H2SO4. ... 172 Fig. 3.104 STEM elemental mapping of MoS3/Ketjenblack 4:1in EG + NaOH. pH = 4-5 HCl
... 172
Fig. 3.105 Effect of final pH on molybdenum precipitation by the rapid acidification
technique. ... 175
Fig. 6.1 2400 Series II CHNS/O Schematic. ... 197
1
CHAPTER 1:
HYDROGEN PRODUCTION
BY WATER ELECTROLYSIS THROUGH
ADVANCED LOW-COST CATALYSTS
1.1
INTRODUCTION
In the last few decades the challenge of clean energies gave rise to debates about fossil fuel combustion processes, which led to the proclamation of stricter international requirements for toxic emissions. In this framework two pathways were followed by scientists: on one side better technologies were exploited for the fossil fuel combustion processes, to increase the efficiency and decrease the emitted pollutants; on the other side renewable and cleaner energy sources have been introduced into the market. The proposed use of hydrogen represents an interesting alternative source of energy not only because of its very low environmental impact, high-specific energy, and the possibility to store, transfer and distribute it, but also because of its intrinsic characteristic as a major energy carrier1,2. This raised the interest in the sustainable ways of producing it to promote a renewable clean energy cycle. Indeed, hydrogen can’t be considered as a primary source of energy (because it is not naturally found in its pure state), but as a means of storing and using energy later in time, i.e. hydrogen is truly an energy carrier. Thus, it is clearly necessary to produce hydrogen by spending energy to chemically generate it from other compounds: this is usually the reason of the high cost of the final product.
1 “Sustainable Hydrogen Production”, J. A. Turner, Science. 2004, 305, 972.
2 Electricity is nowadays only a secondary source of energy to produce hydrogen by water electrolysis or chlor-alkali electrolysis, where hydrogen is a side product. Electrochemical water splitting is actually the best method to generate high-purity hydrogen and without pollutants, although only 4% of the total hydrogen is produced with this method3. Electricity is the main reason of the high cost of the process, because of the high energy required to split the water.
Hydrogen can be exploited in different ways. First, as an energy carrier, it could be sent to power plants, stored and later burnt for producing energy. Second, it could be used in the automotive industry: BMW already showed an entirely automatic early hydrogen station prototype4. Last but not least, hydrogen is already applied as a fuel for fuel cells, i.e. it is used to produce electric and thermal energy in cogeneration plants.
1.1.1
Water electrolysis
Water electrolysis happens when current is allowed to flow through two electrodes immersed in an aqueous electrolyte (Fig. 1.1), thus by electrochemically decomposing water with the overall reaction:
(1) H2O + electric energy → H2 +
2 1
O2
This reaction requires an energy input of ΔG = 237.1 kJ/mol at standard conditions, which corresponds to a thermodynamic voltage requirement of 1.23 V.
3“Electrolysis: the important Energy transformer in a world of sustainable Energy”, W. Kreuter, H. Hofmann, Int. Journ. Hydrogen Energy, 1998, Vol. 23, Issue 8, pp. 661-666.
3
Fig. 1.1 Scheme of an electrolytic cell for hydrogen production.
The electrolytic cell is a container with an electrolyte, where the two electrodes (anode and cathode) are immersed. The electric field created by the applied potential makes the anions to move toward the anode and the cations to move toward the cathode.
At the same time, the protons are reduced at the cathode and the water is oxidized at the anode.
In a water splitting cell, the two half reactions are:
the Hydrogen Evolution Reaction (HER), at the cathode:
(2) 2H+ + 2e− → H2
the Oxygen Evolution Reaction (OER), at the anode:
(3) H2O → ½ O2+2H+ + 2e−
4 The HER is thought to involve three possible reaction steps which lead to two possible mechanisms5: the Volmer−Heyrovsky or the Volmer−Tafel mechanism.
• Volmer step: H+ + e− → Had • Heyrovsky step: H+ + Had + e- → H2 • Tafel step: 2Had → H2
In both cases, the reaction proceeds through hydrogen atoms adsorbed at the electrode surface, Had, and thus the rate of the overall reaction is influenced by the free energy of hydrogen adsorption, ΔGH. The rate-limiting step could be the adsorption, in case of a weak hydrogen-to-surface bond, or the desorption, in case of a strong hydrogen-to-surface bond. The best HER catalysts have hydrogen adsorption energies close to ΔGH = 0. This principle gives rise to the “volcano” shape in Fig. 1.26:
5“Hydrogen Electrocatalysis”, Kibler, L. A. Chem. Phys. Chem. 2006, 7, 985−991.
5
Fig. 1.2 Exchange current density as a function of hydrogen adsorption free energy for various HER catalyst materials. The trend in the data defines a so-called “volcano plot” for the HER. Platinum, with slightly negative hydrogen absorption energy, has the highest HER activity6.
The most effective catalysts for the HER are Pt-based, but Pt is a rare metal on Earth and its cost is high for practical application. In recent years, molybdenum sulfides, capable of accepting electrons and protons, were highlighted as promising hydrogen evolution catalysts7,8,9.
1.1.2
MoS
2as an electrocatalyst for the HER
The studies of Nidola and Schira in 1986 on sulphide coatings showed for the first time that a MoS2 pigmented NiSx coating had higher catalytic activity and higher stability for the
7“Hydrogen evolution across nano-Schottky junctions at carbon supported MoS
2 catalysts in biphasic liquid
systems” P. Ge , M. D. Scanlon , P. Peljo , X. Bian , H. Vubrel , A. O’Neill, J. N. Coleman , M. Cantoni , X. Hu, K. Kontturi , B. Liu , H. H. Girault , Chem. Commun. 2012, 48, 6484.
8“Molybdenum-sulfur dimers as electrocatalysts for the production of hydrogen at low overpotentials”, A. M. Appel , D. L. DuBois , M. R. DuBois , J. Am. Chem. Soc. 2005, 127 , 12717.
9“Hydrodesulfurization reaction pathways on MoS
6 Hydrogen Evolution Reaction than the non-pigmented one10. MoS2 was already known for its catalytic properties for hydrodesulfurization reactions and Raybaud et al. demonstrated with a local-density-functional study that the active sites are not situated on the basal planes but on the edges of the structure of MoS211. The latter was investigated firstly by Jaegermann and Trubutsch in 1988 together with other transition metal chalcogenides12. MoS2 is trigonal prismatic coordinated and its structure is characterized by sheets of covalently bound S-Mo-S sandwiches. Several years later Topsøe et al. showed that the structure of the MoS2 catalyst is composed almost entirely of flat polygons of S-Mo-S trilayers13. These layers can be stacked in a structure similar to graphite or remain as single trilayers, in which two kinds of surface sites can be observed: terrace sites (on the basal plane) and edge sites (on edges of the nanoparticles). Scanning tunneling microscopy studies on thiophene have shown that the active sites for hydrodesulfurization reaction (HDS) are on the nanoparticle edges12,14. A combination of surface resolving methods and electrochemical studies determined the active sites of molybdenum sulfide for the HER. By preparing MoS2 nanoparticles of different sizes (thus varying the distribution of surface sites on MoS2 nanoparticles), it has
10“Newsulphide coatings for Hydrogen Evolution in KOH electrolysis”, A. Nidola, R. Schira, Int. J. Hydrogen Energy, 1986, Vol. 11, 7, pp. 449-454.
11“Ab Initio Study of the H
2-H2S/MoS2 Gas-Solid Interface: The Nature of the Catalytically Active Sites”, P. Raybaud, J. Hafner, G. Kresse, S. Kasztelan, and H. Toulhoat, Journ. Of Catalysis, 2000, 189, pp. 129-146. 12“Interfacial properties of semiconducting transition metal chalcogenides”, W. Jaegermann and H. Tributsch, Progress in Surface Science, 1988, Vol. 29(1/2), pp. 1-167.
13 “Hydrotreating Catalysis” H. Topsøe, B. S. Clausen and F. E. Massoth, , eds. J. R. Anderson and M. Boudart, Catalysis Science and Technology, Volume 11, Springer Verlag, Berlin, Germany, 1996.
14 “Hydrodesulfurization reaction pathways on MoS
7 been observed that the electrocatalytic activity of MoS2 for HER correlates linearly with the number of edge sites on the MoS2 catalyst15,16.
One of the problems resulting when using MoS2 in any electrochemical reaction is the extremely low conductivity between adjacent Van Der Waals bonded S–Mo–S sheets. So if we look at the single layer nanoplatelets [Fig.1.3a], we can understand that they have an optimal structure compared to a multi-layer nanoparticle [Fig.1.3b], because electrons only need to be transferred from the support to the platelets. The electrons transferred in a nanoparticle from the support to the bottom layer have to keep going then through four platelet interfaces to reach all the edges. This increases the resistance for each traversed layer17.
Fig. 1.3 Schematic of the difference in conductivity to the active sites on nanoplatelets (a) and nanoparticles (b)17.
15“Recent developments of molybdenum and tungsten sulfides as hydrogen evolution catalysts”, Daniel Merki and Xile Hu, Energy Environ. Sci., 2011, 4, 3878.
16 “Identification of Active Edge Sites for Electrochemical H
2 Evolution from MoS2 Nanocatalysts”, Thomas F. Jaramillo, Kristina P. Jørgensen, Jacob Bonde, Jane H. Nielsen, Sebastian Horch, Ib Chorkendorff, Science. 2007 Jul 6; 317(5834):100-2.
17 “Molybdenum sulfides- efficient and viable materials for electro – and photoelectrocatalytic hydrogen
8 Thus, there are two general strategies to improve MoS2 electrocatalysts. The first is to improve the intrinsic reactivity of the catalyst, i.e. optimizing the binding energy of hydrogen, for example, by doping the MoS2 nanoplatelets with transition metal ions. The second approach to improve the electrocatalytic activity of MoS2 is to increase the amount of edges per mole MoS2.
The number of edge sites is not the sole important factor which affects the catalytic activity of the MoS2 for the HER. The activity is also dependent on the number of layers of its thin film structure. In particular, its catalytic activity decreases by a factor of ∼4.47 for each additional layer. This behavior is likely correlated to the “jumping” of electrons in the vertical direction of MoS2 layers (Fig. 1.4) over an interlayer potential barrier that has been calculated, and then observed, as 0.119 V18.
Fig. 1.4 a) Hopping of electrons in the vertical direction of MoS2 layers. The right side illustrates the potential distribution in the multilayer film and the hopping of electrons through the potential barrier in the interlayer gap. b) The exchange current density of the MoS2 film as a function of the layer number18.
18 “Layer-Dependent Electrocatalysis of MoS
9
1.1.3
Amorphous, crystalline and clusters of Molybdenum sulfides
Molybdenum sulfides can be produced in different grades of crystallinity. The highly crystalline sulfide is MoS2, which is the first one studied and whose nanoparticles are mostly synthesized by high-temperature sulfidation reactions or hydrothermal reactions. On the contrary, amorphous molybdenum sulfides (MoSx) can be produced under milder conditions and they have been found to be active catalysts toward the HER19,20,24. However, Merki et al.
showed that a pre-activation process is occurring when amorphous MoS3 was used as a catalyst for the HER20. The XPS and UV-Vs spectra showed that after multiple polarization scans, the major part of the catalyst was a reduced MoSx species (where 3 > x ≥ 2), which is the real molybdenum sulfide active toward the HER.
MoS3 was believed to be a mixture of MoS2 and elemental S, but Hibble et al. showed theoretically21 and Wang et al. confirmed with electrochemical tests22 that molybdenum trisulfide exists as Mo3S9 clusters (Fig. 1.5).
19 “Hydrogen evolution catalyzed by MoS
3 and MoS2 particles”, H. Vrubel, D. Merki, X. Hu, Energy Environ. Sci., 2012, 5, 6136-6144.
20“Amorphous molybdenum sulfide films as catalysts for electrochemical hydrogen production in water”, D. Merki, S. Fierro, H. Vrubel, X. Hu, , Chem Sci., 2011, 2, 1262-1267.
21“Amorphous MoS
3: clusters or chains? The structural evidence”, S. J. Hibble, R. I. Walton, D. M. Pickup, A. C. Hannon, Journal of Non-Crystalline Solids 232±234 (1998) 434±439.
22 “Characterization of Nanosize Molybdenum Trisulfide for Lithium Batteries and MoS
3 Structure
10
Fig. 1.5 Structure of molybdenum trisulfide22.
An interesting result about molybdenum sulfides was obtained by Kibsgaard et al. when they studied thiomolybdate [Mo3S13]2- nanoclusters23. The basic idea is that, since the active sites of the Mo sulfides catalysts are on the edge of the nanoparticles, a compound with higher edge sulfur atoms would have more active sites. Indeed, the clusters contain three different kind of sulfur ligands, all situated on the edges, and can be considered as Mo sulfide with a higher amount of active sites, since the catalysis could theoretically happen at nearly all the sulfur atoms.
1.1.4
Doping MoS
xwith Fe, Co and Ni
The MoS2 nanoparticles are often difficult to prepare with conventional methods that use elevated temperature, pressure, or vacuum, so there are studies showing interesting properties of the amorphous MoSx films that are prepared by simple solution electrochemistry under
23“Building an appropriate active-site motif into a hydrogen-evolution catalyst with thiomolybdate [Mo 3S13]
11 ambient conditions24. These studies showed also that doping the catalyst with Fe, Co and Ni improves the catalytic activity of the MoSx, by optimizing the binding energy of hydrogen. The Co/Fe/Ni–Mo–S films are active HER catalysts. The Co-promoted MoS3 film was prepared by electropolymerization of (NH4)2[Co(MoS4)2], which can be prepared in situ
immediately upon the mixing of CoCl2 with (NH4)2[MoS4]. The Co-MoS3 film showed optimal catalytic activity when the initial Co:Mo ratio was about 1:3. The catalytic activities of these ternary M–MoS3 (where M=Co/Fe/Ni) films towards HER were measured using linear sweep voltammetry: Fe2+ appears to significantly promote the activity of MoS3 film at both acidic and neutral pHs, and Ni2+ has a pronounced promotional effect at pH = 7. Other ions have a smaller or negligible influence on the activity24.
The electrochemical impedance responses of these films support the idea that the HER catalyzed by amorphous MoS3 and M–MoS3 (where M= Mn, Fe, Cu, Zn) in acidic solutions exploits a fast Volmer step and then a rate-determining Heyrovsky step. SEM results showed a morphological change when Fe, Co, or Ni are incorporated into the amorphous MoS3 film. In the electropolymerization technique the addition of the above transition metals improved the growth of the film, increasing its surface area, the catalyst loading and then its activity24. The addition of Co or Ni in particular modifies the shape of the Molybdenum sulfide clusters, to one closer to hexagonal. The doped catalyst tend to expose more promoted (1010) S-type edges and HAADF-STEM results showed also the Co- and Ni- promoted catalysts may expose other high index facets25.
24 “Fe, Co, and Ni ions promote the catalytic activity of amorphous molybdenum sulfide films for hydrogen
evolution” D. Merki, H. Vrubel, L. Rovelli, S. Fierro and X. Hu, Chem. Sci., 3, 2515 (2012). 25 “The morphology of MoS
2, WS2, Co-Mo-S, Ni-Mo-S and Ni-W-S nanoclusters in hydrodesulfurization
12 Merki et al. suggest that HER occurs at defect sites in the amorphous MoS3, which are unsaturated Mo and S sites. The presence of Fe, Ni and Co ions can enhance the activity of these unsaturated sites, leading to higher intrinsic activity24.
In fact, the dopant ions may be incorporated into the catalyst structure in different ways. Xiao
et al. performed a DFT study to show that, in Co/MoS2 and Ni/MoS2, the doped metal atom is located on the S vacancy site and it’s bonded with the nearest Mo atom26 (Fig. 1.6).
Fig. 1. 6(a) and (d) are the schematic diagram of Co/MoS2 and Ni/MoS2 systems. The corresponding partial density of states projected on sd orbitals are given in (b) and (e); the corresponding electronic deformation densities are shown in (c) and (f).The yellow and green denote S and Mo, the blue and pink are Co and Ni, respectively26.
26“Functional MoS
13 A similar study was performed on Fe/MoS2 and reached the same conclusion27.
However, the number of vacancies in the lattice can be increased only with the use of specific techniques (such as low-argon sputtering28 or electron irradiation29). In all other cases, it’s unlikely to have a high concentration of dopants in the lattice vacancies. More frequently, the dopants ions go inside the MoS2 structure as sulfides (i.e. Co as Co9S8), leading to the so-called surface promoted M-Mo-S phase (where M is the dopant metal ion)30 (Fig. 1.7).
Fig. 1.7(a) Molecular model of MoS2 showing its lamellar structure and (b) molecular model of the interface region between MoS2 and Co9S8 as present on unsupported Co/MoS2 catalyst30.
27“Co catalytic oxidation on iron-embedded monolayer MoS
2” S. Ma, Y.Tang, G. Yang, J. Zeng, C. He, Z. Lu, Applied Surface Science, 2015, 328, 71-77.
28 “Controlled argon beam-induced desulfurization of monolayer molybdenum disulfide”, Q. Ma, P.M. Odenthal, J. Mann, D. Le, C.S. Wang, Y. Zhu, T. Chen, D. Sun, K. Yamaguchi, T. Tran, M. Wurch, J.L. Mckinley, J. Wyrick, K.M. Magnone, T.F. Heinz, T.S. Rahman, R. Kawakami, L. Bartels, J. Phys. Condens. Matter, 2013, 25, 252201.
29 “Two-dimensional transition metal dichalcogenides under electron irradiation: defect production and
doping” H.P. Komsa, J. Kotakoski, S. Kurasch, O. Lehtinen, U. Kaiser, A.V. Krasheninnikov, , Phys. Rev. Lett., 2012, 109, 035503.
30“In-situ HRTEM study of the reactive carbide phase of Co/MoS
2 catalyst” M. Ramos, D.Ferrer, E. Martinez-Soto, H.Lopez-Lippmann, B.Torres, G. Berhault, R. R. Chianelli, Ultramicroscopy, 2013, 127, 64–69.
a)
14 Depending on the synthesis procedure, the promoting ions could compete with the Mo in forming sulfides. Cobalt sulfide has been studied to see if this side product enhances even more the activity or if it poisons the catalyst31. Electrochemical tests showed that CoSx is actually a catalyst itself but it is also unstable in acidic solution and its activity decreases after few potential sweeps. However, the Co-promoted molybdenum sulfide looks more stable, which means that it retains the same electrochemical and morphological properties after several polarization sweeps. The activity, which decreases after these tests due to the presence of CoSx, eventually reaches a stable value, which is higher than the unpromoted catalyst. DFT calculations confirm this hypothesis by showing that the hydrogen binding energy (ΔGH) is decreased after the doping with Co ions31.
1.1.5
MoS
2Nanoparticles grown on carbon materials
A second strategy used to enhance the activity of molybdenum sulfides is to improve the electronic contact between the active sites and the underlying electrode. From this point of view, carbon materials are good candidates as catalyst supports due to their unique physicochemical properties, such as high conductivity, good electronic coupling and chemical stability. The electrocatalytic activity of MoS2 mainly depends on the MoS2 morphology and MoSx-support electrical coupling. In this regard, forming highly dispersed nanoparticulate (i.e., edge rich) MoS2 on a conducting matrix is an ideal protocol to lower the activation potential for HER.
15 MoS2 loaded on graphene, graphite, and carbon nanotubes have been used as catalysts for HER17,32,33. To improve the electrocatalytic HER efficiency, it is crucial to increase the surface area for catalyst loading. Different morphological MoS2 shapes were developed on different carbon matrices. Recent studies focused on the catalytic activity more than on the stability, by exploiting molybdenum sulfides on multi-walled carbon nanotubes34, on conducting carbon fiber network35 and on Reduced Graphite Oxide36.
Although HER is involved in most of the recent studies on Molybdenum sulfides, it is sometimes interesting to have a look at developments of the same catalyst for other electrochemical purposes. MoS2–reduced graphene oxide nanosheet–nanosheet hybrids (MoS2NS–RGO), prepared via a lithiation-assisted exfoliation process and a hydrazine monohydrate vapour reduction technique, showed in lithium batteries higher capacity, improved rate capability, and increased endurance, confirming a synergistic effect between MoS2 and graphene nanosheets37. A future work of this compound applied to HER may be relevant.
32 “Highly Efficient Electrocatalytic Hydrogen Production by MoS
x Grown on Graphene-Protected 3D Ni
Foam” Yung-Huang Chang , Cheng-Te Lin , Tzu-Yin Chen , Chang-Lung Hsu , Yi-Hsien Lee ,Wenjing Zhang , Kung-Hwa Wei , and Lain-Jong Li, Adv. Mater. 2013, 25, 756–760.
33“MoS
2 Nanoparticles Grown on Graphene: An Advanced Catalyst for the Hydrogen Evolution Reaction” Yanguang Li, Hailiang Wang, Liming Xie, Yongye Liang, Guosong Hong, and Hongjie Dai, J. Am. Chem. Soc. 2011, 133, 7296–7299.
34 “Facile synthesis of MoS
3/carbon nanotube nanocomposite with high catalytic activity toward hydrogen
evolution reaction” T.-W. Lin, C.-J. Liu J.-Yu Lin, Applied Catalysis B: Environmental 134– 135 (2013) 75– 82.
35“A high-porosity carbon molybdenum sulphide composite with enhanced electrochemical hydrogen evolution
and stability” A. B. Laursen, P. C. K. Vesborg and I. Chorkendorff, Chem. Commun., 2013, 49, 4965. 36“Space-Confined Growth of MoS
2 Nanosheets within Graphite: The Layered Hybrid of MoS2 and Graphene
as an Active Catalyst for Hydrogen Evolution Reaction” X. Zheng, J. Xu, K. Yan, H. Wang, Z. Wang, and S. Yang, Chem. Mater., 2014, 26 (7), pp 2344–2353.
37 “Synthesis of MoS
16 Various three-dimensional (3D) electrode structures have been created and resulted in particularly interesting materials. Thanks to the 3D structures the graphene sheets do not restack and the specific surface area is increased in graphene materials; an interconnected conductive network and a specific microenviroment are created thanks to the optimal intrinsic properties of graphene38. A three-dimensional graphene foam synthesized on a Ni foam skeleton by chemical vapor deposition (CVD) has been reported39. The graphene foam without the support of a Ni skeleton is brittle and is not able to serve as a 3D electrode for hosting catalysts. The 3D Ni foam is a low cost, conductive metal with a high surface area, which is ideal for use as a template to host catalysts with increased reaction sites39.
Another example of the effect of increasing the amount of edges was published by Li et al.33. By adding ammonium tetrathiomolybdate ((NH4)2MoS4) and hydrazine to a solution with Graphene Oxide (GO) dispersed in DMF, they were able to produce MoS2 nanocrystals, via a hydrothermal reduction of the Mo-precursor, and deposit them on GO, which was itself reduced during the process to Reduced Graphene Oxide (RGO). The composite is a material with an abundance of small MoS2 crystals dispersed on the conductive graphene. The amount of edges are now increased as the particles are very small (from 2 to 100 nm) and the conductivity of graphene ensures an efficient electronic contact between the particles and the electrode. This allows for a high loading of MoS2 per unit area, essentially resulting in a smaller electrode footprint.
38“MoS
2 Formed on Mesoporous Graphene as a Highly Active Catalyst for Hydrogen Evolution”, L. Liao, J. Zhu , X. Bian , L. Zhu , M. D. Scanlon , H. H. Girault ,and B. Liu, Adv. Funct. Mater. 2013, DOI: 10.1002/adfm.201300318.
17 Bian et al. focused on in situ reduction of (NH4)2MoS4 to MoS2 on ordered mesoporous carbon nanospheres (MoS2/MCNs), and an electrochemical characterization was obtained for MoS2/MCNs modified glassy carbon electrodes (GCE). They tested pure MoS2, a mixture of MoS2 and MCNs modified GCEs (MoS2–MCNs), pure MCNs, and MoS2 supported on MCNs modified GCEs (MoS2/MCNs). The latter resulted to be the best one in terms of catalytic activity, HER onset potential and observed current densities (Fig. 1.8). The improved electrocatalysis exhibited by the MoS2/MCNs-GCE suggests a smaller activation energy for HER. Nanoparticulate growth on MCNs is confined such that very small and thereby edge-rich, MoS2 particles are formed in comparison to the large aggregated MoS2 grown freely in solution. Additionally, the intimate coupling between MoS2 and the highly conductive MCNs should permit efficient electrical communication between the catalytic edge sites and underlying electrode40.
Fig. 1.8 LSV polarization curves for GCEs modified with (A) MoS2/MCNs, (B) a mixture of MoS2 and MCNs, (C) pure MoS2 and (D) MCNs in 0.5 M H2SO4; scan rate: 2 mV/s40.
40 “Nanocomposite of MoS
2 on ordered mesoporous carbon nanospheres: A highly active catalyst for
18
Tab. 1.1 Summary of relevant studies on the MoS2 as a catalyst for the hydrogen evolution reaction.
Researchers Year Compound studied Relevance MoS2 structure
Jaegermann et al.12
1988
Transition metal chalcogenides
MoS2 basic structure
Topsøe et al.13 1996 MoS2 MoS2 S-Mo-S trylayers structure
Hibble et al.21 1998 MoS3
MoS3 as Mo3S9 clusters (theoretical study)
Wang et al.22 2007 MoS3
MoS3 as Mo3S9 clusters (electrochemical tests)
Laursen et al.17 2012 Molybdenum sulfides
Single/multi-layer MoS2 nanoparticles structure MoS2 as a catalyst for the HER
Nidola et al.10 1986
MoS2 pigmented NiSx coating
First time MoS2 is found active toward HER
Raybaud et al.11 2000 DFT on MoS2 MoS2 active sites are on the edges
Jaramillo et al.16 2007 MoS2 Active edge sites
Merki et al.15 2011 Mo- and W- sulfides Relation activity/ active edge sites
Yu et al.18 2014 MoS2
Relation activity/ n. of layers in MoS2 structure
19
Tab. 1.1 continued
Researchers Year Compound studied Relevance Amorphous MoSx
Merki et al.20 2011 Amorphous MoSx
Preactivation process in amorphous MoSx
Vrubel et al.19 2012 MoS2/ MoS3
Amorphous MoSx is active toward HER
MoS2 doped with transition metal ions
Brorson et al.25 2007
MoS2, WS2, Co-Mo-S,
Ni-Mo-S, Ni-W-S
Shape modifications of the MoS2 clusters due to Co/Ni
Bonde et al.31 2008
Transition metal sulfides
CoSx is active toward the HER
Merki et al.24 2012 Co-, Fe-. Ni-MoS2
Effect of transition metal dopants on activity
Ramos et al.30 2013 Co-MoS2
Co as Co9S8 in Co-MoS2, Co-Mo-S phase
Xiao et al.26 2014 Co-, Ni-MoS2
Co/Ni atoms are on the S vacancy sites
Ma et al.27 2015
Fe-embedded monolayer MoS2
20
Tab. 1.1 continued
Researchers Year Compound studied Relevance MoS2 on carbon support
Li et al.33 2011 MoS2/graphene
MoS2 on graphene active toward the HER
Bian et al.40 2012
MoS2/mesoporous carbon
MoS2 on ordered mesoporous carbon nanospheres active toward the HER
Chang et al.32 2013
MoSx on Graphene-Protected 3D Ni Foam
MoS2 on graphene active toward the HER
Laursen et al.35 2013
MoS2/carbon fiber network
MoS2 on carbon fibers active toward the HER
Lin et al.34 2013 MoS3/carbon nanotubes
MoS3 on carbon nanotubes active toward the HER
Zhou et al.38 2013
MoS2/Mesoporous Graphene
MoS2 on Mesoporous Graphene active toward the HER
Zheng et al.36 2014
MoS2/Reduced Graphite Oxide
21
1.2
HYPOTHESIS
Owing to MoS2‘s hydrogen binding energy similar to that of Pt’s, we hypothesize that enhanced level of the MoS2 catalytic activity toward the Hydrogen Evolution Reaction (HER) will be achieved by synthesizing the MoS2 as nanoparticles on a mesoporous carbon support and by doping the catalyst with particular transition metal ions (i.e. Co/Fe), so to increase the surface area while maintaining high conductivity.
1.3
OPERATIONAL STATEMENT
We decompose ammonium tetrathiomolybdate ((NH4)2MoS4) to obtain MoS3 nanoparticles via acidification reaction in liquid solution through sulfuric acid in different concentration and at temperatures between 165°C and 170°C, where also the thermal decomposition of the Mo-precursor starts. Sodium sulfide nonahydrate (Na2S∙9H2O) is added to increase the S:Mo ratio and so the yield to MoS3. The nanoparticles are synthesized on various carbon supports: Graphene Nanoplatelets (GNP), Ketjenblack EJ-300 and Vulcan XC 72R mesoporous carbon. Different solvents are studied (mostly water, ethylene glycol) to obtain different size nanoparticles in order to increase the surface area and hence the activity.
23
1.4
REFERENCES
[1] “Sustainable Hydrogen Production”, J. A. Turner, Science. 2004, 305, 972.
[2] “Chemical challenges in solar energy utilization”, N. S. Lewis and D G. Nocera, Proc.
Natl. Acad. Sci. USA. 2006, 103, 15729.
[3] “Electrolysis: the important Energy transformer in a world of sustainable Energy”, W. Kreuter, H. Hofmann, Int. Journ. Hydrogen Energy, 1998, Vol. 23, Issue 8, pp. 661-666. [4] https://www.press.bmwgroup.com/usa/pressDetail.html?title=world-s-first-public-hydrogen-fuel-station-to-open&outputChannelId=9&id=T0021884EN_US&left_menu_item =node__5236
[5] “Hydrogen Electrocatalysis”, Kibler, L. A. Chem. Phys. Chem. 2006, 7, 985−991.
[6] “Catalyzing the Hydrogen Evolution Reaction (HER) with Molybdenum Sulfide Nanomaterials” J. D. Benck, T. R. Hellstern, J, Kibsgaard, P. Chakthranont, T. F. Jaramillo, ACS Catal. 2014, 4, 3957−3971.
[7] “Hydrogen evolution across nano-Schottky junctions at carbon supported MoS2 catalysts in biphasic liquid systems” P. Ge , M. D. Scanlon , P. Peljo , X. Bian , H. Vubrel , A. O’Neill, J. N. Coleman , M. Cantoni , X. Hu, K. Kontturi , B. Liu , H. H. Girault , Chem. Commun. 2012, 48, 6484.
[8] “Molybdenum-sulfur dimers as electrocatalysts for the production of hydrogen at low