Optimization of MRR using Fuzzy logic with
TAGUCHI method for Micro- drilling
Ranadhir R Landge1, Dr. Atul B Borade 2
1
Ph.D.Research Scholar and Workshop Superintendent (Asst. Professor), Government College of Engineering, Jalgaon,
Maharashtra, India 2
Professor and Head, Department of Mechanical Engineering, Jawaharlal Darda Institute of Engineering and
Technology, Yavatmal, Maharashtra, India
ABSTRACT: Micro- drilling is the precision hole drilling technology to use in anufacturing and workshop. It is one
of the most fundamental machines technologies andit is moving high and Increasingproductivity and quality. It is an important machining process having attractive applications like Printed circuit boards, Fuel injection nozzles, Watch parts, Camera parts, Medical needles, Aeronautics., Mobile phones, Computers etcTaguchi design of experiment and analysis of signal to noise ratio has been used to evaluate optimization of Material Removal Rate. This paper presents optimization of MRR depending upon various input parameters for like speed, feed and depth of hole and tool material.Based on the Taguchi design of experiments (DOE) with orthogonal array, and then followed by optimization of the Fuzzy parametric deduction to optimize MRR.
KEYWORDS: Micro-drilling, Cutting tool,Material removal rate,Fuzzy logic,Taguchi.
I.INTRODUCTION
. Micro drilling is one of the most fundamental machines technologies and it is moving high precision and high spindle speed application in manufacturing field and increasing productivity and quality. Now a day’s micro drillings have a great use for manufacturing to apply special parts and items. Micro hole drilling is the precision hole drilling technology to use in manufacturing and work shop. The micro drill tools play a critical role is increasing the productivity of a cutting process. Although the price of a cutting tool itself is relatively low, the costs caused by tool failures are considerably higher. Therefore, from the viewpoint of cost and productivity, modeling and optimization of drilling processes are extremely important for the manufacturing industry. The poor removal of chips in deep drilling of small diameter is often the cause of tool breakage and poor quality surface. High speed machining technology, the smaller the tools, the higher the spindle speed you will need to efficiently machine quality parts and avoid tool breakage. High-frequency spindles with speed ranges.[3]
This is a conventional micro drilling processes in order to find the best quality of drilling for different types of work piece material (MS, Aluminum alloy & PCB) to using number of size of drill bit (0.5mm-0.1mm) were performed by different high spindle speed (10,000-20,000 rpm) and feed at three different levels. The results were analyzed using optimization of process parameters, MRR.[3]
Material removal rate is commonly considered as a major manufacturing goal in machining operations in many of the existing research. Taguchi method , an experiment design method, has been widely applied to many industries. It cannot only optimize quality characteristics through the setting of design parameters, but also reduce the sensitivity of the system performance to sources of variation.[19]
can be described by the collection of fuzzy control rules involving linguistic variables rather than a complicated dynamic mathematical model.[14]
II.CONSTRUCTION OF ORTHOGONALARRAYANDTAGUCHI METHOD
It is testing is a black box testing technique which is a systematic, statistical way of software testing It is used when the
number of inputs to the system is relatively small, but too large to allow for exhaustive testing of every possible input
to the systems. It is particularly effective in finding errors associated with faulty logic within computersoftware
systems. Orthogonal arrays can be applied in user interface testing, system testing, regression testing, configuration testing and performance testing. The net effect of organizing the experiment in such treatments is that the same piece of
information is gathered in the minimum number of experiments. The Taguchi method is a robust design method
technique, which will provides a simple way to design an efficient and effective experiment. In order to efficiently reduce the conventional experimental tasks, the orthogonal array by using design parameters will be proposed and adopted[15]. Using Minitab 17 for Taguchi Design of Experiment considering three input parameters , three level orthogonal array is constructed as given below intable no 1.Taguchi Orthogonal Array Design
L9(3^3),Factors: 3,Runs: 9
Columns of L9(3^4) Array,1 2 3
Speed Feed DOH
10000 0.03 0.2
10000 0.04 0.4
10000 0.05 0.6
15000 0.03 0.4
15000 0.04 0.6
15000 0.05 0.2
20000 0.03 0.6
20000 0.04 0.2
20000 0.05 0.4
Table no. 1
III.PERFORMANCE OF EXPERIMENT
Using the combinations of input parameters form orthogonal array, experiment is carried out for Aluminum material and Material Removal Rate and Machining time are recorded for nine turns.
The performance measure, signal-to-noise ratio(S/N) can be used to obtain the optimal parameter combinations. In the Taguchi method, a loss function will be defined to calculate the deviation between the experimental value and the desired value. Usually, there are three categories of the performance characteristics in the analysisofthe signal-to- noise ratio, i.e., the lower the-better, the higher the- better, and the nominal-the better .To obtain optimal machining performance, the minimum Machining time and the maximum MRR are desired. Therefore, the lower the-better MT and the higher-the better MRR should be selected. This method, the S/N ratio is used to determine the deviation of the
performance characteristic from the desired value. [5].The S/N ratio is found by using Taguchi Analysis in Minitab
17[16]
Taguchi Analysis: MRR versus Speed, Feed, DOH Response Table for Signal to Noise Ratios
Larger is better
Level Speed Feed DOH
1 37.71 38.58 40.89
2 41.23 41.08 40.89
3 43.73 43.02 40.89
Delta 6.02 4.44 0.00
Rank 1 2 3
Table.no.2
Fig.no.3
Taguchi Analysis: MT versus Speed, Feed, DOH Response Table for Signal to Noise Ratios Smaller is better
Level Speed Feed DOH
1 60.65 61.51 69.01
2 64.17 64.01 62.99
3 66.67 65.95 59.47
Delta 6.02 4.44 9.54
Rank 2 3 1
Table.no.3 Fig.no.4 20000 15000 10000 44 43 42 41 40 39 38 37 0.05 0.04
0.03 0.2 0.4 0.6
Speed M e a n o f S N r a ti o s Feed DOH
Main Effects Plot for SN ratios
Data Means
Signal-to-noise: Larger is better
20000 15000 10000 50 48 46 44 42 40 0.05 0.04
0.03 2 4 6
Speed M e a n o f S N r a ti o s Feed DOH
Main Effects Plot for SN ratios
Data Means
Speed Feed DOH MRR MT SNRA1 SNRA2
10000 0.03 0.2 58.875 0.000667 35.39862 63.52183
10000 0.04 0.4 78.5 0.001 37.89739 60
10000 0.05 0.6 98.125 0.0012 39.83559 58.41638
15000 0.03 0.4 88.3125 0.000889 38.92044 61.02305
15000 0.04 0.6 117.75 0.001 41.41922 60
15000 0.05 0.2 147.1875 0.000267 43.35742 71.48063
20000 0.03 0.6 117.75 0.001 41.41922 60
20000 0.04 0.2 157 0.00025 43.91799 72.0412
20000 0.05 0.4 196.25 0.0004 45.85619 67.9588
Table.no.4
IV. FUZZY LOGIC
Fuzzy sets are sets whose elements have degrees of membership. Fuzzy sets were introduced by Lotfi A. Zadeh and
Dieter Klaua in 1965 as an extension of the classical notion of set. At the same time, defined a more general kind of
structures called L-relations, which were studied by him in an abstract algebraic context. Fuzzy relations, which are
used now in different areas, such as linguistics decision-making (Kuzmin, 1982) and clustering, are special cases of L
-relations when L is the unit interval [0, 1]. MATLAB is a convenient Software to perform fuzzy logic methodology.
Considering Signal to noise ratios for MRR and MT within the intervals of 34 to 46 and 57 to 72 respectively as input variables and to get OPI i.e. Optimal performance Index form 0 to 1 intervals. It is carried out in following ways.[18]
1) Define the Input /Output variables.
2) Selecting the Member functions.
3) Developing fuzzy rules.
4) Defuzzification.
5) Finding OPI for respective input variables and recording in TAGUCHI Design.
6) Finding the mean .
Fig.no-5
Fig.no.6
V.RESULTS
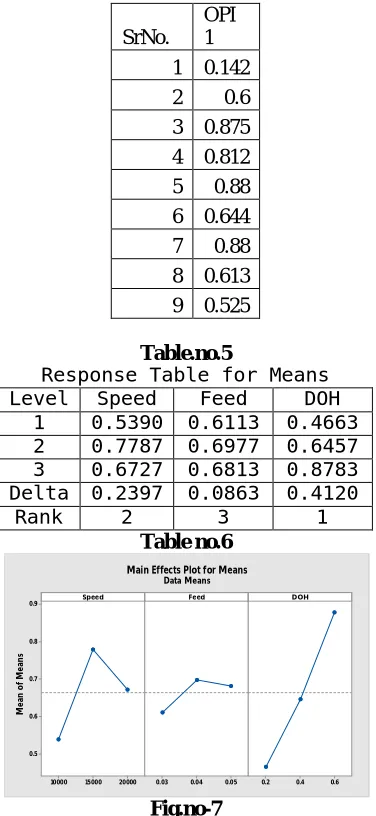
Results of OPI are recorded and response table for analysis of mean is done in TAGUCHI Analysis Taguchi Analysis: OPI 1 versus Speed, Feed, DOH
SrNo. OPI 1 1 0.142
2 0.6
3 0.875 4 0.812
5 0.88
6 0.644
7 0.88
8 0.613 9 0.525
Table.no.5
Response Table for Means Level Speed Feed DOH
1 0.5390 0.6113 0.4663 2 0.7787 0.6977 0.6457 3 0.6727 0.6813 0.8783 Delta 0.2397 0.0863 0.4120
Rank 2 3 1
Table no.6
Fig.no-7
It is found that level 2 for Speed ,level 2 for feed and level 3 for Depth of hole are optimum values which gives MRR as,
MRR= πD2 DOH/4 MT= 3.14x(0.5)2x6/4x0.01= 117.75 mm3/min
Parameters Combinations MRR
Fuzzy deducted Speed-15000,Feed-0.03,DOH-0.6 117.75 mm3/min
Benchmark parameters Speed-15000,Feed-0.03,DOH-0.4 117.16mm3/min
Table. No.7 20000
15000 10000 0.9
0.8
0.7
0.6
0.5
0.05 0.04
0.03 0.2 0.4 0.6
Speed
M
e
a
n
o
f
M
e
a
n
s
Feed DOH
VI.CONFIRMATION TEST
The optimum result is achieved by our proposing deduction optimization technique, the machining operations under both fuzzy TAGUCHIoptimization parameters and benchmark parameters; Speed(medium), Feed (medium), DOH (medium),which are often introduced into the confirmation experiment in many of the studies for comparison to the optimum parameters, are performed on the CNC Micro-drilling.It is observed that the MRR under fuzzy deduction parameters meets the benchmark parameter which is slightly more than benchmark parameters.
VII.CONCLUSIONS
In this study, the parametric deduction scheme was proposed parameters under the considerations of MRR. A confirmation experiment of the optimum deduction parameters was calculated to indicate the effectiveness of the proposed fuzzy TAGUCHIoptimization method. Through the confirmation test, the experimental results validate the potency that the MRR meets the benchmark parameters obtained from average value of parameters This type optimization will suggest the manufacturers to go fuzzy logic analysis through TAGUCHI prior to manufacturing. This gives economically excitement to manufacturing industry through the proposed development in this study
IX. ACKNOWLEDGEMENTS
The authors would like to express sincere thanks to SantGadgeBaba Amravati University for registration of this research work and also express thanks to College of Engineering and Technology,Akola for availing necessary laboratories facilities.The authors also gratefully acknowledge for necessary financial support of Government College of Engineering,Jalgaon and also grateful to Jawaharlal Darda Institute of Engineering and Technology,Yavatmal for their time to tme help.
REFERENCES
[1] Azlan Abdul Rahman,AzuddinMamat,” Effect of Machining Parameters on Hole Quality of Micro Drilling for Brass”Vol 3 no.5 pp.221-230. [2]. AshishBharti,S.K.Moulick ,(2013),” Parametric optimization of multi response factors in micro drilling operation “, International Journal of
Scientific & Engineering Research, Volume 4, Issue 7 pp-1157-1163.
[3] B.Y. Lee, H.S. Liu and Y.S. Tarng, (1996). Modeling and Optimization of Drilling Process. Department of Mechanical ManufactureEngineering, National Huwei Institute of Technology, Huwei, 632, pp. 1-9.
[4] B.Y. Lee, H.S. Liu and Y.S. Tarng, (1998). Modeling and optimization of drilling process, Journal of Materials Processing Technology, 74,pp. 149–157
[5]. B.K Hinds, G.M Treanor ,(2011)” Analysis of stresses in micro-drills using the finite element method” International Journal of Machine Tools and Manufacture.
[6] B.B.Nayak ,S.S.Mahaputra(2013)”Multi-response optimization of WEDM Process Parametersusing the AHP and TOPSIS method.”Volume-2Issue-3,pp109-115
[7] Balasubramaniyam Singaravel,Thangiah Selvaraj(2015)”Optimization of Machining parameters in turning operation using combined TOPSIS and AHP method”Technical Gazzette 22,6 pp1415-1480.
[8] Dong-Woo Kim1, Myeong-Woo Cho , Tae-Il Seo and Eung-Sug Lee (2008).” Application of Design of Experiment Method for Thrust ForceMinimization in Step-feed Micro Drill” Sensors, 8,pp. 211-221
[9]Jung Soo Nam, Pil-Ho Lee,Sang Won Lee,(2011) “Experimental characterization of micro-drilling process using nanofluid minimum quantity lubrication” 10.1016/j.ijmachtools,
[10] J. Zhang, and A. Knoll, “Designing Fuzzy Controllers by Rapid Learning,” FuzzySets and Systems, 101, 287-301, 1999
[11] .Kamal Hassan, Anish Kumar*, M.P.Garg*, (2012) “Experimental investigation of Material removal rate in CNC turning using Taguchi method “International Journal of Engineering Research and Applications Vol. 2, Issue 2pp.1581-1590
[13]. L.A. Zadeh, “Fuzzy Sets,” Information and Control, 8, 338-352, 1965
[14] L. A. Zadeh, “Outline of a New Approach to the Analysis of Complex Systems and Decision Processes,” IEEE Transactions on Systems, Man, and Cybernetics, SMC- 3(1), 28-44, January 1973.
[15] Sahoo P., Barman T. K. and Routara B. C., (2008), “Taguchi based practicaldimension modeling and optimization in CNC turning”, Advance in ProductionEngineering and Management, Volume 3, Number 4, pp. 205-217.
[16] Singh H. and Kumar P., (2006), “Optimizing Feed Force for Turned Parts throughthe Taguchi Technique”, Sadhana, Volume 31, Number 6, pp. 671–681.
[18] S.Prasad,P.Rajkhowa,N.Lahon,I.Shivkoti,P.M.Pradhan(2014),”Modelling and Optimization od EDM Process:A Fuzzy based Approach”,Volume 4,Issue 3,pp34-38
[19] Tian-SyungLan,(2011). Fuzzy Parametric Deduction for Material Removal Rate Optimization, Journal of Mathematics and Statistics,7(1), pp.51-56
[20] Ranadhir R Landge, Dr. Atul B Borade,”A review on Optimization of material removal rate in micro-drilling process “AIJRSTEM 15-178,pp165-169
[21] . Thamizhmanii S., Saparudin S. and Hasan S., (2007), “Analysis of SurfaceRoughness by Using Taguchi Method”, Achievements in Materials and Manufacturing Engineering, Volume 20, Issue 1-2, pp. 503-505.