Comparative Analysis between Static and Non
Linear Dynamic Analysis of Regular and
Irregular Building
Sneha Rajesaheb Magar
1, Varsha G. Jadhav
2, Bhise Geetika A
3,Sarade
Urmila S
4Assistant Professor, Department of Civil Engineering, MGM’s Jawaharlal Nehru Engineering College,
N-6, CIDCO, Aurangabad, Maharashtra, India1,2,3,4
ABSTRACT: The magnitude and intensity of earthquake is cannot be predict but we can reduced the damages and failure of structure by adopting plan Regularity and Irregularity. The Regular and Irregular plan of building for G+15 storey by using rectangular symmetrical and Unsymmetrical Channel shape building create models by using Etab software for study thebehavior of structure for Equivalent static and Non linear dynamic analysis i.e. Time history analysis for two different earthquake records.
In present study, Multi-storeyRegular and Irregular with different plan area for G+15 stories have been modeled using software ETABS for seismic zone IV in India. This paper studies the performance of the building static analysis and performance of building during earthquakes shakes, Kobe and Bhujbeen investigated. This paper enlightens the exactness of Time History analysis in comparison with the most commonlyadopted Dynamic analysis and Equivalent Static Analysis by using IS 1893: 2002 part 1 codal provision in Etab software with regards time period, maximum displacement, stiffness and drift.
KEYWORDS: Regular plan, Irregular plan, G+15 storey regular and irregular building,Equivalent static analysis, IS 1893:2002 part 1 provisions, Etab software.
I.INTRODUCTION
Earthquake is generated by sudden release of energy in earth’s crust that creates seismic waves. In nature, earthquake forces are accidental & uncertain natural hazards. An engineer requires the tools for analyzing structures under the effect of these types of forces. Earthquake loads are modeled to assess the action of structure with a clear understanding that hazard is to be anticipated but it should be regulated. In this paper an analytical study is made to find response of different regular and irregular structures by static and dynamic methods. The study includes the equivalent static and Non linear dynamic analysis Time History Analysis of G+15 storied regular and irregular structures in Etabsoftware. For time history analysis past earthquake ground motion record –Kobe and Bhuj is taken to study response of the structures. For analyzing seismic behavior of structures, mathematical model of the structures are required to determine the parameter is Time period, maximum displacement, storey drift and base shear in kN characteristics in various components of the structure. Behaviors of structures were found by comparing responses in the form of above parameter for regular and irregular structures.
performed to label each object separately. Finally, the set of selection criteria is applied to filter out non text regions. After text detection, text inpainting is accomplished by using exemplar based Inpainting algorithm.
II.METHODOLOGY
The seismic analyses methods so far used in estimating the demand on the structure can be classified in the following four groups
I) Linearequivalent Static Analysis II) Linear Dynamic Analysis III) Nonlinear Static Analysis IV) Nonlinear Dynamic Analysis.
It is seen from the basics of the Structural static that the response of the structure can be estimated as the sum of modal responses. For majority of the structures, consideration of first three or four modal contributions yields sufficiently accurate results. This forms the basis for all the above mentioned analysis procedures.
1.1 Equivalent static analysis: -
All design against seismic loads must consider the dynamic nature of the load. However, for simple regular structures,analysis by equivalent linear static methods is often sufficient. This is permitted in most codes of practice for regular, low- to medium-rise buildings. It begins with an estimation of base shear load and its distribution on each story calculated by using formulas given in the code. Equivalent static analysis can therefore work well for low to medium-rise buildingswithout significant coupled lateral modes, in which only the first mode in each direction is considered. Tall buildings (over, say, 45 m), where second and higher modes can be important, or buildings with are much less suitable for the method, and require more complex methods to be used in these circumstances.
1.2 Non linear time history analysis: -
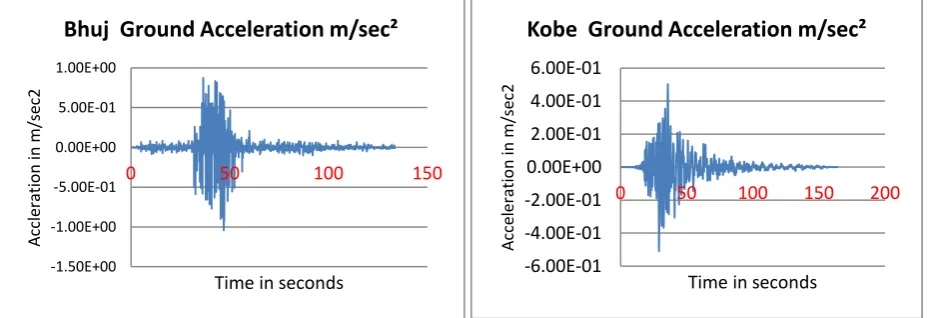
Time-History analysis is a step-by-step procedure where the loading and the response history are evaluated at successive time increments, Δt – steps and provides more detailed information regarding the seismic behavior of a structures. The most common way to describe a ground motion is with a time history record. The motion parameters may be acceleration, velocity, or displacement, or all the three combined together. Time histories of ground motions are used directly for the time domain analysis of structures subjected to deterministic seismic inputs. At any measuring station, ground motions are recorded in three orthogonal directions; two of them are in horizontal directions and the third is in the vertical direction. Thus, three components of ground motions are available from any measuring station. The Time Vs Acceleration of Kobe and Bhuj is plotted in Figure 1 and 2. The Time-History function is used to perform Linear and Non – Linear Time-History Analysis of structures to understand the actual behaviour of structures under Seismic Excitation.
Figure No. 1 Bhuj ground acceleration Figure No.2 Kobe ground acceleration
-1.50E+00 -1.00E+00 -5.00E-01 0.00E+00 5.00E-01 1.00E+00
0 50 100 150
A cc le rati o n in m/se c2
Time in seconds
Bhuj Ground Acceleration m/sec²
-6.00E-01 -4.00E-01 -2.00E-01 0.00E+00 2.00E-01 4.00E-01 6.00E-01
0 50 100 150 200
A cc el erati o n in m/se c2
III.PROBLEM STATEMENT
General
The main objective of this paper is to study the performance of structure under static and nonlinear dynamic analysis to failure of structure. For this purpose Static equivalent static Analysis and Time History Analysis is used to evaluate the real behavior of the structure.
Description of structure
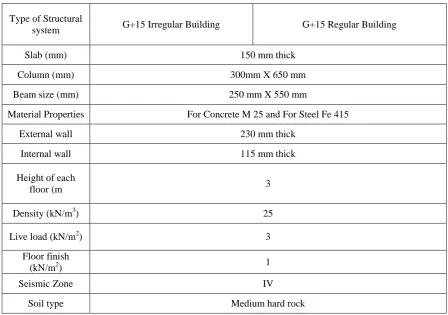
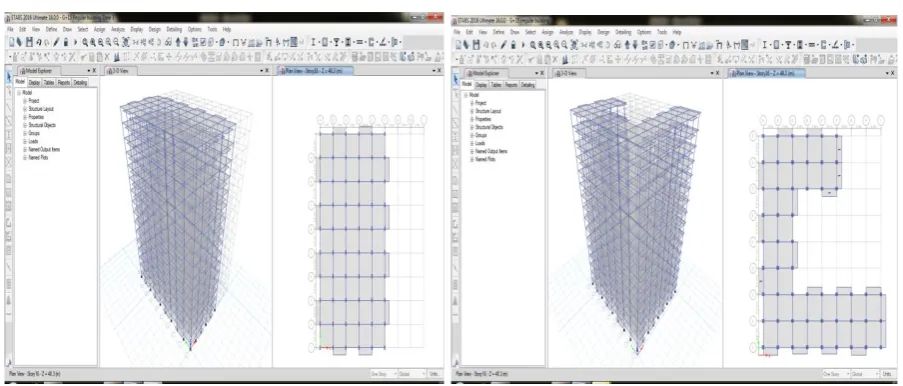
G+15 storied R.C. buildings with Case I – regular plan and Case II – Irregular plan are considered for seismic analysis. The plan and isometric view of buildings are shown in Figure No. 3 to Figure No. 4. The structural models are description is shown in Table No. 3.1.
Table 3.1: General Characteristics of the Analyzed Structural Systems
Type of Structural
system G+15 Irregular Building G+15 Regular Building
Slab (mm) 150 mm thick
Column (mm) 300mm X 650 mm
Beam size (mm) 250 mm X 550 mm
Material Properties For Concrete M 25 and For Steel Fe 415
External wall 230 mm thick
Internal wall 115 mm thick
Height of each
floor (m 3
Density (kN/m3) 25
Live load (kN/m2) 3
Floor finish
(kN/m2) 1
Seismic Zone IV
Figure No. 3.1 Regular Building Figure No. 3.2 Irregular Building Modeling of Building
For the comparative study, Regular and Irregular buildings are considered;the total plan dimension of building Regular Building is 472.5 m2 and Irregular building plan area are 357 m2.The Regular and Irregular building are different and analyzed by equivalent static analysis by IS 1893;2002 part 1and Non linear dynamic analysis method. The designation used for the building models is as given in following Table 3.2.
Table 3.2: Description of a building model
Model No. Type of Structure Designation 1 Regular Building G+15 storey Regular 2 Irregular Building G+15 storey Irregular
Above data and models are used for analysis of structures with respect to different parameters like time period, displacement against height, storey drift and base shear for static analysis. But only base shear and maximum displacement at top floor are considered for time history i.e. non linear dynamic analysis.
IV. RESULT AND DISCUSSION
Results of equivalent static analysis
1. Time period 2. Maximum displacement in X direction
Graph No.1 Modal time period in seconds Graph No.2 Maximum displacement in x direction
3. Maximum displacement in Y direction 4. Storey drift in X direction
Graph No.3 Maximum displacement in Y direction Graph No.4 Storey drift in m in X direction 0 0.5 1 1.5 2 2.5 3 3.5
0 5 10 15
Modal time period
0 20 40 60 80 100
0 20 40 60
Displacement in X Dir.
Irregular X Dir Regular X Dir
0 20 40 60 80 100 120
0 20 40 60
Displacement in Y Dir.
Irregular Y Dir Regular Y Dir
0 0.0005 0.001 0.0015 0.002 0.0025 0.003 Sto ry Sto ry 14 Sto ry 11 Sto ry 8 Sto ry 5 Sto ry 2 D ri ft in m
Storey Drift X direction
Irregular
Graph No.5Stores drift in m in Y direction Graph No. 6Storesstiffness in Kn/m in X direction
Graph No.7 Storesstiffness in Kn/m in Y direction Graph No. 8Base shear in kN in X direction 0 0.0002 0.0004 0.0006 0.0008 0.001 0.0012 0.0014 0.0016 0.0018 0.002 Sto re y Sto ry 14 Sto ry 11 Sto ry 8 Sto ry 5 Sto ry 2 D ri ft in m
Storey Drift Y direction
Irregular
Regular 1000000 0
2000000 3000000 4000000 5000000 6000000
Storey stiffness in kN/m in X Dir.
Irregular
Regular
0 1000000 2000000 3000000 4000000 5000000 6000000 7000000 8000000
Storey stiffness in kN/m in Y Dir.
Irregular
Regular
0500 1000 1500 2000 2500 3000 3500 4000 4500 5000
Irregular Regular
Graph No. 9Base shear in kN in Y direction Graph No.10Base shear in kN in X direction
Graph No. 11Base shear in kN in Y direction Graph No. 12Base shear in kN in Y direction 3976.21
3893.46
Irregular
Regular
Base shear in kN in Y Dir.
4400.20 4397.83
2424.68 2429.19
Static TH Bhuj X Static TH Bhuj X
Irregular
Regular
Comparison of Base shear in kN in between Static and TH Bhuj analysis
in X Dir.
3976.20 3974.23
3893.45 3900.46
Static
TH Bhuj Y
Static
TH Bhuj Y
Irregular
Regular
Comparison of Base shear between Static and Bhuj TH analysis in Y Dir.
4400.20 4397.83
2424.68 2443.44
Static TH Kobe X Static TH Kobe X
Irregular
Regular
Comparison of Base shear in kN between Static and Kobe TH analysis in
Graph No.13 Base shear in kN in Y direction Graph No. 14Base shear in kN in Y direction
Graph No. 15Maximum deflection in mmX direction Graph No. 16Maximum deflection in mm Y direction
4400.20 4397.83
2424.68 2443.44
Static TH Kobe X Static TH Kobe X
Irregular
Regular
Comparison of Base shear in kN
between Static and Kobe TH analysis
in X Dir.
4400.20
3974.37 3976.20 3922.39
Static
TH Kobe Y
Static
TH Kobe Y
Irregular
Regular
Comparison of Base shear in kN between Static and Kobe TH analysis in Y Dir.
89.67
41.41
78.355
38.14
Static TH Bhuj X Static TH Bhuj X
Irregular
Regular
Comparison of Deflection in mm
Satic and TH Analysis in X Dir in mm
89.67
45.82
78.355
41.87
Static TH Kobe X Static TH Kobe X
Irregular
Regular
Comparison of Deflection between
Static and TH Kobe Analysis in X Dir
Graph No. 17Maximum deflection in mm X direction Graph No. 18 Maximum deflection in mm Y direction
Discussion:
1. From Graph 1 the modal time period was decreased by 1.03% in Irregular building as compare to Regular building.
2. From Graph 2 and 3 The maximum deflection occurs in X and Y direction are increased by 12.62% and 53.36% in Irregular building as compare to Regular building respectively.
3. From 4 to 5 the maximum drift is average increascdin X and Y direction 53.25% and 53.79% Irregular building as compared to Regular building respectively.
4. From 6 to 7 the stiffness is increased in x direction and decreased in Y direction.
5. Graoh 8 to 9 the base shear are increased in X direction by 44.90% and increased in Y direction are 2.09% respectively.
6. Graph 10 to 13 th base shear are as compare with static and dynamic analysis is are shown in tabular form
Irregular Regular
Static TH Bhuj X Static TH Bhuj X
Base shear in kN 4400.209 4397.836 2424.68 2429.19
Decreased by 0.054 % Increased by 0.19%
Irregular Regular
Static TH Bhuj Y Static TH Bhuj Y
Base shear in kN 3976.21 3974.23 3893.46 3900.468
Decreased by 0.05% Increased by 0.18%
Irregular Regular
Static TH Kobe
X Static TH Kobe X
0 20 40 60 80 100 120
Static TH Bhuj Y Static TH Bhuj Y
Irregular
Regular
Comparison of Deflection between
Static and Analysis Bhuj TH in Y Dir
in mm
0 20 40 60 80 100 120
Static TH Kobe
Y
Static TH Kobe
Y
Irregular
Regular
Comparison of Deflection between
Static and TH Kobe Analysis in Y Dir
Irregular Regular
Static
TH Kobe
Y Static TH Kobe Y
Base shear in kN 4400.209 3974.375 3976.21 3922.39 Decreased by 9.68 % Decreased by 1.35%
7. Graph 14 to 18 the maximum deflection in mm are compare with static and dynamic analysis as shown tabular form
Irregular Regular
Static TH Bhuj X Static TH Bhuj X
Deflection in mm 89.67 41.41 78.355 38.14
Decreased by 46.18% 48.68%
Irregular Regular
Static TH Bhuj Y Static TH Bhuj Y
Deflection in mm 103.611 37.43 78.355 61.25
Decreased by 36.13% 78.17%
Irregular Regular
Static TH Kobe X Static TH Kobe X
Deflection in mm 89.67 45.82 78.355 41.87
Decreased by 51.10% 53.44%
Irregular Regular
Static TH Kobe Y Static TH Kobe Y
Deflection in mm 103.611 41.4 103.611 69.455
Decreased by 39.96% 67.03%
V.CONCLUSION
1. As a result of comparison between static and nonlinear dynamic analysis it is observed that the base shear obtained by static analysis are higher than dynamic analysis for irregular structure and base shear obtained by dynamic analysis are higher than static analysis for regular structure.
2. As a result of comparison between static and nonlinear dynamic analysis it is observed that the deflection obtained by static analysis are higher than dynamic analysis for irregular structure and analysis for regular structure.
4. Time History analysis is an important tool to summarised the performance of a building under a given earthquake. Seismic Analysis of structure is done by selecting an adequate record of ground motion for time history analysis.
REFERENCES
1. Indian standard code for Reinforced Concrete structure IS 456:200 2. Indian standard code for Erath resisting structure IS 1893: 2002 (Part 1)
3. RakshithGowda .K.R ,Bhavani Shankar (2014) .”Seismic Analysis Comparison of Regular And Vertically irregular RC Building with soft storey at different level”.(IJETE) International journal of emerging Technologies and Engineering. Volume 1 issue 6 .
4. Nonika.N,Mrs.GargiDandaDe . “Comparitive studies on seismic Analysis of Regular And Vertical Irregular Multistoried Building “. (IJRASET) International Journal for Research in Applied Science and Engineering Technology. Volume 3 Issue VII , July 2015.
5. Arvindreddy.R.J. Fernades. “ Seismic analysis of RC Regular and Irregular frame structures”. International Research journal of Engineering and Technology (IRJET) volume:02 Issue:05|Aug -2015.
6. Prashanth.P. Anshuman.S. Pandey .R.K. Arpan Herbert. “ Comparision of design Results of a structure designed using STAAD and ETABS software's”. International journal of civil and structural Engineering. Volume 2 , No.3 2012 Research Article.
7. HimanshuGaur , R.K. Goliya , Krishna Murari, Dr.A.K.Mullikh. “ A Parametric Study of Multi-storey R\C Buildings with Horizontal Irregularity’’. IJRET Volume:03 . Issue: 04|April 2014.
8. Yong Lu, “Comparative Study of Seismic Behavior of Mul-tistory Reinforced Concrete Framed Structures”, ASCE
9. BahadorBagheri, EhsanSalimiFiroozabad and Moham-madrezaYahyaei “Comparative Study of the Static and Dy-namic Analysis of Multi-Storey Irregular Building”, Interna-tional Journal of Civil, Environmental, Structural, Construc-tion and Architectural Engineering Vol:6, No:11, 2012
10. Arvindreddy and R.J.Fernandes “Seismic analysis of RC regular and irregular frame structures”,IRJET
11. Santosh Kumar Adhikari1, Dr K. Rajasekhar “Comparative Static and Dynamic Study on Seismic Analysis of Uniform and Non Uniform Column Sections in a Building”, IJIRSET
12. IS 1893 (Part 1): 2002 Indian Standard Criteria for Earth-quake Resistant Design of Structures, Part 1 General Provi-sions and Buildings, (Fifth Revision)
13. IS 875 (Part 2): 1987 Indian Standard Code of Practice for Design Loads (Other Than Earthquake) for Buildings and Structures, Part 2 Imposed Loads. (Second Revision)