Location based Big Data Visualization
Techniques and Challenges
Shivasakthi Nadar, Narendra Gawai
Final Year M. Tech Student, Dept. of Computer Science & Technology, UMIT, S.N.D.T University, Mumbai, India
Assistant Professor, Dept. of C.S.T, UMIT, S.N.D.T University, Mumbai, India
ABSTRACT: Due to increased and varying size of Big Data it becomes difficult to store, process and analyze. The size
of big data can be petabytes (1,024 terabytes) or exabytes (1,024 petabytes) of data consisting of billions to trillions of records of millions of people—all from different sources (e.g. Web, sales, customer contact center, social media, mobile data and so on).
So the processing of data is done by visualizing it. Big data visualization is useful analyzing different types of big data. There are several limitations of big data visualization using traditional reduction methods like sampling , filtering and aggregation. The limitations are over plotting, crowding , Information Loss of data. These limitations can be overcome using map reduce technique. Also map reduce is an efficient methodology to handle big data.
This paper describes the implementation of Big Data visualization using map reduce technique. The data is acquired/extracted from MongoDB and then visualized on Google map considering longitude, latitude data and also it is rendered using graph, pie charts.
KEYWORDS: Aggregation, Big Data, Map Reduce, Visualization.
I. INTRODUCTION
Big Data Visualizations help people see things that were not obvious to them before. Even when data volumes are very large, patterns can be spotted quickly and easily. It convey information in a universal manner and make it simple to share ideas with others. Usually, under the term of Big Data we understand a large data set, with volume growing exponentially. This data set can be too large, too “raw”, or too unstructured for classical data processing methods, used in relational data bases theory. Still, the main concern in that question is not the data volume, but the field of application of that data .The Big Data processing is not a trivial task at all, and it requires special methods and approaches. Graphical thinking is a very simple and natural type of data processing for a human being, so, it can be said, that data representation is an effective method, which allows for easing data understanding and provides enough support for decision making. But, in case of Big Data, most of classical data representation methods become less effective or even not applicable for concrete tasks. Analysis of applicability for one of the concrete classes of Big Data is a typical problem of subject area.
Big Data visualization plays an important role in data analysis workflows. It enables data analysts to effectively discover patterns in large datasets through graphical means, and to represent these findings in a meaningful and effective way.
To make a decision for classification to one of described Big Data classes, method needs to be analyzed from the following points: applicability for a large volume data, possibility of data visualization, presented in different data formats, speed, and performance of data presentation.
Big Data Visualization Challenges
3.1 Overplotting, crowding
Google Map deals with crowded markers and it leads to over plotting and crowding. Due to this, the analyst faces problem in analyzing the data.
3.2 Information Loss
On the other hand, the approaches end up in reduction of visible data sets can be used. It leads to another problem which is information loss. These approaches operate with data aggregation and filtration, based on the relatedness of objects in concrete dataset by one or more criteria. It can mislead the analyst, when he cannot notice some interesting hidden objects, and, sometimes, complex aggregation process can consume a large amount of time and performance resources in order to get the accurate and required information[1].
3.3 Perceptual
The simple presentation of whole array of data, being studied, can become a total mess on a screen, we will see only one big spot, consisting of points, which represents each data row. This problem comes from the fact that most of the objects in dataset are too relative to each other, and on the screen watcher cannot divide them as separate objects. So, sometimes, the user cannot get even a bit of useful information from whole data visualization without any preprocessing tasks. It must be mentioned that it is just should be thought of as a phenomenon of data visibility loss[1].
3.4 Interactive scalability
The graphical analysis does not stop on only static visualization, so the above problems become more significant in dynamic visualization. And there is also another problem, which can be hardly noticed in static visualization, because of lower visualization speed requirements , high performance requirement[1].
II. RELATED WORKS
In [2] authors have built a scalable system that implements a model which supports interactive response times, makes use of an adaptive level-of-detail rendering strategy to generate clutter-free visualization for large results and shows hidden details to the users in a summary through the use of overlay heat maps. In [3] authors have developed an open-sourced Online Indexing and Querying System for Big Geospatial Data, sksOpen integrated with the TerraFly Geospatial database and it provides ergonomic visualization of query results on interactive maps to facilitate the user‟s data analysis. In [4] author has developed approach based on enterprise mash up for delivering real-time interactive visual analysis application on spatial-temporal datasets over the Internet.
III. EXISTING TECHNIQUES
A browser-based visual analysis system that uses WebGL for data processing and rendering the visualization. Uses various data reduction method such as Data filtering , sampling and aggregation[5] .
Data sampling
Data filtering
Data filtering is removing information that is useless to a reader or information that can be confusing. It means the data sets are refined into simply what a user (or set of users) needs, without including other data that can be repetitive, irrelevant or even sensitive. Generated reports and query results from database tools often result in large and complex data sets. Redundant or impartial pieces of data can confuse or disorient a user. Filtering data can also make results more efficient[5].
Data aggregation
Data aggregation is any process in which information is gathered and expressed in a summary form, for purposes such as statistical analysis. Data aggregation personnel is helpful to find relevant search query data and present data findings in a summarized format that is meaningful and useful for the end user or application[5].
IV. PROPOSED SYSTEM
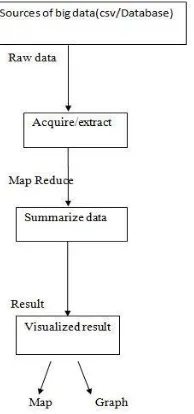
The block diagram of the proposed system is similar to that of the existing system where the data reduction method like sampling , filtering and aggregation of the extracted /acquired data is replaced with map reduce technique to get the summarized data and then is resulted into visualized data.
Fig. 1: Block diagram of the proposed system .
Architecture of the Proposed system
renders a chart. Python provide enhanced user interface, enables programmatic access to computation object within a host environment.
Fig 2: Architecture of the Proposed system
Technology used
Technologies used in the system include technologies for specifying semantic information and associating styles ( HTML, CSS), server-side technologies for retrieving information and generating content dynamically (e.g. Python) and client-side technologies for enabling user interaction (e.g. JavaScript, applets, browsers and geobrowser applications). we have our dataset, we will store the data into a database called MongoDB. It is a schema less database, which provides more flexibly in storing records of different formats in the same database. Python Flask is used for building a server that interact with MongoDB and render the html page that contains our charts. Flask is one of the most popular web frameworks for Python. The Visualization dashboard is generated by keen.io templates. The grid element, embedded directly in the HTML or added with JavaScript. Visualizations are handled by the Keen IO JavaScript SDK,that uses data from mongodb. The dashboard is so responsive and useful for analytics and makes data analyst easy to analyze the large records of data.
Google Map
Google map is an interface that we have used for mapping the locations of customer (longitude , latitude data) from csv file. Steps to activate Google map-
1)Activate the Google Maps JavaScript API 2)Get an API key
MapReduce
MapReduce is a programming model and an associated implementation for processing and generating large data sets. Users specify a map function that processes a key/value pair to generate a set of intermediate key/value pairs, and a reduce function that merges all intermediate values associated with the same intermediate key[6].
The term Map Reduce denotes the two main tasks that programs perform. The first task, Map, takes a set of data and converts it into another set of data, where individual elements are broken down into tuples (key/value pairs). The Reduce task takes the output from a Map as input and combine s those data tuples into a smaller set of tuples In the Reduce( ) function, the results are added up to form the final result which is output[8].
In the MapReduce paradigm, the Map function performs filtering and sorting, while the Reduce function carries out grouping and aggregation operations. The Reduce function is responsible for aggregating information received from Map functions. It groups by the result and sums the values received .
For those keys that have multiple values, it applies the reduce phase, which collects and condenses the aggregated data and then the store the results in a collection. Optionally, the output of the reduce function may pass through a finalize function to further condense or process the results of the aggregation. All map-reduce functions are JavaScript and run within the process.
Fig 3: Queries on Map Reduce
In our project we have applied the map phase to the input value “Product_id” in the collection. The map function emits key pair value i.e. function(key,values). For those keys that have multiple values, it applies the reduce phase,
V. IMPLEMENTATION DETAILS
1) Input Data
The Big Data Analyst will extract the data from the database of sales data . There will be 1000 records in Big data. Since the data is bulkier , it is so called the big data. The next step would be the reduction of these bulkier data, data is in csv file format.
2) Map Reduce Algorithm
The MapReduce algorithm is a mainstay of many modern "big data" applications. In our system the Map Reduce algorithm plays the role of data reduction method . To reduce the data the steps need to be followed are[8]:
i) Map reduce requires three input arguments:
They are a database to read data from, a "mapper" function and a "reducer" function .
ii) Use of keys in Map Reduce
The map reduce function automatically manages the data movement between the map and reduce phases of the algorithm. It filters, reduces the data.
iii) Visualization Result
We are implementing the system using leaflet a modern open-source JavaScript library for desktop, mobile-friendly interactive maps. Leaflet is designed with simplicity, performance and usability in mind. It works efficiently across all major desktop and mobile platforms out of the box, taking advantage of HTML5 and CSS3 on modern browsers like Firefox , chrome while still being accessible on older ones. We render the reduced sales data on a map. The system supports density summary visualization or heat maps. To perform the computation and render visualizing the required attributes of sales data to HTML5 canvas elements(basically the visualized graph). We use Leaflet to display the reduced data generated from the map reduce technique on the map view and D3 to render label. On the map , Big data analyst can visualize data in graphical form like bar diagram and pie charts .This feature is very useful to any Big data analyst who wants to analyse sales data on hourly , daily , monthly etc basis. The graphs takes data from database and changes dynamically rather than being plain static graphs. Also Pie charts are helpful for efficient data analysis.
Steps for implementation of the Proposed System
1. Consider the collection of large data set in the open software MongoDB that uses the NoSQL Query Processing. The data set is initially stored in CSV file and then imported to mongo server using python script.
Sample data set used is an organization sales data 2009.
2. In the large data set the MapReduce functions are performed only on the collection of few record/tuples (for Example: 1000 records at a time)
i. First the map function is performed on longitude and latitude data where the number of values are mapped to the same keys
ii. Then reduce function is performed for the same keys in order to combine the values at one place. 3. The steps (i) and (ii) performed until the data set is completely reduces.
4. Then the resultant reduced data set are mapped/ visualized on Google map.
VI. EXPERIMENTS AND RESULTS
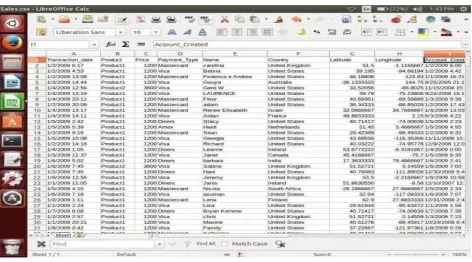
The Sample Data set is a Sales Data of an organization consists of 1000 records and its attributes are Transaction_date, Product, Price, Payment Type , Latitude and Longitude Data.
Fig 4: Sample of Sales data in CSV format
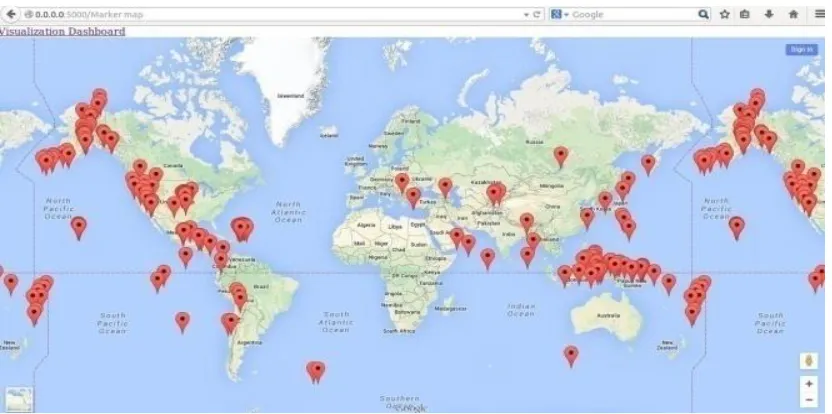
Fig 5: Big Data Visualization Dashboard
The visualized data shows the sales of the organization in the January 2009 all over the world. Location of the customer purchased their products. Also this is helpful in extracting the patterns like
1)Identify areas that need attention or improvement. 2)Predict sales volumes.
3)Discover how to increase revenues or reduce expenses.
Fig 7: Visualized Reduced data
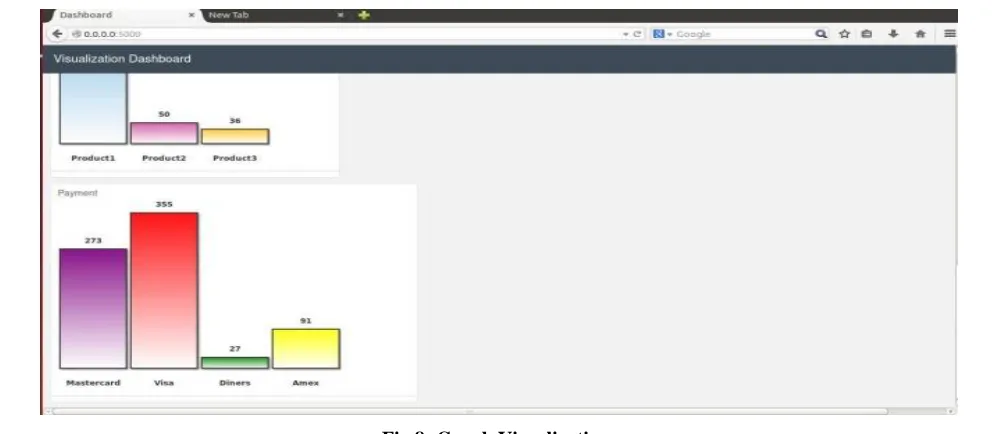
Graph visualization is useful for data analyst to find out sales of Product 1, Product 2 and Product 3. It represents the information for the sales of the Product type as well as the sales happened via Payment type in the January 2009 of an organization.The Payment type graph shows the data analyst the payment mode used by the customers all over the world. To analyse the type of cards (Master card, Visa, Amex, Diners )used by the customer mostly. This helps the data analyst to understand the customers behavior, to predict the sales volume and gets the idea to improve the sales and productivity, revenue of the organization.
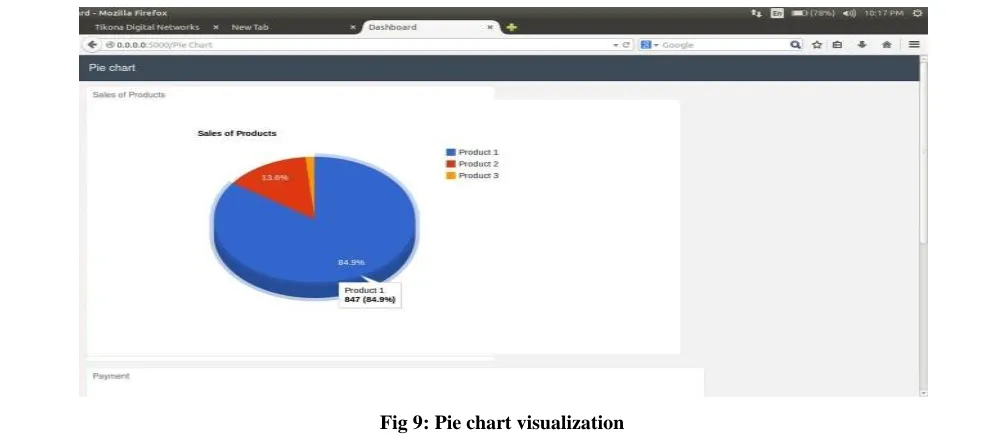
Another type of visualization is Piechart visualization. It represents the information for the sales of the Product type with its percentage. It helps data analyst to analyze the data in the easier way.
Fig 9: Pie chart visualization
Big Data Visualization Implications
1) More Than One View per Representation Display-
Representing the data in the map, graph and pie chart view. In the map view they are categorized as Marker view and Heat Map View. The graph can be a bar graph, pie chart. It is generated using HTML 5 canvas javascript. So the analyst might be interested in comparing totally different visualizations of the same data, so the whole process of visual analysis would be easy[4].
2) Big Data Visualizations plays a very crucial role in modern journalism.
3) Big Data Visualization in Public Health for prevalence of Diabetes and HIV rate reports. It allows sharing and communicating information on population health to a wide audience (decision-maker , policy maker, health professional and the general public). Visual analytics play a key role for assessing and monitoring the population health.
VII. CONCLUSION AND FUTURE SCOPE
The MapReduce Paradigm used in big data visualization has proved to be very efficient methodology for retrieving results of the large dataset. The use of the summation concept into MapReduce helps to further increase the efficiency. The execution of the very large database in mongo server improved the performance. The MapReduce framework in Mongo DB, thereby improving the results. This actually works better than the previously proposed methodologies of traditional sampling, filtering and aggregation technique. The limitations of the system is it visualizes only Structured Big Data. As a future scope, the project further can be extended to visualize the Unstructured Big Data.
REFERENCES
[1] Evgeniy Yurevich Gorodov and Vasiliy Vasil‟evich Gubarev “Analytical Review of Data Visualization Methods in Application to Big Data”, Journal
[2] Nivan Ferreira, Jorge Poco, Huy T. Vo, Juliana Freire, and Claudio T. Silva : Visual Exploration of Big Spatio-Temporal Urban Data: A Study of New York City Taxi Trips, IEEE Transactions on Visualization and Computer Graphics, VOL. 19, NO. 12, DECEMBER 2013.
[3] Yun Lu, Mingjin Zhang, Shonda Witherspoon, Yelena Yesha, Yaacov Yesha, Naphtali Rishe sksOpen: Efficient Indexing, Querying, and Visualization of Geo-spatial Big Data, 12th International Conference on Machine Learning and Applications, 2013
[4] Tao Yu, Qiming Chen, Qinghu Li, Rui Liu, Weihong Wang, Wei Liu HP Labs, China : A System for Web-based Interactive Real-time data Visualization and Analysis, IEEE Conference on Commerce and Enterprise Computing 2009.
[5] Zhicheng Liu, Biye Jiangz and Je_rey Heer, Immens: Real time visualization of Big Data,Department of Computer Science, Stanford University,Eurographics Conference on Visualization (EuroVis) 2013.
[6] Dunlu Peng, Kai Duan and Lei Xie N. Andrienko and G. Andrienko, Improving the Performance of Aggregate Queries with Cached Tuples in MapReduce, International Journal of Database Theory and Application Vol. 6, No. 1, February, 2013
[7] S. Rinzivillo, D. Pedreschi, M. Nanni, F. Giannotti, N. Andrienko, and G. Andrienko. Visually driven analysis of movement data by progressive clustering. Information Visualization, 7(3):225239, June 2008.
[8] Dr. Siddaraju, Sowmya C , Rashmi K, Rahul M. ,Efficient Analysis of Big Data Using Map Reduce Framework ,International Journal of Recent Development in Engineering and Technology Volume 2, Issue 6, June 2014
[9] Katarina Grolinger , Michael Hayes , Wilson A. Higashino Alexandra L'Heureux David S. Allison Miriam A.M. Capretz, „Challenges for MapReduce in Big Data‟ Electrical and Computer Engineering Publications 2014.
[10] Rishe, N., Gutierrez, M., Selivonenko, A., Graham, S. (2005). TerraFly: A tool for visualizing and dispensing geospatial data. Imaging Notes, 20(2), 22-23.
[11] Unwin A., Theus M., Hofmann H.: Graphics of Large Datasets: Visualizing a Million, 1 ed. Springer, July 2006. [12] Heer J.: Interactive dynamics for visual analysis. Queue 10, 2 (2012)
BIOGRAPHY
Narendra Gawai received his B.E. in Computer Engineering from Government College of Engineering, Amravati,
Amravati University, M.E. from VJTI, Mumbai University, Maharashtra, India. He is currently working as Assistant Professor at UMIT, SNDT Women‟s University, Mumbai. He has 15 years of teaching experience. He has guided several undergraduate projects. His areas of interests are Systems Security, Digital Forensics, Big Data Analytics, Data Warehousing and Data Mining.