ECG Noise Removal by Selection of Filter
from Set of Filters Using Fuzzy Logic
Preeti saini
1, Sonia saini
2M. Tech Student, Dept. of Electronics and Communication Engineering, JMIT Radaur, India1 Assistant Professor, Dept. of Electronics and Communication Engineering, JMIT Radaur, India2
ABSTRACT: Electrocardiogram (ECG) is an electrical signal used for measuring electrical activity and abnormalities of the heart on the body surface via electrodes (leads). It is the graphical record of measuring change of electrical potential with respect to time. The ECG signal is very sensitive in nature, even a very small noise can affect the ECG signal ie, changes the various features of ECG signal. Therefore, for early diagnosis of heart diseases it is required to reduce the noises. This paper presents the performance of removal of noises like power line interference, baseline wander, white noise and EMG noise by selection of filters with the help of fuzzy logic. The parameters studied are MSE, PSNR, SNR and %PRD. The original ECG signal and noises are generated using MATLAB. For implementation, graphical user interface (GUI) tool is used under MATLAB software.
KEYWORDS: Electrocardiogram (ECG), Peak Signal to noise ratio (PSNR), Mean square error (MSE), Percentage root mean square difference (%PRD), Graphical User Interface, Powerline Interference.
I. INTRODUCTION
Electrocardiogram (ECG) is one of the most commonly used health monitoring and sign sensing method. It provides recordings of hearts electrical potential with respect to time [1]. The ECG signal comprises of P wave followed by QRS complex, T wave and a U wave. The cardiac diseases are detected by ECG signal recordings. The ECG signal is corrupted by different artifacts and causes problem in diagnosis of heart diseases. Therefore, for easy evaluation and interpretation it is required to separate original ECG signal from the artifacts [2]. The various artifacts which corrupts the ECG signal are power line interference , baseline wander, electrode contact noise, motion artifacts, muscle contraction, instrumentation noise etc. ECG signal is a non-stationary signal its frequency range is generally from 0.05Hz to 100Hz [3].
We have used Graphical User Interface (GUI) tool under MATLAB software. The performance parameters for different noises are Mean Square Error (MSE), Peak Signal to Noise Ratio (PSNR), Signal to Noise Ratio (SNR) and Percentage Root Mean Square Difference (%PRD). The proposed method shows better result than LMS and NLMS Filter.
A. Different Types of ECG Artifacts
There are different types of artifacts which contaminates the ECG signal are as given below [4]. 1) Power Line Interference
It comprises of 50/60Hz pickup and harmonics. The range of frequency is 60 Hz (USA) and 50 Hz (INDIA) and the amplitude is 50% peak to peak ECG signal.
2) Base Line Wander
Respiration and patients movement causes baseline wander. The amplitude is 15% peak to peak ECG amplitude. The frequency range of ECG signal is 0.15 Hz to 0.3Hz. It is defined as continuous drifting of ECG signal from base line
3)
Electromyography Noise (EMG )4) White Gaussian Noise
It is the special case of Gaussian noise, statistical in nature. Probability density function is equal to that of normal distribution, called as Gaussian distribution. Values of this type of noise are being Gaussian distributed. White noise describes the correlation of noise [8].
II. RELATED WORK
Uzzal Biswas and Md. Maniruzzaman [10] summarized the work by removing the power line interference noise from the ECG signal by using two adaptive filters such as NLMS and RLS, then comparison is made with the notch filter. The 13-bit ECG signal of four patients is taken from the MIT-BIH arrhythmia database. Results are compared using performance matrices such as SNR, PRD and MSE. Conclusion is made based on parameters that NLMS removes noise more effectively and appropriate than RLS and notch filter. S. A. Anapagamini and R. Rajavel [2] proposed their work by removing two noises such as PLI and baseline wander by using empirical mode decomposition (EMD). In EMD algorithm, the ECG signal is decomposed into sum of intrinsic mode functions (IMF) and a final residue. As the first IMF contains the PLI interference therefore, PLI is removed by passing the first IMF through FIR low pass filter. The ECG signal is taken from the MIT-BIH database. For comparison RMSE parameter is used. Rinky Lakhwani et al.[1] implemented by designing of filters such as Rectangular , Kaiser, Gaussian and hamming window with order of 56 and 100 using FDA tool in MATLAB for the base line wander noise removal. Kaiser window with an order of 56 gives the best result. Maryam Butt et al. [11] proposed a SSRLS algorithm in order to remove 50 Hz PLI noise from the ECG signal. Clear ECG signal is obtained by subtracting the PLI reduced by SSRLS from the noisy ECG signal. Comparison is made with the notch filter (A and B) and the result shows that the SSRLS based filter is better than notch filter. Syed Zahurul Islam et al. [12] made a discussion about ECG noise removal using two adaptive algorithms- the LMS and the RLS. The noises that are removed are PLI, motion artifacts, muscle contraction and base line drift. Convergence property, computation time, correlation coefficients are studied and conclusion is made that RLS filter is better than LMS filter unless computation time is of great concern. Uzzal Biswas, Anup Das et al. [6] proposed their work by using LMS and NLMS filter in order to remove different noises. Performance parameters used are SNR, PRD & MSE. Different visual parameters are also shown. The output reveals that NLMS filter is more appropriate and effective than LMS filter for removing various noises.
III.MATERIALS AND IMPLEMENTATION TECHNIQUES
The original ECG signal is generated by using MATLAB. The EMG noise, baseline wander, power line interference and white noise are also generated by using MATLAB.
A. Filters Used in Design
The various adaptive algorithm filters and digital filter used to remove noise from the ECG signal in the proposed work are LMS, NLMS, RLS, Notch Filter and Lowpass Filter. In adaptive filtering, coefficients of filter changes over time. In order to minimize the error it adapts the changes in the signal characteristics as the name suggests. Various applications include noise cancellation, system identification, frequency tracking and channel equalization [5]. Block diagram for adaptive filtering process is as shown below [3]
Fig. 1 Adaptive filter
e is the output given by e = X + N – y
Power of e signal is given as
𝑒2 = 𝑋2 + (𝑁 − 𝑦 )2+ 2𝑋 𝑁 − 𝑦
Then,
𝐸(𝑒2 ) = 𝐸(𝑋2 ) + 𝐸(𝑁 − 𝑦 )2+ 2𝐸𝑋 𝑁 − 𝑦
𝐸(𝑒2 ) = 𝐸(𝑋2 ) + 𝐸(𝑁 − 𝑦 )2
Energy with minimum error is given by
𝐸(𝑒2 )
𝑚𝑖𝑛 = 𝐸(𝑋2 ) + 𝐸(𝑁 − 𝑦 )2𝑚𝑖𝑛
(e - X) = (N - y) therefore,(𝑒 − 𝑋)2 is also minimized.
By minimizing the noise energy we can minimize the total output energy [6].
1) LMS
Least-mean-square-algorithm produces least mean square of the error signal. According to LMS algorithm the update weight is given by
𝑊𝐾+1 = 𝑊𝐾+ 2µ𝑒𝐾𝑋𝐾
µ is an appropriate step size between 0 to 0.2. Coefficients fluctuate due to the larger step size.
2) NLMS
The problem of gradient noise Amplification can be simplified by the algorithm called as the NLMS algorithm. This variant of the LMS algorithm with normalization of step size is called normalized-least-mean-square algorithm (NLMS).
According to the NLMS algorithm, the update weight is given as 𝑊𝐾+1 = 𝑊𝐾+ 𝛽 𝑋𝐾∗
+ ǀǀ𝑋𝐾ǀǀ2 𝛽 is the normalized step size between 0 to 2 [6].
3) RLS
RLS algorithm is based on the least squares method [9]. The RLS algorithm aims at minimizing the weights least error. The summary of RLS algorithm as follows
𝑅𝐿𝑆= 𝑛 𝑛 −1ǀ𝑒(𝑛)ǀ2
𝑙=0
=
𝑛 −1ǀ𝑑
𝑛− 𝑤𝑛𝑇𝑥𝑛ǀ2 𝑛
𝑙=0
where 0< λ ≤1is the exponential forgetting factor. The RLS algorithm operates in three steps at each recursion
𝜋𝑛=
𝑃𝑛 −1𝑥𝑛
+𝑥𝑛𝑇𝑃𝑛 −1𝑥𝑛
𝑤𝑛 = 𝑤𝑛 −1+ 𝜋𝑛(𝑑𝑛− 𝑤𝑛 −1𝑇 𝑥𝑛)
𝑃𝑛 =−1𝑃𝑛 −1−−1𝜋𝑛𝑥𝑛𝑇𝑃𝑛−1
with P0=ρ-1I, where ρ is a small positive constant.
4) NOTCH FILTER
A Notch filter is a filter having deep notches and frequency response characteristic with nulls .Various applications of notch filter are harmonics elimination in instrumentation and recording systems, noise removal etc. The system function for notch filter is given by
H(z) = 1−2 cos 𝑧
−1+𝑧−2
1−2𝑟𝑐𝑜𝑠 𝜃 𝑧−1+ 𝑟2𝑧−2
Where denotes angle of pair of complex zeros placed on unit circle in the z plane and r denotes the radius of pair of complex poles placed with the same angle as the zeros.
5) LOWPASS FILTER
B. Flow Chart
In this proposed algorithm, we have used selection of filters from the set of filters such as Least-mean-square filter (LMS), Normalized-least-mean-square filter (NLMS), Recursive-least-squares filter (RLS), Notch Filter and Lowpass filter etc using fuzzy logic to get clear ECG signal. The decision making tool that is used for the analysis of varying parameters is fuzzy rule based system. It is useful in making decision for the system. In Fuzzy, rule set is added for selection of filters for different noises and decision is made based on the rule set. Instead of using single filter for all the noises, combination of different filters is used for different noises based on selection. Power line interference (PLI), Baseline wander, white Gaussian noise and EMG noise are used in the study.
Fig. 2 Flow chart of proposed work
IV.SIMULATION RESULTS AND DISCUSSION
As the noise present in the ECG signal is the major issue in the field of biomedical. PLI noise is added is as shown in the figure 3(a), 3(b), 3(c). Figure 3(a) shows the PLI interference removed using adaptive LMS filter.
Start
Get Original ECG Signal
Select Noise
Get Mixed Signal After Adding Noise
Create the Fuzzy Rule Sets For Different Noises
Select the Appropriate Filter from the Following Set of Filters
LMS
NLMS
RLS
NOTCH FILTER
LOWPASS FILTER
n
Filter the Noise Using Appropriate Filter
Get Denoised Signal
Use Original Signal & Denoised Signal to get Performance Matrices
PSNR, MSE, %PRD, SNR
Fig. 3(a) PLI noise removal using LMS filter
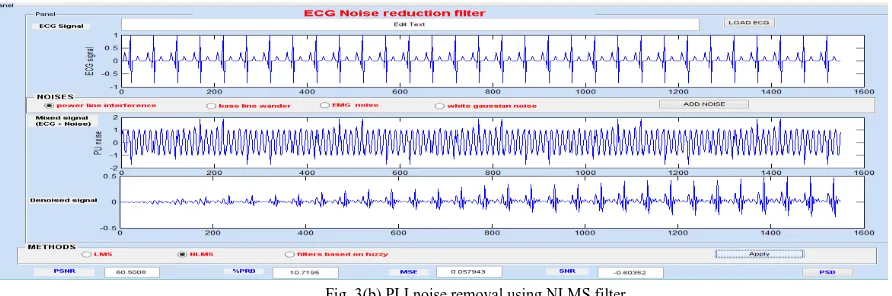
The ECG signal of 50Hz and PLI interference of 50 Hz is generated by MATLAB. NLMS filter is used for the PLI noise removal as shown in figure 3(b) below.
Fig. 3(b) PLI noise removal using NLMS filter
Figure 3(c) shows the use of fuzzy based filter. The combination of filters selected for PLI are LMS and RLS using fuzzy are as shown. The proposed technique shows better result than LMS and NLMS.
Fig. 3(c) PLI noise removal using filters based on fuzzy
Fig. 3(d) Base line wander noise removal using LMS filter
Adaptive NLMS filter is used to remove baseline wander is shown in figure 3(e).
Fig. 3(e) Base line wander noise removal using NLMS filter
Figure 3(f) shows the use of fuzzy based filter. The figure shows the improved ECG signal of proposed technique than LMS and NLMS.
Fig. 3 (f) Base line wander removal using filters based on fuzzy
Fig. 3(g) EMG noise removal using LMS filter
Figure 3(h) shows the use of NLMS filter for removing 300Hz EMG noise.
Fig. 3(h) EMG noise removal using NLMS filter
Figure 3(i) shows the output of proposed work which removes noise better by using combination of filters (notch filter and low pass filter) selected by fuzzy logic. Quality of image is improved in the proposed technique than the adaptive filters
Fig. 3(i) EMG noise removal using filters based on fuzzy
Fig. 3(j) White noise removal using LMS filter
Adaptive NLMS filter is used to remove white noise is shown in figure 3(k). As NLMS filter gives better result than LMS filter.
Fig. 3(k) White noise removal using NLMS filter
The output of the proposed technique is as shown in figure 3(l). In the rule set the filters used to remove white noise is NLMS and RLS filter. Better image of ECG signal shows that the proposed technique is more better and efficient than NLMS and LMS filters.
Fig. 3(l) White noise removal using filters based on fuzzy
following four noises. Low MSE and %PRD, high SNR and PSNR shows that the proposed approach is more effective and optimum technique than LMS and NLMS.
NOISES FILTERS PSNR %PRD MSE SNR
Power line interference
LMS 60.2991 10.9714 0.060698 -0.80523
NLMS 60.5008 10.7195 0.057943 -0.60352
Filters using fuzzy 62.3609 8.653 0.051535 1.243
Baseline wander
LMS 60.3357 10.9252 0.060188 -0.76863
NLMS 60.6348 10.5553 0.056182 -0.46945
Filters using fuzzy 64.1267 6.8872 1.8173 1.243
EMG Noise LMS 60.4498 10.7827 0.058628 -0.65453
NLMS 60.6276 10.5642 0.056276 -0.47672
Filters using fuzzy 60.8745 10.2681 0.053166 -0.22984
White Noise LMS 60.2348 11.0528 0.061602 -0.86945
NLMS 60.4657 10.7629 0.058413 -0.63858
Filters using fuzzy 61.9384 9.0851 0.056889 0.81895
Table 1 Performance Parameters in terms of PSNR, %PRD, MSE, SNR
PSD is a visual parameter used to evaluate the performance of the techniques applied for reducing noise from the mixed noisy ECG signal. The PSD of noisy ECG, LMS, NLMS and filters based on fuzzy is as shown in figure 4(a), 4(b), 4(c) and 4(d) respectively.
Fig. 4 (a) PSD of mixed EMG signal (300 Hz) Fig. 4 (b) PSD of LMS filtered signal
Fig. 4 (c) PSD of NLMS filtered signal Fig.4 (d) PSD of filtered signal based on fuzzy
V. CONCLUSION
All the three filtering techniques, LMS, NLMS and selective filter using fuzzy reduces the noises ie, PLI, baseline wander, EMG noise and white noise from the ECG signal. The different parameter like low MSE and %PRD, high SNR and PSNR shows that the proposed approach is more effective and optimum technique than LMS and NLMS. The PSD graph shows better result for the proposed approach than LMS and NLMS.
REFERENCES
1. Rinky Lakhwani, Shahanaz Ayub, J.P Saini, “design and comparison on digital filters for removal of base line wandering from ECG signal”, 5th international conference on computational intelligence and communication networks, 978-0-7695-5069-5/13, 2013. 2. S. A. Anapagamini and R. Rajavel, “Removal of Artifacts in ECG using Empirical Mode Decomposition”, International conference on
Communication and Signal Processing, IEEE, 978-1-4673-4866-9/13, 2013.
3. Md. Maniruzzaman, Kazi Md. Shimul Billah, Uzzal Biswas, and Bablu Gain, “ least-mean-square algorithm based adaptive filters for removing power line interference from ECG signal”, ICIEV, IEEE,978-1-4673-1154-0/12, 2012.
4. Smita Kasar, Abbhilasha Mishra , Madhuri joshi, “Performance of digital filters for noise removal from ecg signals in time domain”, International journal of innovative research in electrical, electronics, instrumentation and control engineering vol. 2, issue 4, april 2014. 5. Paulo S.R.Diniz,2008, “Adaptive Filtering Algorithm and Practical Implementation”, Springer, 3rd edition, 2008.
6. Uzzal Biswas, Anup Das, Saurov Debnath, and Isabela Oishee, “ ECG Signal Denoising by Using Least-Mean-Square and
Normalised-Least-Mean-Square Algorithm Based Adaptive Filter”, 3rd international conference on informatics, electronics & vision, IEEE, 978-1-4799-5180-2/14, 2014.
7. SarangL. Joshi, Rambabu A.Vatti, Rupali V.Tornekar, “A Survey on ECG Signal Denoising Techniques”, International Conference on Communication Systems and Network Technologies, IEEE, 978-0-7695-4958-3/13, 2013.
8. Astola, j., Kuosmanen, p., “Fundamentals of nonlinear digital filtering”.
9. Wolfgang Fohn and Jörn Matthies, “A FPGA-Based Adaptive Noise cancelling System” , Proc. of the 12th Int. Conference on Digital Audio Effects (DAFx-09), pp 1-9, 2009.
10. Uzzal Biswas, and Md. Maniruzzaman, “Removing Power Line Interference from ECG Signal Using Adaptive Filter and Notch Filter”, International Conference on Electrical Engineering and Information & Communication Technology (ICEEICT), IEEE, 978-1-4799-4819-2/14, 2014.
11. Maryam Butt, Nauman Razzaq, Ismail Sadiq, Muhammad Salman, Tahir Zaidi, “Power Line Interference Removal from ECG Signal using SSRLS Algorithm”, 9th International Colloquium on Signal Processing and its Applications, IEEE, 978-1-4673-5609-1/13, 2013. 12. Syed Zahurul Islam, Syed Zahidul Islam, Razali Jidin, Mohd. Alauddin Mohd. Ali, “Performance Study of Adaptive Filtering Algorithms
for Noise Cancellation of ECG Signal”, ICICS, IEEE, 978-1-4244-4657-5/09, 2009.
BIOGRAPHY