An Overview of Automated Score Recording
System and Prediction System for Local
Cricket Matches in India
Jayant Tikmani, Dhiren Dhameja, Hitesh Rajpal, Vivek Ahuja, Indu Dokare
Student, Computer Engineering, V.E.S. Institute of Technology, Chembur, Mumbai, India
Student, Computer Engineering, V.E.S. Institute of Technology, Chembur, Mumbai, India
Student, Computer Engineering, V.E.S. Institute of Technology, Chembur, Mumbai, India
Student, Computer Engineering, V.E.S. Institute of Technology, Chembur, Mumbai, India
Assistant Professor, Computer Engineering, V.E.S. Institute of Technology, Chembur, Mumbai, India
ABSTRACT: Cricket is one of the most popular sports in the world and the most played sport in India. Apart from international matches and well known tournaments, there are thousands of local tournaments that are played in India. The problem with these local level tournaments is that there isn‟t any efficient method to record match statistics and to maintain these match records. This paper proposes an automated solution to the mentioned problem. The paper also describes various factors based on which the outcome of cricket matches may be predicted. We have divided these factors into historical factors and instantaneous factors. Finally, the paper explains batsmen clustering using nearest-neighbor clustering algorithm that is based on various performance attributes of batsmen.
KEYWORDS: Data collection; data analysis; nearest neighbours; sports prediction
I. INTRODUCTION
Cricket is the most popular sport in India and is played in all parts of the country. Cricket is considered a religion in India and hence people have a great amount of enthusiasm towards playing cricket. However, the problem with local level tournaments is that the method used to record the match score and other match statistics is quite tedious. The traditional pen-paper method is used in order to keep track of the match statistics. In this method, a person has to manually update various entries after each ball is delivered. This has motivated development of an automated system which would provide an easy and efficient way to record the match score and other statistics. Additionally, there are no well known systems which provide predictions of match outcome for these local level tournaments. Our emphasis in this paper is to solve the problems that are mentioned above. The proposed system would provide the user an easy method to update match statistics. For example, if the user enters the number of runs scored in last delivery, other details such as number of balls, total score of the team after that delivery, runs conceded by the bowler after that delivery, runs scored by the batsman after that delivery will be automatically updated. Another advantage of using the automated system is that the users do not need to maintain each and every match record. The records of the matches would be stored in the system database. We also discuss various factors that affect the match results. The factors not only include historical data, but also include the instantaneous state of the game. The match outcome could be predicted by using a combination of both historical factors and instantaneous factors. Section 3 explains the score updating module of the system in brief, section 4 explains the factors that play an important role in predicting the match outcome and section 5 explains batsmen clustering on the basis of performance attributes.
II. RELATED WORK
overs cricket” [3] capture the team resources during a match and have found independent use in data mining with respect to cricket.
In “The best batsmen and bowlers in one-day cricket” [2] PhD thesis by Beaudoin and in “Rating teams and analyzing outcomes in one-day and test cricket” [4] by Alsopp and Clarke, a method is proposed to develop new measures of performance in order to rate the cricket teams and to identify valuable team members.
Bailey and Clarke in “Predicting the match outcome in one-day international cricket matches” [5] propose a method to use historical information about the match in order to use linear regression for predicting the total score. They also analyze sensitivity of the betting market to the game‟s us and downs.
Kaluarachchi and Varde in “CricAI: A classification based tool to predict the outcome in ODI cricket” [7] use Bayes classifier along with association rules to analyze various factors that might contribute to a win. They also take into account whether a match is a day or a day-night match.
The Indian team‟s match data and rules of mine association are analyzed in “Application of association rule mining: A case study on team India” [6] by Raj and Padma. This analysis is done on the basis of a set of features which includes home game or an away game, toss, batting first or batting second and match outcome.
III.RECORDING OF MATCH STATISTIC IN PROPOSED SYSTEM
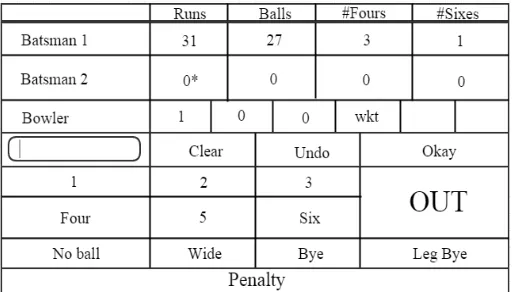
The proposed system would have an update module that would allow the user to update match records in an efficient manner. In the current system, a person manually updates various fields after each delivery i.e. after each bowl is bowled, the person recording the score has to update the number of bowls bowled in that particular over, the runs conceded in that delivery, total runs conceded in the over till the last delivery, number of runs scored by the batsman after that delivery, team‟s total score after that delivery and various other fields. As many of these fields are dependent on each other, we have proposed a system that would take advantage of this dependency and provide an automated solution to get rid of the current paper-pen method. For instance, if the user simply updates the number of runs scored by the batsman in the last delivery, other fields such as team‟s total score after that delivery, runs conceded in that delivery along with runs conceded in the over after that delivery, number of bowls bowled in that over and other dependent fields would be automatically updated. All the user has to do is update one or two fields by simply clicking instead of writing all the statistics on a piece of paper. Additionally, the local level tournament managers do not have to worry about maintaining the records of each and every match of the tournament. The system database would have all the records and the system would analyse the recorded data to provide the tournament managers with information such as the name of the batsman who has scored the most runs in the tournament, the bowler that has taken the most wickets in the tournament, the batsman who has hit the most number of sixes in the tournament and other information that would be useful to give away prizes such as man of the tournament, etc. The user would have to initially register and then log in to the system. Then he would be able to create a new team or select an existing one (if the user had already created a team previously). The user needs to select two teams that are about to play the match. The user would select the playing eleven for each team, enter the total number of overs and then begin with recording of the match score and other statistics. Fig. 1. shows a rough layout of the score updating module.
IV.FACTORS AFFECTING THE MATCH OUTCOME
Prediction of the future events of the match may be accomplished by using the combination of both historical factors and instantaneous factors, explained next.
A. Historical Factors
We have come up with six historical factors for each team that would play an important role in predicting the match outcome. These six historical factors are given below:
1. Average team score
2. Average of number of wickets lost in a match
3. Frequency of losing all wickets within total number of overs
4. Average number of runs conceded in a match
5. Average of number of wickets taken in a match
6. Frequency of getting the opponent to lose all wickets
We consider N as the total number of matches based on which above factors would be calculated. The first factor
can be calculated by dividing the total number of runs scored by a team with the total number of matches played by the team (i.e. N). The other five factors are computed similarly to the first factor. The top three factors show the batting ability of a team whereas the bowling ability of a team is shown by the last three factors.
B. Instantaneous factors
Apart from historical factors, a predicting system should also take into consideration the current state of the ongoing match. We have proposed the following instantaneous factors that would play an important role in predicting the match outcome.
1. Home ground or away ground: This factor describes whether a team is playing on the team‟s home ground or
some other ground. This factor will not carry any weight for both teams if the match is being played on a neutral location (location that is not a home ground to any of the playing teams).
2. Target: The team that is batting second has to achieve a goal in order to win the match. This goal is the target
score. It is basically the score made by the team that was batting first plus one (total score of the opponent team + 1).
3. Batsmen skills: We propose three attributes that indicate the batting skill of the two batsmen that are currently
playing. These attributes are number of runs scored, number of balls faced and number of sixes hit till the current stage of the match.
4. Variables that depict the current state of the game: These variables are the current team score and the number
of wickets that are left (i.e. the number of batsmen left).
V. BATSMEN CLUSTERING
The batsmen can be clustered based on their batting skills. These batting skills are batting average, strike rate, six hitting ability and ability to reach a mile stone. Batting average and strike rate are standard attributes used to show batsman statistics. Even though, these attributes are used to show a batsman‟s performance, they lack the capability of accurately representing the batsman‟s skill and current form. Hence, we would have to use the combination of these attributes and the later two attributes (six hitting ability and ability to reach a mile stone) to accurately perform batsmen clustering.
The batting average of a batsman is given by the ratio of sum of runs scored in each match to the number of matches played by that player. Strike rate of a batsman is hundred multiplied by the ratio of number of runs scored by the batsman to the number of balls faced by the batsman.
The ability of a batsman to hit sixes can be computed using the eq. (1).
Milestones in batting can be considered as scoring 50 runs (half century) or 100 runs (century). These milestones play an important role in accurately representing a batsman‟s skill. The ability to achieve milestones can be computed by eq. (2).
Number of half centuries and centuries scored in matches played(N)/N eq. (2)
The batsmen can be clustered by using the above four attributes. k-nearest neighbor clustering algorithm can be used in order to cluster the batsmen. It would be a good idea to choose the number of clusters as five. As a cricket team comprises of top-order batsmen, middle order players, wicket keeper, players that are capable of batting and bowling (all rounders) and players that are not specifically batsmen (players that bowl well i.e. bowlers), it would be a good approach to select the number of clusters as five and divide the batsmen into 5 clusters using the k-nearest neighbor clustering algorithm.
VI.SIMULATION RESULTS
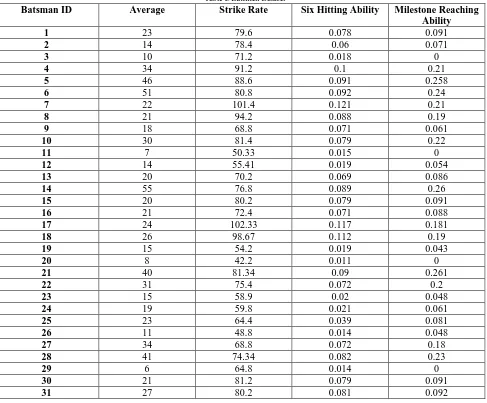
The simulation studies involve a small dataset of batsmen with their attributes. The attributes as explained in the previous section are strike rate, average, six hitting ability and milestone reaching ability. We take a sample dataset which contains these four attributes for 80 batsmen in order to provide a practical explanation of batsman clustering. The values in the dataset are represented by Table I.
Table I. Batsmen Dataset
Batsman ID Average Strike Rate Six Hitting Ability Milestone Reaching Ability
1 23 79.6 0.078 0.091
2 14 78.4 0.06 0.071
3 10 71.2 0.018 0
4 34 91.2 0.1 0.21
5 46 88.6 0.091 0.258
6 51 80.8 0.092 0.24
7 22 101.4 0.121 0.21
8 21 94.2 0.088 0.19
9 18 68.8 0.071 0.061
10 30 81.4 0.079 0.22
11 7 50.33 0.015 0
12 14 55.41 0.019 0.054
13 20 70.2 0.069 0.086
14 55 76.8 0.089 0.26
15 20 80.2 0.079 0.091
16 21 72.4 0.071 0.088
17 24 102.33 0.117 0.181
18 26 98.67 0.112 0.19
19 15 54.2 0.019 0.043
20 8 42.2 0.011 0
21 40 81.34 0.09 0.261
22 31 75.4 0.072 0.2
23 15 58.9 0.02 0.048
24 19 59.8 0.021 0.061
25 23 64.4 0.039 0.081
26 11 48.8 0.014 0.048
27 34 68.8 0.072 0.18
28 41 74.34 0.082 0.23
29 6 64.8 0.014 0
30 21 81.2 0.079 0.091
32 19 62.34 0.048 0.072
33 24 70.2 0.07 0.086
34 25 74.6 0.072 0.089
35 26 62.6 0.067 0.084
36 21 69.8 0.065 0.086
37 11 51.4 0.016 0.042
38 14 58.6 0.019 0.045
39 30 73.6 0.08 0.197
40 11 56.8 0.018 0.031
41 7 42.34 0.010 0
42 24 69.8 0.069 0.091
43 41 102.34 0.126 0.268
44 11 63.67 0.02 0.041
45 21 71.34 0.07 0.087
46 31 77.67 0.079 0.194
47 10 51.34 0.016 0.038
48 9 57.97 0.015 0
49 31 84.68 0.082 0.213
50 26 76.8 0.074 0.093
51 22 81.34 0.078 0.091
52 13 59.67 0.0164 0.06
53 12 55.31 0.0159 0.054
54 31 74.67 0.084 0.22
55 17 82.67 0.076 0.072
56 21 84.34 0.082 0.081
57 34 70.34 0.079 0.21
58 11 51.98 0.019 0.048
59 25 78.6 0.075 0.091
60 35 68.53 0.071 0.197
61 21 81.67 0.078 0.087
62 10 41.2 0.012 0.032
63 20 68.2 0.07 0.088
64 31 62.4 0.078 0.19
65 42 92.6 0.094 0.266
66 3 51.2 0 0
67 18 78.2 0.074 0.084
68 41 98.4 0.12 0.24
69 21 70.4 0.072 0.09
70 31 72.4 0.081 0.19
71 16 60.67 0.053 0.051
72 9 56.4 0.016 0
73 7 52.2 0.012 0
74 41 72.4 0.095 0.242
75 22 78.8 0.076 0.091
76 2 60.34 0.009 0
77 31 69.8 0.08 0.22
78 30 62.6 0.07 0.20
79 21 67.4 0.071 0.084
We apply k nearest neighbor algorithm to this dataset and divide the batsmen into 5 groups. The training dataset that we use in order to apply k-nearest neighbor algorithm is represented by Table. II.
Table II. Training Dataset
Class Average Strike Rate Six Hitting Ability Milestone Reaching Ability
Class 1 40 82 0.097 0.261
Class 2 35 100 0.12 0.23
Class 3 27 80 0.084 0.18
Class 4 23 70 0.076 0.09
Class 5 11 55 0.016 0
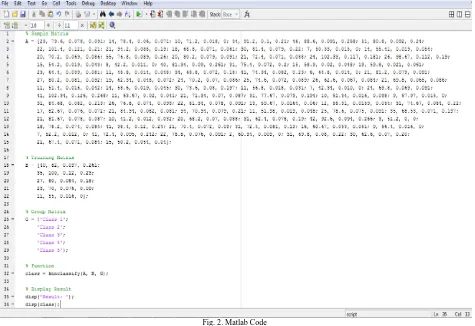
We use Mathworks Matlab tool to compute k nearest neighbours. The Matlab function „knnclassify‟ which takes three parameters namely sample matrix, training matrix and group matrix is used for the desired purpose. Fig. 2. represents the snapshot for the Matlab code. Sample matrix shown in Fig. 2. consists of values represented by Table I. Training matrix shown in Fig. 2. consists of values represented by last four columns of Table II. and group matrix shown in Fig. 2. consists of values represented by first column of Table II.
Fig. 2. Matlab Code
Fig. 3. Matlab Output
VII. CONCLUSION AND FUTURE WORK
The main objective of the paper is to describe factors that play an important role in predicting outcome of a match and also to provide a solution to one of the main problems in local-level cricket tournaments in India i.e. use of pen-paper method to keep record of match scores and other statistics. The pen-paper also describes batsmen clustering that is based on various performance attributes of the batsmen. The paper presents the application of k nearest neighbor algorithm on a dataset of 80 batsmen and assigns each batsman to one of five classes. The number of batsmen in an actual scenario might be greater than the number considered in this paper, but the procedure of dividing the batsmen remains the same.
Our future work will mainly focus on the implementation of a prediction system that is based on the factors that are mentioned in the paper. Furthermore, we aim to decide performance attributes of bowlers and understand the importance of these attributes in predicting the match outcome to make the prediction system more accurate.
REFERENCES
1. F. C. Duckworth and A.J. Lewis, „A fair method for resetting the target in interrupted one-day cricket matches‟, The Journal of the Operational Research Society, 49(3): pp. 220-227, 1998.
2. D. Beaudoin, „The best batsmen and bowlers in one-day cricket‟, PhD thesis, Simon Fraser University, 2003.
3. I. G. McHale and M. Asif, „A modified Duckworth-Lewis method for adjusting targets in interrupted limited overs cricket‟, European Journal of Operational Research, 225(2): pp. 353-362, 2013.
4. P. E. Alssopp and S. R. Clarke, „Rating teams and analysing outcomes in one-day and test cricket‟, Journal of the Royal Statistical
Society. Series A (Statistics in Society), 167(4): pp. 657-667, 2004.
5. Bailey and S. R. Clarke, „Predicting the match outcome in one-day international cricket matches, while the game is in progress‟, Journal of Sports Science and Medicine, 5(4): pp. 480-487, 2006.
6. K. Raj and P. Padma, „Application of association rule mining: A case study on team India‟, International Conference of Computer Communication and Informatics, pages 1-6, 2013.
BIOGRAPHY
Jayant Tikmani, Dhiren Dhameja, Hitesh Rajpal and Vivek Ahuja are students of Computer Engineering Department, V.E.S. Institute of Technology, Chembur, Mumbai, India.