DOI: 10.1534/genetics.110.124990
Cryptic Evolution: Does Environmental Deterioration Have
a Genetic Basis?
Jarrod D. Hadfield,
1Alastair J. Wilson and Loeske E. B. Kruuk
Institute of Evolutionary Biology, University of Edinburgh, Edinburgh, EH9 3J T, United Kingdom
Manuscript received November 8, 2010 Accepted for publication January 10, 2011
ABSTRACT
Cryptic evolution has been defined as adaptive evolutionary change being masked by concurrent environmental change. Empirical studies of cryptic evolution have usually invoked a changing climate and/ or increasing population density as the form of detrimental environmental change experienced by a population undergoing cryptic evolution. However, Fisher(1958) emphasized that evolutionary change in itself is likely to be an important component of ‘‘environmental deterioration,’’ a point restated by Cooke
et al.(1990) in the context of intraspecific competition. In this form, environmental deterioration arises because a winning lineage has to compete against more winners in successive generations as the population evolves. This ‘‘evolutionary environmental deterioration’’ has different implications for the selection and evolution of traits influenced by resource competition than general environmental change. We reformulate Cooke’s model as a quantitative genetic model to show that it is identical in form to more recent developments proposed by quantitative geneticists. This provides a statistical framework for discriminating between the alternative hypotheses of environmental change and environmental deterioration caused by evolutionary change. We also demonstrate that in systems where no phenotypic change has occurred, there are many reasonable biological processes that will generate patterns in predicted breeding values that are consistent with what has been interpreted as cryptic evolution, and care needs to be taken when interpreting these patterns. These processes include mutation, sib competition, and invisible fractions.
T
HE absence of microevolutionary change where it is expected is a long-standing problem in evolutionary biology (Merilaet al.2001b). The breeders’ equation is the simplest model of evolutionary change for continuous characters and predicts evolutionary change when a heritable trait is under directional selection (Falconer 1983). Given that most traits are heritable (Lynchand Walsh1998) and estimates indicate that selection is often directional (Kingsolveret al.2001; Herefordet al.2004; Perezand Munch2010), we should expect evolutionary change to be observed much more often if the breeders’ equation adequately captures the evolutionary process and estimates of selection and heritability are correct (Kinnisonand Hendry2001). Proposed solutions to this problem have usually invoked some correlated aspect of an individual’s phenotype (Lande1979; Priceet al.1988; Blowsand Higgie2003; Blowset al.2004), a relative’s phenotype (Kirkpatrickand Lande1989), or the envi-ronment (Mitchell-Olds and Shaw 1987; Rausher 1992). Once these correlated ‘‘traits’’ are taken into account, the predicted genetic covariance between the trait and fitness may be reduced. Under a more general quantitative genetic model of evolutionary change (Robertson 1966) this genetic covariance is equal tothe evolutionary response to selection. However, in long-term studies of wild systems it has been hard to identify correlated traits that can adequately explain the lack of evolutionary change often observed (Merilaet al.2001b). A related hypothesis was proposed by Cooke et al. (1990), who suggested that evolutionary change may be occurring, but that its phenotypic consequences could be masked by concurrent environmental change. In their original model Cookeet al.(1990) suggested that a major component of this environmental change could be caused by the evolution of competitive ability in the population itself, resulting in ‘‘red queen’’ dynamics (Van Valen 1973). Although Cookeet al.(1990) sug-gested their results were an extension to Fisher’s (1958)
fundamental theorem, Frank and Slatkin (1992)
convincingly argued that this process was subsumed within Fisher’s concept of ‘‘environmental deteriora-tion,’’ which had been widely misinterpreted. In this context, environmental deterioration arises because as the population evolves, a winning lineage has to com-pete against more winners in successive generations, resulting in a drop in relative fitness, a process that we call ‘‘evolutionary environmental deterioration.’’ How-ever, Cookeet al.(1990) noted that they were not able to distinguish between evolutionary environmental deteri-oration and other forms of environmental change in their long-term data set on lesser snow geese (Anser caerulescens), because population density also increased 1Corresponding author:Institute of Evolutionary Biology, King’s Bldgs.,
University of Edinburgh, Edinburgh, EH9 3JT, United Kingdom. E-mail: [email protected]
over the study period. Subsequently, Merilaet al.(2001a), using a quantitative genetics approach on a population of collared flycatchers (Ficedula albicolis), demonstrated that although the genetic component of ‘‘condition’’ increased over the study period, the environmental component decreased. Similar findings have been shown in other long-term vertebrate studies (Garantet al.2004; Wilson et al. 2007) and have been called ‘‘cryptic evolution.’’ Although these studies often cite and even explicitly test Cooke et al.’s (1990) original model, they have invoked changes in population density and/or changes in climate as the source of environmental change, without consider-ing the process that both Cookeet al.(1990) and Fisher (1958) emphasized as important: environmental deterio-ration as a result of evolutionary change. In addition, all of these studies have been on body-size–related traits that appear to be under consistent positive directional selec-tion (Kingsolverand Pfennig2004; Perezand Munch 2010). Whereas general environmental change would reduce body size only under certain scenarios, environ-mental change caused by the evolution of competitive ability would always act to reduce body size and may therefore likely be a more general explanation for why the body size of most species seems to be suboptimal despite being heritable (Blanckenhorn2000).
In this article, we cast Cookeet al.’s (1990) model as a quantitative genetic model and clarify its meaning in terms of the multivariate breeders’ equation. Using recent advances in statistical theory (Gianola and Sorensen 2004), we then show how evolutionary environmental deterioration can be distinguished from general environ-mental change in real data. We also show that in its most basic form Cookeet al.’s (1990) model is virtually identical to indirect genetic models derived in plant breeding (Griffing1967) and more recently applied in animal breeding (Bijmaet al.2007a). However, since basic animal models have been used to test for cryptic evolution (Merilaet al. 2001a; Garant et al.2004; Wilson et al. 2007), we determine the conditions under which pre-dicted breeding values from a basic animal model increase over time, but environmental deviations decrease over time, a pattern that has generally been considered as conclusive evidence of cryptic evolution (Postma2006). We show that although these patterns are consistent with environmental deterioration, there are alternative biolog-ical processes that can give rise to such trends.
METHODS AND RESULTS
Evolutionary environmental deterioration and quan-titative genetics: Without loss of generality we use a simplified version of Cookeet al.’s (1990) model where the phenotype (y1) follows the model
y1¼Re1a1; ð1Þ
wheree1anda1are, respectively, an environmental effect
and a genetic effect that determine the conversion of
resource R into y1. In Cooke et al.’s (1990) original model a second environmental deviation is included in the product, but is redundant for our purposes.
The amount of resource available to an individual is determined by
R ¼A
N y2
y2: ð2Þ Here the fraction A/N is the amount of the total resource (A) available to an individual when the re-source is shared evenly over all individuals (N is the population size). The second fractiony=ydetermines the ability of an individual to obtain more or less than its fair share, where the traity2can be viewed as competitive
ability and the overbar denotes the expectation. When there is no variation in competitive ability, then this fraction is unity and the resource is evenly split.
As with the first trait, the competitive ability is assumed to follow a multiplicative quantitative genetic model:
y2¼e2a2: ð3Þ
The model can be transformed into the more standard additive quantitative genetic model by working on the log scale (y1¼log(y1))
y2¼m21a21e2
y1m11a11e11logðAÞ logðNÞ1m21a21e2
y21 s2y
2
2
" #
;
ð4Þ
wherem1andm2are trait-specific intercepts. The
approx-imation is due to logðy2Þ¼logðey2Þ y21s2y2=2. We can get an expression for the total change in the mean of the two traits by combining the genetic response to selection based on the multivariate breeders’ equation (Lande 1979) with the expression for environmental change (see also Iwasaand Pomiankowski1991):
Dy1 Dy2
¼ s
2
a11s 2
a212sa1;a2 s 2
a21sa1;a2 s2a
21sa1;a2 s 2
a2
" #
0 by2
1 DlogðAÞ DlogðNÞ D y21
s2 y2 2
h i
0
" #
:
ð5Þ
by1¼0
. The second term on the RHS captures ‘‘environmental’’ change, although it should be under-stood that environmental change iny1includes change
induced by change in the mean value ofy2, which itself
may be due to a genetic response to selection.
If we assume that the population size is large enough that the covariance between population-level properties of y2 ðe:g:;ey2Þ and an individual’s breeding value or
environmental deviation are negligible, and that change in the higher-order moments ofy2are also small
½i:e:;Dðs2
y2=2Þ 0, Equation 5 can be simplified:
Dy1
Dy2
¼ by2ðs
2
a21sa1;a2Þ1DlogðAÞ DlogðNÞ Dy2D
s2 y2=2
by2s
2 a2
" #
by2ðs 2
a21sa1;a2Þ1DlogðAÞ DlogðNÞ by2s
2 a2 by2s
2 a2
" #
: ð6Þ
The term by2ðs
2
a21sa1;a2Þ can be interpreted as Robertson’s (1966) genetic covariance between a trait and fitness. To see how this interpretation can be given, decompose fitness (W) into a component predicted by y2and a residualeW:
W ¼by2ðm21a21e2Þ1ew: ð7Þ
The covariance between y1 and fitness within a
generation can then be decomposed into a genetic and environmental covariance assuming residuals are uncorrelated with breeding values:
COVðy1;WÞ ¼COVða21e21a11e1;by2ðm21a21e2Þ1eWÞ
¼COVða21a1;by2a2Þ1COVðe21e1;by2e2Þ
¼by2ðs
2
a21sa1;a2Þ1by2ðs
2
e21se1;e2Þ:
ð8Þ Designating Robertson’s (1966) genetic covariance asSG, we have
Dy1¼SG1DlogðAÞ DlogðNÞ by2s 2
a2; ð9Þ
whereSGis equal to evolutionary change in the absence
of environmental deterioration (Robertson1966), and D log(A) andD log(N) are changes in environmental quality and population density, respectively. Cookeet al. (1990) put special emphasis onby2s
2
a2 as a source of environmental deterioration, and Frank and Slatkin (1992) showed that this quantity is closely linked to Fisher’s (1958) concept of environmental deterioration (see also Price1972b; Ewens 1989). However, Cooke et al.(1990) indicated that D log(N) was also positive during the course of their study and so the effect of changes in population size could not be distinguished from environmental deterioration caused by the evolu-tion of competitive ability. More recent studies have considered only the role of environmental change in terms of changes in population density (N) (Larsson et al.1998; Wilsonet al. 2007) or changes in
environ-mental quality (A) (Merila et al. 2001a) or both (Garantet al.2004), without considering the final term in Equation 9: evolutionary environmental deterioration. A test for evolutionary environmental deterioration—a recursive quantitative genetic model: The ability to acquire resources (y2) or the total amount of resources
available (A) is usually not measured, so we ask whether it is possible to distinguish between environmental change and evolutionary environmental deterioration given information ony1only. To illustrate the point we
assume discrete annual generations in which all indi-viduals interact equally, but emphasize that the model generalizes to more complex scenarios.
The model presented above can be expressed as a recursive quantitative genetic model (Gianola and Sorensen 2004) since one of the response variables (y2) directly affects the other (y1). Following Gianola
and Sorensen(2004) we can rearrange Equation 4 such that the traits appear on the left-hand side (LHS) and the unknown parameters appear on the RHS,
y1;iy2;i1
1 Nki
X
jeIi
y2;j m11a1;i1e1;i1bki
y2;i ¼m21a2;i1e2;i; ð10Þ
wherebare year effects that include the effects of between-year variation inAon the expression ofy1.kiindexes the year in which individualiwas present andIithe set of all
individuals present in that year (including iitself). The LHS of Equation 10 for all individuals, nesting individuals within traits, can be represented in a more manageable matrix form, where X is an incidence matrix relating individuals to years, and D is a diagonal matrix with reciprocal annual population sizes along the diagonal,
y1;1y2;11N1k2 P
jeI1
y2;j
y1;2y2;21N1k2 P
jeI2
y2;j
.. .
y1;m1y2;m11N1 km1
P
jeIm1
y2;j
y1;my2;m1N1km P jeIm
y2;j
y2;1
y2;2
.. .
y2;m1
y2;m 2 6 6 6 6 6 6 6 6 6 6 6 6 6 6 6 6 6 6 6 6 6 6 6 6 6 6 6 6 6 6 6 4 3 7 7 7 7 7 7 7 7 7 7 7 7 7 7 7 7 7 7 7 7 7 7 7 7 7 7 7 7 7 7 7 5
¼ I XDX9I
0 I y1 y2 ;
ð11Þ
y1NðXb;s2eI1s
2
aAð2se1;e21s 2
e2ÞB ðsa1;a21s 2
a2Þ ðBA1ABÞ1s2a
2BABÞ;
ð12Þ
whereB¼XDX9, Ais the additive genetic relatedness matrix, and s2
e ¼s
2
e112se1;e21s
2
e2 and s
2
a ¼s
2 a11 2sa1;a21s
2 a2.
When there is no variance in the ability to acquire resourcesðs2
e2 ¼s
2
a2¼0Þ, the model coincides with the standard animal model that has been used to test for cryptic evolution (see below). The marginal distribution of the full model, however, has a similar form to that under Willham’s (1972) maternal effect model (see p. 573 of Sorensenand Gianola2002), as was noted by Bijmaet al.(2007a) for their model of indirect genetic effects. In fact, this model coincides with Bijma et al.’s (2007a,b) model under the null hypothesis proposed by Hadfieldand Wilson(2007), that the more individuals you interact with the less effect you can have on any one individual, and hence the matrix of reciprocal population sizesD. The only slight difference is that an individual also affects itself (by using up its own resources) whereas in Bijmaet al.’s (2007a,b) model the indirect effect (called associative effect following Griffing 1967) caused by expression ofy2is felt only by other individuals.
Each element of the matrix s2
a2BAB has the form s2
a2E rIi;Ij
, where the expectation is the mean related-ness between individuals in i’s year and j’s year. This implies that two individuals should be more similar if their respective competitors are more closely related and therefore similar in competitive ability.
The term ðsa1;a21s
2
a2ÞðBA1ABÞ is harder to un-derstand and implies that the expected covariance between individual i and individual j’s phenotype is
proportional to the mean relatedness of i to the
individuals alive inj’s year plus the mean relatedness of jto the individuals alive ini’s year (E[ri,Ij]1E[rj,Ii]). If the genetic covariance between competitive ability and the allocation of resources to the focal trait (y1) is zero,
then this implies that two individuals should be less similar when they interact with each other’s relatives. To see how this arises, imagine the extreme situation where individualiinteractsonlywithj’s relatives and individual jinteractsonlywithi’s relatives. If individualiis a better competitor than the relatives ofj, then it will have a large phenotype. If competitive ability is heritable, then on average relatives ofiare likely to outcompete individual jand cause its phenotype to be small.
A similar phenomenon arises at the environmental level when the environmental covariance between co-mpetitive ability and the allocation of resources to the focal trait is zero. The term ð2se1;e21s
2
e2ÞB then implies that individuals who interact should resemble each other less because if individual i takes more resource, this leaves less forj. This effect decreases as populations become large because the effect of
in-dividualionj’s phenotypes will become diluted. More flexible relationships between population density and the strength of competition could be entertained (Hadfieldand Wilson2007; Bijma2010c).
On the basis of these results we suggest that a test for evolutionary environmental deterioration should first involve estimating the indirect genetic (co)variances de-termined aboveði:e:;s2
a2andsa1;a2Þ. If these are found to be different from zero, then showing that the breeding value for competitive ability has increased would be consistent with evolutionary environmental deterioration. The conditions for the pattern of cryptic evolution: Above we have argued that general environmental change and evolutionary environmental deterioration—as en-visaged by Cookeet al.(1990) and Frankand Slatkin (1992)—are separate and distinct processes. Evolution-ary environmental deterioration depends on the pres-ence of indirect effects, both genetic (Wolfet al.1998) and environmental, arising from competition. To date, these indirect effects have not been included in models used to test for cryptic evolution. Rather models of the form
y1NðXb;se2I1s2aAÞ ð13Þ
have generally been used, and individual predictions of breeding values and environmental deviations have been obtained using best linear unbiased prediction (BLUP). When the BLUP breeding values and BLUP environmental deviations from these models change in different directions over time, it is generally assumed that this is good evidence of cryptic evolution (Postma 2006). If the model defined by Equation 13 is the correct model, then the trends in BLUP breeding values and BLUP environmental deviations are unbiased estimators of the trends in actual breeding values and actual environmental deviations, although care has to be taken with hypothesis testing (Hadfieldet al.2010). However, if the model defined by Equation 13 is not the correct model, then predicted and actual trends may not coincide. In this section we determine the con-ditions under which fitting the basic animal model (Equation 13) would result in predicted trends that are consistent with what has been interpreted as cryptic evolution. We use these results to show that evolutionary environmental change does give rise to predicted trends that are consistent with the process, despite the model being wrong (i.e., Equation 13 is different from Equa-tion 12). However, we also show that there are other biological processes not explicitly modeled that would also result in similar patterns.
variable rather than a fixed quantity. To be able to do this we consider the joint distribution of pedigrees and phenotypes when pedigrees consist of parents and their full-sib families and let the number of sibs in each family depend on the phenotypes of the parents. We then ask what properties of this joint distribution would give rise to predictions that have been treated as evidence of cryptic evolution.
Under the assumption that the mean phenotype has not changed between the parental and the offspring generation, we find that a positive trend in predicted breeding values and a negative trend in predicted environmental effects will result when
COVðDz;f1ðnÞÞ1E f½ 1ðnÞE½Dz,COVðy;f2ðnÞÞ ð14Þ
(seeappendixes a–cfor further details), whereDzis the deviation, midoffspring phenotype minus midparent phenotype (y). Expectations are taken over families (as in Price’s 1972a equation), each of which has two
parents but a variable number of n offspring. The
functionsf1(n) andf2(n) are monotonic positive
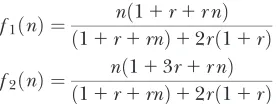
func-tions of parental fitness,
f1ðnÞ ¼
nð11r1r nÞ ð11r1rnÞ12rð11rÞ
f2ðnÞ ¼
nð113r1r nÞ
ð11r1rnÞ12rð11rÞ; ð15Þ
where r is the ratio s2
e=s2a. We had little success in simplifying the analysis or extending it to more general scenarios, but some insights can be gained from in-equality (14), which we illustrate and validate with simulations of more complex pedigrees.
Because the functions are monotonic functions of parental fitness, the sign of the covariances will be the same as if parental fitness was used directly. If we assume directional selection on the trait is either absent or positive (i.e., the RHS is equal to or greater than zero) then any process that either (a) reducesE[Dz] or (b) reduces the covariance betweenDzand parental fitness could give rise to patterns in predicted breeding values that have been interpreted as evidence of cryptic evolution.
Example 1—sib effects: General changes within families (E[Dz]) may be the result of between-generation changes in the environment such as environmental de-terioration (Frankand Slatkin1992), but there are also other mechanisms. For example, under a neutral model most parents have more sibs than their offspring (see appendixes a–c) and so any effect of family size on offspring phenotype can cause a general difference between parent and offspring phenotype. To illustrate, we made a simple simulation with discrete generations (30), a constant population size (100), and no selection on phenotype. Individuals formed monogamous pairs at random, and family sizes were generated from a Poisson
distribution with a mean of exp(2)¼7.4. The resulting offspring were sampled at random to form the follow-ing generation, and their phenotypes were simulated according to
yi¼ai1bsnnpi1ei ð16Þ
where npi is offspring i’s parental fitness (i.e., the number of sibs individual ihas). The residual (ei) was simulated from a standard normal distribution, and the breeding value (ai) from a normal distribution with a mean equal to the average breeding value ofi’s parents and a variance equal to half the additive genetic variance, which was also set to 1 (i.e.,r ¼s2
e=s 2 a ¼1).
bsnis the effect that an increase in sibship size has on an individual’s phenotype which we set to 0.5. A simple animal model was fitted using the resulting pedigree and phenotype data, and breeding values were pre-dicted. Across 100 replications the average change in the true breeding values was small and nonsignificant (0.01760.060,P¼0.775) but the change in predicted breeding value was large (2.229 6 0.042,P , 0.001). Figure 1 shows the actual trend in breeding values (and environmental deviations over time) in gray, and the predicted trends in black, for a typical simulated run. There are some traits for which positive values ofbsnare likely, for example, chicks from larger broods often beg more (e.g., Neuenschwanderet al.2003), but there are as yet no published studies of cryptic evolution for this type of trait. For traits that are negatively affected by sib competition, such as body size,bsnis likely to be negative and the primary motivation for using a positive co-efficient is to be consistent (i.e., to obtain positive rather than negative trends in predicted breeding values). Reversing the sign of the coefficient results in a decrease in predicted breeding values and an increase in envi-ronmental deviations which could potentially mask the signature of cryptic evolution.
It is also important to realize that parental fitnesses and parental/offspring phenotypes are not necessarily the real values, but the values that went into the analysis. If small parents tend not to be observed (for example, sneaky males are not identified), then the offspring of single parents tend to be smaller than expected under the assumption of random mating, which is assumed in the basic model. Likewise, Mojica and Kelly (2010) show that although large flowers confer a fecundity advantage in Mimulus guttatus, larger-flowered geno-types have greater mortality prior to trait expression and so their flower size goes unmeasured. Under this scenario, correlative studies will tend to measure a smaller-sized subset of offspring from large parents, resulting in Dz values that negatively covary with measured parental fitness (fecundity). The subset of unmeasured dead individuals has been termed the invisible fraction (Grafen1988) and is known to cause problems for the estimation of quantitative genetic parameters (Imet al.1989). Here we show that this form of missing data is sufficient to generate trends in predicted breeding values that resemble patterns that would be obtained from cryptic evolution.
Again, we made a simple simulation with discrete generations (30) and a constant population size (100) in which individuals with a propensity to produce large flowers (y) have a reduced chance of surviving to maturity (and therefore being measured) but condi-tional on flowering have higher fecundity. Family sizes were generated from a Poisson distribution,
niPois exp 21bf
yi1yj
2
; ð17Þ
where individual j is i’s mate, and bf is the fecundity
selection gradient that was set to 0.2. The phenotypes of individuals were generated according to the basic quantitative genetic model
yi¼ai1ei: ð18Þ
However, the probability of an individual surviving to adulthood (and therefore being measured) was pro-portional to the density of y in a normal distribution with mean equal to y1S and a variance ofg.Sis the deviation from the optima of the population mean in that yearðyÞand was set to0.2, andgis equivalent to the strength of stabilizing selection around the optima, which was set to 1.75. These parameters result in a selection regime where fecundity selection and viability selection are approximately equal.
Again, a simple animal model was fitted using the resulting pedigree and phenotype data, and breeding values were predicted. Across 100 replications the average change in the true breeding values was small and nonsignificant (0.00660.046,P¼0.893) but the change in predicted breeding values was large (0.9536
0.018, P , 0.001). Figure 2 shows the actual trend in breeding values (and environmental deviations over time) in gray, and the predicted trends in black, for a typical simulated run.
DISCUSSION
In this article we clarify the original meaning of
environmental deterioration (Fisher 1958; Cooke
et al. 1990; Frankand Slatkin 1992) by placing it in the context of quantitative genetics. By doing this, we show that previous quantitative genetic studies in wild systems (Merilaet al.2001a; Garantet al.2004; Wilson et al. 2007) ignored the process of evolutionary envi-ronmental deterioration that Fisher(1958) and partic-ularly Cookeet al.(1990) had emphasized as important (Frankand Slatkin1992).
Evolutionary environmental deterioration in the sense used by Cooke et al. (1990) arises because as genotypes that confer greater competitive ability spread, the amount of resources available to other ge-notypes diminishes. When the amount of resource is fixed, this leads to a zero-sum game whereby the mean resource acquired remains constant, and the mean trait value does not change despite underlying evolutionary change (Dickerson1955; Griffing1967; Wolf2003). Moreover, the share of the resource acquired by the superior genotypes diminishes as they spread because they end up competing with themselves, making it more difficult to observe the phenotypic effects of superior genotypes. Because it is this information that is used to
detect evolutionary environmental deterioration in the statistical procedure outlined in this article, we acknowl-edge that power may be low (Bijma 2010a). Greater success may be had with laboratory- or field-based time-shift experiments that are able to measure individuals in environments characteristic of earlier or later gener-ations, as is done in studies of host–parasite coevolution (Gabaand Ebert2009).
In a recent article, Hadfieldet al.(2010) showed that current methods for detecting cryptic evolution are highly anticonservative and that the evidence for cryptic evolution in two of the published examples (Garant et al.2004; Wilson et al. 2007) was weak. However, it should be understood that the estimates of evolutionary change are conditional on the model used and that by obtaining the marginal distribution of the data under Cooke’s model, we show that models previously used to demonstrate cryptic evolution are the wrong models if evolutionary environmental change is the main cause of any environmental deterioration. However, it would be possible to obtain estimates of evolutionary change under a model of evolutionary environmental deterio-ration and test them appropriately. In this article we took, as Cookeet al.(1990) did, a simplified pedagog-ical model where all individuals in a year interact to the same degree. We acknowledge that this is ecologically naive and that to obtain more accurate and more powerful estimates of this evolutionary process it is undoubtedly necessary to work with systems where groups of interacting individuals can be defined or the
level of interaction between different individuals quan-tified. In many systems, interacting individuals will be relatives and we stress that in obtaining Equation 6 the simplifying assumption that the covariance between an individual’s breeding value and the mean breeding value of the group is zero precludes a response to kin
selection that can and should be included (Bijma
2010b; McGlothlin et al. 2010). In addition, Cooke et al.’s (1990) model assumes that competitive abilities are transitive in the sense that if individual A out-competes B, and individual B outcompetes C, then individual A must outcompete individual C (Harris et al. 2008). Such a model predicts that individuals in later generations would on average outcompete indi-viduals in previous generations, which may hold over short timescales but is unlikely to be a general property of competitive interactions, as evidenced in yeast (Paquinand Adams1983). Furthermore, it is impor-tant to recognize that even if patterns consistent with cryptic evolution are found, there are other biological processes that may be responsible for them. For example, because groups that share more relatives are likely to be close in time, any temporal autocorrelation in environmental effects may be wrongly interpreted as indirect genetic effects. Here, using a simplified full-sib model we have derived conditions under which a conclusion of cryptic evolution might be drawn from the basic animal model and find that sibling competition, selection bias, and mutation could all cause patterns that are equally consistent with this interpretation.
However, as noted above, our formulation of Cooke et al.’s (1990) model is virtually identical to indirect genetic effect models (Griffing1967) recently applied to livestock data (Bijmaet al.2007a). These models have been used to demonstrate the influence of indirect genetic effects in poultry and pigs, where groups of interacting individuals can be readily defined as those animals sharing a cage or a pen (e.g., Bijmaet al.2007b; Bergsmaet al.2008). Bijmaet al.(2007b) have argued that negative covariance between direct and indirect genetic effects can be interpreted as arising from heritable variation in competitive ability and should constrain phenotypic responses to selection among indi-viduals (Griffing1967). Selection experiments that have explicitly considered indirect genetic effects have yielded results supporting this prediction (e.g., Goodnight1985; Muir2005). This source of constraint and the phenom-enon of evolutionary environmental deterioration dis-cussed here are one and the same. Given the potential importance of competition and resource limitation in natural populations, we believe the conditions that would give rise to evolutionary environmental deterioration are widespread. However, it is currently difficult to assess the potential magnitude of such effects without a better idea of the amount of additive genetic variance in competitive ability that segregates under natural conditions in wild populations. Thus while we certainly expect unequivocal
demonstration of cryptic evolution by evolutionary envi-ronmental deterioration to be difficult, the importance of resource-dependent trait expression for many aspects of an organism’s phenotype makes this an interesting, if challenging, topic for further study in wild systems.
We thank Michael Morrissey, Josephine Pemberton, Ben Sheldon, and Craig Walling for useful discussions regarding this work and Andy Gardner for saving us from one mistake. J.D.H. was funded by National Environment Research Council and a Leverhulme trust award (to L.E.B.K.). A.J.W. was funded by the Biotechnology and Biological Sciences Research Council and L.E.B.K. by the Royal Society.
LITERATURE CITED
Azevedo, R. B. R., P. D. Keightley, C. Laure´ n-Ma¨ a¨ tta¨, L. L. Vassilieva, M. Lynchet al.,2002 Spontaneous muta-tional variation for body size inCaenorhabditis elegans.Genetics
162:755–765.
Bergsma, R., E. Kanis, E. F. Knoland P. Bijma, 2008 The contribu-tion of social effects to heritable variacontribu-tion in finishing traits of domestic pigs (Sus scrofa).Genetics178:1559–1570.
Bijma, P., 2010a Estimating indirect genetic effects: precision of es-timates and optimum designs. Genetics186:1013–1028. Bijma, P., 2010b Fisher’s fundamental theorem of inclusive fitness
and the change in fitness due to natural selection when conspe-cifics interact. J. Evol. Biol.23:194–206.
Bijma, P., 2010c Multilevel selection 4: modeling the relationship of indirect genetic effects and group size. Genetics186:1029–1031. Bijma, P., W. A. Muirand J. A. M. VanArendonk, 2007a Multilevel selection 1: quantitative genetics of inheritance and response to selection. Genetics175:277–288.
Bijma, P., W. M. Muir, E. D. Ellen, J. B. Wolfand J. A. M. Van Arendonk, 2007b Multilevel selection 2: estimating the genetic parameters determining inheritance and response to selection. Genetics175:289–299.
Blanckenhorn, W. U., 2000 The evolution of body size: What keeps organisms small? Q. Rev. Biol.75:385–407.
Blows, M. W., and M. Higgie, 2003 Genetic constraints on the evolution of mate recognition under natural selection. Am. Nat.161:240–253. Blows, M. W., S. F. Chenowethand E. Hine, 2004 Orientation of the genetic variance-covariance matrix and the fitness surface for mul-tiple male sexually selected traits. Am. Nat.163:E329–E340. Cooke, F., P. D. Taylor, C. M. Francis and R. F. Rockwell,
1990 Directional selection and clutch size in birds. Am. Nat.
136:261–267.
Dickerson, G. E., 1955 Genetic slippage in response to selection for multiple objectives. Cold Spring Harbor Symp. Quant. Biol.20:
213–224.
Ewens, W. J., 1989 An interpretation and proof of the fundamental theorem of natural-selection. Theor. Popul. Biol.36:167–180. Falconer, D., 1983 Introduction to Quantitative Genetics.Longman,
New York.
Fisher, R. A., 1958 The Genetical Theory of Natural Selection, Ed. 2. Dover, New York.
Frank, S. A., and M. Slatkin, 1992 Fisher’s fundamental theorem of natural selection. Trends Ecol. Evol.7:92–95.
Gaba, S., and D. Ebert, 2009 Time-shift experiments as a tool to study antagonistic coevolution. Trends Ecol. Evol.24:226–232. Garant, D., L. E. B. Kruuk, R. H. McCleeryand B. C. Sheldon,
2004 Evolution in a changing environment: a case study with great tit fledging mass. Am. Nat.164:E115–E129.
Gianola, D., and D. Sorensen, 2004 Quantitative genetic models for describing simultaneous and recursive relationships between phenotypes. Genetics167:1407–1424.
Gianola, D., S. Imand R. L. Fernando, 1988 Prediction of breed-ing value under Henderson’s selection model—a revisitation. J. Dairy Sci.71:2790–2798.
Goodnight, C. J., 1985 The influence of environmental variation on group and individual selection in a cress. Evolution39:545–558. Grafen, A., 1988 On the uses of data on lifetime reproductive suc-cess, pp. 454–471 inReproductive Success, edited by T. H. Clutton -Brock. University of Chicago Press, Chicago.
Griffing, B., 1967 Selection in reference to biological groups. I. Individual and group selection applied to populations of unor-dered groups. Aust. J. Biol. Sci.20:127–139.
Hadfield, J. D., and A. J. Wilson, 2007 Multilevel selection 3: mod-elling the effects of interacting individuals as a function of group size. Genetics177:667–668.
Hadfield, J., A. J. Wilson, D. Garant, B. C. Sheldonand L. E. B. Kruuk, 2010 The misuse of BLUP in ecology and evolution. Am. Nat.175:116–125.
Harris, W. E., A. J. McKaneand J. B. Wolf, 2008 The maintenance of heritable variation through social competition. Evolution62:337– 347.
Hereford, J., T. F. Hansen and D. Houle, 2004 Comparing strengths of directional selection: How strong is strong? Evolu-tion58:2133–2143.
Im, S., R. L. Fernandoand D. Gianola, 1989 Likelihood inferences in animal breeding under selection—a missing-data theory view point. Genet. Sel. Evol.21:399–414.
Iwasa, Y., and A. Pomiankowski, 1991 The evolution of costly mate preferences. 2. The handicap principle. Evolution 45: 1431– 1442.
Kingsolver, J. G., and D. W. Pfennig, 2004 Individual-level selec-tion as a cause of Cope’s rule of phyletic size increase. Evoluselec-tion
58:1608–1612.
Kingsolver, J. G., H. E. Hoekstra, J. M. Hoekstra, D. Berrigan, S. N. Vignieriet al., 2001 The strength of phenotypic selection in natural populations. Am. Nat.157:245–261.
Kinnison, M. T., and A. P. Hendry, 2001 The pace of modern life II: from rates of contemporary microevolution to pattern and pro-cess. Genetica112:145–164.
Kirkpatrick, M., and R. Lande, 1989 The evolution of maternal characters. Evolution43:485–503.
Lande, R., 1979 Quantitative genetic analysis of multivariate evolution, applied to the brain: body size allometry. Evolution33:402–416. Larsson, K., H. P. van der Jeugd, I. T. van der Veen and P.
Forslund, 1998 Body size declines despite positive directional selection on heritable size traits in a barnacle goose population. Evolution52:1169–1184.
Lynch, M., and B. Walsh, 1998 Genetics and Analysis of Quantitative Traits.Sinauer Associates, Sunderland, MA.
McGlothlin, J. W., A. J. Moore, J. B. Wolf and E. D. Brodie, 2010 Interacting phenotypes and the evolutionary process. III. Social evolution. Evolution64:2558–2574.
Merila, J., L. E. B. Kruukand B. C. Sheldon, 2001a Cryptic evolu-tion in a wild bird populaevolu-tion. Nature412:76–79.
Merila, J., B. C. Sheldonand L. E. B. Kruuk, 2001b Explaining stasis: microevolutionary studies in natural populations. Genetica
112:199–222.
Mitchell-Olds, T., and R. G. Shaw, 1987 Regression analysis of natural selection: statistical inference and biological interpreta-tion. Evolution41:1149–1161.
Mojica, J. P., and J. K. Kelly, 2010 Viability selection prior to trait expression is an essential component of natural selection. Proc. R. Soc. B Biol. Sci.277:2945–2950.
Muir, W. M., 2005 Incorporation of competitive effects in forest tree or animal breeding programs. Genetics170:1247–1259. Neuenschwander, S., M. W. G. Brinkhof, M. Kolliker and H.
Richner, 2003 Brood size, sibling competition, and the cost of begging in great tits(Parus major).Behav. Ecol.14:457–462. Paquin, C. E., and J. Adams, 1983 Relative fitness can decrease in
evolving asexual populations ofS. cerevisiae.Nature306:368–371. Perez, K. O., and S. B. Munch, 2010 Extreme selection on size in
the early lives of fish. Evolution64:2450–2457.
Postma, E., 2006 Implications of the difference between true and predicted breeding values for the study of natural selection and micro-evolution. J. Evol. Biol.19:309–320.
Price, G. R., 1972a Extension of covariance selection mathematics. Ann. Hum. Genet.35:485–490.
Price, G. R., 1972b Fisher’s ‘fundamental theorem’ made clear. Ann. Hum. Genet.36:129–140.
Robertson, A., 1966 A mathematical model of culling process in dairy cattle. Anim. Prod.8:95–108.
Sorensen, D., and D. Gianola, 2002 Likelihood, Bayesian and MCMC Methods in Quantitative Genetics(Statistics for Biology and Health). Springer-Verlag, New York.
VanValen, L., 1973 A new evolutionary law. Evol. Theory1:1–30. Willham, R. L., 1972 The role of maternal effects in animal breed-ing: Iii. Biometrical aspects of maternal effects in animals. J. Anim. Sci.35:1288–1293.
Wilson, A. J., J. M. Pemberton, J. G. Pilkington, T. H. Clutton -Brock, D. W. Coltman et al., 2007 Quantitative genetics of
growth and cryptic evolution of body size in an island population. Evol. Ecol.21:337–356.
Wolf, J. B., 2003 Genetic architecture and evolutionary constraint when the environment contains genes. Proc. Natl. Acad. Sci. USA
100:4655–4660.
Wolf, J. B., E. D. Brodie, J. M. Cheverud, A. J. Mooreand M. J. Wade, 1998 Evolutionary consequences of indirect genetic ef-fects. Trends Ecol. Evol.13:64–69.
Communicating editor: M. W. Feldman
APPENDIX A: SIMPLIFYING THE RECURSIVE QG MODEL
The structural coefficient matrix has the inverse
L1 ¼ I IXDX9
0 I
; ðA1Þ
using Equation 14 (Searle2006, p. 260).
Modifying Equation 29 of Gianolaand Sorensen(2004), we get the marginal distribution of½y91;y929,
N I IXDX9
0 I
m
11Xb
m210
; I IXDX9
0 I
s2
e1I se1;e2I se1;e2I s2e2I
" #
1 s
2
a1A sa1;a2A sa1;a2A s2a2A
" #!
I IXDX9
0 I
9
!
N m11Xb1ðIXDX9Þðm210Þ m210
; I IXDX9
0 I
s2
e1I se1;e2I se1;e2I s2e2I
" #
1 s
2
a1A sa1;a2A sa1;a2A s2a2A
" #!
I 0
IXDX9 I
!
N m11Xb1ðIXDX9Þðm210Þ m210
; s
2
e1I12se1;e2ðIXDX9Þ1s2e2ðIXDX9ÞðIXDX9Þ se1;e2I1s2e2ðIXDX9Þ se1;e2I1s2e2ðIXDX9Þ s
2 e2I
" #!
1N 0 0 ;
s2a1A1sa1;a2ðIXDX9ÞA1sa1;a2AðIXDX9Þ1sa22ðIXDX9ÞAðIXDX9Þ sa1;a2A1s2a2ðIXDX9ÞA
sa1;a2A1s2a2ðIXDX9ÞA s2a2A
" #!
;
ðA2Þ
assuming each individual is present only in a single year.
SinceX9Xis a diagonal matrix of population sizes andDis a diagonal matrix of reciprocal population sizes,X9XDis an identity matrix, and the above equation simplifies:
ðIXDX9ÞðIXDX9Þ ¼IXDX9XDX9 1XDX9XDX9
¼IXDX9XDX9 1XDIX9
¼IXDX9: ðA3Þ
Also (IXDX9)(m210)¼0sincem2Pi¼m1ð1=NkiÞm2¼m2m2, and
V¼s2
a1A1sa1;a2ðIXDX9ÞA1sa1;a2AðIXDX9Þ1s 2
a2ðIXDX9ÞAðIXDX9Þ ¼s2a
1A1sa1;a2½ðIXDX9ÞA1AðIXDX9Þ1s 2
a2ðIXDX9ÞAðIXDX9Þ ¼s2a
1A1sa1;a2½AXDX9A1AAXDX91s 2
a2ðIXDX9ÞAðIXDX9Þ ¼s2a
1A1sa1;a2½2A ðXDX9A1AXDX9Þ1s 2
a2ðIXDX9ÞAðIXDX9Þ ¼s2a
1A1sa1;a2½2A ðXDX9A1AXDX9Þ1s 2
a2½A ðXDX9A1AXX9Þ1XDX9AXDX9 ¼ ðs2
a112sa1;a21s 2
a2ÞAsa1;a2ðXDX9A1AXDX9Þ1s 2
a2½XDX9AXDX9 ðXDX9A1AXDX9Þ ¼ ðs2
a112sa1;a21s 2
a2ÞA ðsa1;a21s 2
a2ÞðXDX9A1AXDX9Þ1s 2
a2XDX9AXDX9; ðA4Þ
y1 y2
N m11Xb 0
;
ðs2
e112se1;e21s2e2ÞI ð2se1;e21s2e2ÞXDX9 ðse1;e21s2e2ÞIs2e2XDX9
ðse1;e21s2e2ÞIs 2
e2XDX9 s
2 e2I 2 4 3 5 0 @ 1 A
1N 0 0 ;
ðs2
a112sa1;a21s2a2ÞA ðsa1;a21s2a2ÞðXDX9A1AXDX9Þ1s2a2XDX9AXDX9 ðsa1;a21s2a2ÞAs2a2AXDX9
ðsa1;a21s2a2ÞAs 2
a2AXDX9 s
2 a2A 2 4 3 5 0 @ 1 A:
ðA5Þ
APPENDIX B: THE CONDITIONS FOR THE PATTERN OF CRYPTIC EVOLUTION
The pedigree consists of F full-sib families, with midparental valuesyand midoffspring values z9 taken on n offspring. The vector of individual phenotypes is denoted asyandzwithE[y]¼E[z] (i.e., there is no phenotypic trend), and we wish to find the conditions under which a trend in predicted breeding valuesð Þuˆ is positive uˆy,uˆz
but masked by an annual environmental trend (by.bz).
Grouping individuals by family, with parents first, the records are associated with the year of measurement by the incidence matrix:
X¼
12 0
0 1n1
12 0
0 1n2 .. .
.. .
12 0
0 1nF 2 6 6 6 6 6 6 6 6 6 4 3 7 7 7 7 7 7 7 7 7 5
: ðB1Þ
With full-sib familiesA1has the structure
A1¼
I21n21J2;2 Jn1;2 J2;n1 2In1
0 0 0
0 I21
n2
2 J2;2 Jn2;2 J2;n2 2In2
0 0 .. . .. . 1 .. .
0 0 I21
nF
2 J2;2 JnF;2 J2;nF 2InF 2 6 6 6 6 6 6 6 6 4 3 7 7 7 7 7 7 7 7 5
ðB2Þ
and soQ¼I1ðs2 e=s
2 aÞA
1has the form
Q¼I1s
2 e s2 a
I21n12J2;2 Jn1;2
J2;n1 2In1
0 0 0
0 I21
n2
2J2;2 Jn2;2
J2;n2 2In2
0 0 .. . .. . 1 .. .
0 0 . . . I21
nF
2J2;2 JnF;2
J2;nF 2InF 2 6 6 6 6 6 6 6 6 6 6 6 4 3 7 7 7 7 7 7 7 7 7 7 7 5 ¼s 2 e s2 a s2 a s2 e 11
I21n12J2;2 Jn1;2
J2;n1 s 2 a s2
e 12
In1
0 0 0
0 s2 a s2 e 11
I21n22J2;2 Jn2;2
J2;n2
s2 a s2 e 12 In2 0 0 .. . .. . 1 .. .
0 0 . . .
s2 a s2
e 11
I21n2FJ2;2 JnF;2
J2;nF
s2 a s2 e 12
InF 2 6 6 6 6 6 6 6 6 6 6 6 6 6 6 6 6 6 6 6 4 3 7 7 7 7 7 7 7 7 7 7 7 7 7 7 7 7 7 7 7 5 ;
ðB3Þ
ˆ b ˆ u " # ¼
2F 0 0 Pn X9
X Q 2 4 3 5 1 P y P z y1 z1 y2 z2 .. . yF zF 2 6 6 6 6 6 6 6 6 6 6 6 6 6 6 6 6 6 4 3 7 7 7 7 7 7 7 7 7 7 7 7 7 7 7 7 7 5
2F 0 0 Pn X9
X Q
2 4
3 5 bˆ
ˆ u " # ¼ P y P z y1 z1 y2 z2 .. . yF zF 2 6 6 6 6 6 6 6 6 6 6 6 6 6 6 6 6 6 4 3 7 7 7 7 7 7 7 7 7 7 7 7 7 7 7 7 7 5
ˆby1uˆ y
ˆbz1uˆ z
ˆby1uˆ
y11r uˆ
y11n1ðuˆ
y1uˆ
z1Þ
h i
ˆbz1uˆ
z112r uˆ
z1uˆ
y1
h i
ˆby1uˆ
y21r uˆ
y21n2ðuˆ
y2uˆ
z2Þ
h i
ˆbz1uˆ
z212r uˆ
z2uˆ
y2
h i
.. .
ˆby1uˆ
yF1r uˆ
yF1nFðuˆ
yFuˆ
zFÞ
h i
ˆbz1uˆ
zF12r uˆ
zFuˆ
yF h i 2 6 6 6 6 6 6 6 6 6 6 6 6 6 6 6 6 6 6 6 6 6 6 6 6 4 3 7 7 7 7 7 7 7 7 7 7 7 7 7 7 7 7 7 7 7 7 7 7 7 7 5 ¼ E y½
E z½
y1
z19
y2
z29
.. .
yF
z9F
2 6 6 6 6 6 6 6 6 6 6 6 6 6 6 6 6 6 4 3 7 7 7 7 7 7 7 7 7 7 7 7 7 7 7 7 7 5 ;
ðB4Þ
wherer ¼s2 e=s2a.
Sinceuˆy¼0, by definition,E[y]¼by,
y1¼ˆby1uˆ
y11r uˆ
y11n1ðuˆ
y1 uˆ
z1Þ
h i
y1¼ˆby1uˆ
y1ð11r1rn1Þ rn1uˆ
z1
y1ˆby1rn1uˆ
z1 ð11r1rn1Þ
¼uˆy1
y1E y½ 1rn1uˆ
z1 ð11r1rn1Þ
¼uˆy1 ðB5Þ
and
z91 ¼ˆbz1uˆ
z112r uˆ
z1 uˆ
y1
h i
z91 ¼ˆbz1ð2r11Þuˆ
z1 2ruˆ
y1
z91ˆbz12ruˆ y1 ð2r11Þ ¼uˆ
z1 ðB6Þ
z91ˆbz12ruˆ y1 ð2r11Þ ¼uˆ
z1
z91ˆbz
ð2r11Þ1 2ruˆy1 ð2r11Þ ¼uˆ
z1
z91ˆbz
ð2r11Þ1 2r ð2r11Þ
y1E½y1rn1uˆ
z1 ð11r1rn1Þ
¼uˆz1
z91ˆbz
ð2r11Þ1
2r y1E½y1rn1uˆ
z1
h i
ð11r1rn1Þð2r11Þ ¼uˆz1
z19ˆbz
ð2r11Þ1
2rðy1E½yÞ ð2r11Þð11r1rn1Þ
1 2r
2n 1uˆ
z1 ð2r11Þð11r1rn1Þ
¼uˆz1
z91ˆbz
ð2r11Þ1
2rðy1E½yÞ ð2r11Þð11r1rn1Þ
¼uˆz1 1 2r 2n
1 ð2r11Þð11r1rn1Þ
z19ˆbz1
2rðy1E½yÞ ð11r1rn1Þ
¼uˆz1 2r11 2r 2n
1 ð11r1rn1Þ
ðz1ˆbzÞð11r1rn1Þ12rðy1E½yÞ ¼uˆ
z1ðð2r11Þð11r1rn1Þ 2r 2n
1ÞÞ ðy1E½yÞ2r1ð11r1rn1Þðz19ˆbzÞ
ð11r1rn1Þð2r11Þ 2r2n1
¼uˆz1
ðy1E½yÞ2r1ð11r1rn1Þðz19ˆbzÞ
ð11r1rn1Þ12rð11rÞ
¼uˆz1:
ðB7Þ
Sinceuˆz ¼E w ˆ½ uz9, where the expectation is over families andw¼n=nis the relative fitness of the parents,
ˆ
bz¼bˆyE w ˆ½ u9z
ˆ
bz¼bˆyE w
ðyE½yÞ2r1ð11r1rnÞz9 ð11r1rnÞ12rð11rÞ
1E w ð11r1rnÞˆbz
ð11r1rnÞ12rð11rÞ
ˆ
bz¼bˆyE w
ðyE½yÞ2r1ð11r1rnÞz9 ð11r1rnÞ12rð11rÞ
1ˆbzE w
ð11r1rnÞ ð11r1rnÞ12rð11rÞ
ˆ
bz 1E w
ð11r1rnÞ ð11r1rnÞ12rð11rÞ
¼bˆyE w
ðyE½yÞ2r1ð11r1rnÞz9 ð11r1rnÞ12rð11rÞ
E wðyE½yÞ2r1ð11r1rnÞz9
ð11r1rnÞ12rð11rÞ
¼bˆybˆz 1E w
ð11r1rnÞ ð11r1rnÞ12rð11rÞ
1 ˆ by
E wðyE½yÞ2r1ð11r1rnÞz9
ð11r1rnÞ12rð11rÞ
¼1bˆz
ˆ by
1E w ð11r1rnÞ
ð11r1rnÞ12rð11rÞ
ˆ bz ˆ by
¼1 ð1
=bˆyÞE wðyð1E1½yrÞ12rrn1Þð1112rrð111rnrÞÞz9
h i
1E wh ð11rð111rnrÞ11rn2rðÞ11rÞi
:
ðB8Þ
The denominator is positive when
0, 1E w ð11r1rnÞ
ð11r1rnÞ12rð11rÞ
1.E w ð11r1rnÞ
ð11r1rnÞ12rð11rÞ
1.1
nE
nð11r1rnÞ ð11r1rnÞ12rð11rÞ
n.E nð11r1rnÞ ð11r1rnÞ12rð11rÞ
n.E n
112rð11rÞ=ð11r1rnÞ
; ðB9Þ
1.1 ð1=bˆyÞE w½ ðððyE½yÞ2r1ð11r1rnÞz9Þ=ðð11r1rnÞ12rð11rÞÞÞ
1E w½ ðð11r1rnÞ=ðð11r1rnÞ12rð11rÞÞÞ
E w ð11r1rnÞ ð11r1rnÞ12rð11rÞ
. 1
ˆ byE w
ðyE½yÞ2r1ð11r1rnÞz9
ð11r1rnÞ12rð11rÞ
E w ð11r1rnÞ ð11r1rnÞ12rð11rÞ
.E wðy=E½y1Þ2r1ð11r1rnÞðz9=E½yÞ ð11r1rnÞ12rð11rÞ
E wð11r1rnÞðz9=E½y 1Þ ð11r1rnÞ12rð11rÞ
.E w ð1y=E½yÞ2r
ð11r1rnÞ12rð11rÞ
E wnð11r1rnÞðz9=E½y 1Þ ð11r1rnÞ12rð11rÞ
.E nð1y=E½yÞ2r
ð11r1rnÞ12rð11rÞ
: ðB10Þ
We can rewrite the family mean asz9¼y1Dz, whereDzis the deviation of the offspring mean from the midparental value, and noting thatE½ ¼y E y½ ,
E nð11r1rnÞðz9=E½y 1Þ
ð11r1rnÞ12rð11rÞ
.E nð1y=E½yÞ2r
ð11r1rnÞ12rð11rÞ
E nð11r1rnÞðy=E½y1Dz=E½y 1Þ
ð11r1rnÞ12rð11rÞ
.E nð1y=E½yÞ2r
ð11r1rnÞ12rð11rÞ
E nð11r1rnÞðDz=E½yÞ
ð11r1rnÞ12rð11rÞ
.E nð1y=E½yÞ2r1nð11r1rnÞð1y=E½yÞ
ð11r1rnÞ12rð11rÞ
E nð11r1rnÞðDz=E½yÞ
ð11r1rnÞ12rð11rÞ
.E nð113r1rnÞð1y=E½yÞ
ð11r1rnÞ12rð11rÞ
E nð11r1rnÞDz
ð11r1rnÞ12rð11rÞ
.E nð113r1rnÞ ðE½y yÞ
ð11r1rnÞ12rð11rÞ
E nð11r1rnÞDz
ð11r1rnÞ12rð11rÞ
.COV y; nð113r1rnÞ
ð11r1rnÞ12rð11rÞ
E nð11r1rnÞDz
ð11r1rnÞ12rð11rÞ
,COV y; nð113r1rnÞ
ð11r1rnÞ12rð11rÞ
COV Dz; nð11r1rnÞ
ð11r1rnÞ12rð11rÞ
1E nð11r1rnÞ
ð11r1rnÞ12rð11rÞ
E½Dz,COV y; nð113r1rnÞ
ð11r1rnÞ12rð11rÞ
:
ðB11Þ
APPENDIX C: WHY MOST PARENTS HAVE MORE SIBS THAN THEIR OFFSPRING UNDER A NEUTRAL MODEL
To show why parents on average will often have more sibs than their offspring we take the example of an asexual population. In generation 1 individualihasnioffspring andni,jgrandoffspring through theirjth offspring. We denote population size in each generation asNg,Np¼P
Ng
i ni, andNo¼P Ng i
Pni
j ni;j, where the subscripts g, p, and o indicate quantities taken over individuals in generation 1 (grandparents), generation 2 (parents), and generation 3 (offspring), respectively.
Our aim is to give the conditions under which parents, on average, have more sibs than their offspring,
0.Epjd.0½s9s; ðC1Þ
whered¼1 if an individual breeds and 0 otherwise, andsis the number of sibs it has ands9the number of sibs its offspring has. We subscriptEwithg,poroto indicate the individuals over which the expectation is taken.s9sis not defined if an individual does not breed, and hence the conditiond.0,
Epjd.0½s9s ¼
1 PNg
i
Pni
j di;j
XNg
i
Xni
j di;j ðni;j1Þ ðni1Þ
¼PNg 1
i
Pni
j di;j
XNg
i
Xn i
j di;j ni;jni
¼ PNg
i
Pni
j di;jni;j
PNg
i
Pni
j di;j
PNg
i
Pni
j di;jni
PNg
i
Pni
j di;j
¼PNgNp
i
Pni
j di;j
PNg
i
Pni
j di;jni
PNg
i
Pni
j di;j
; ðC2Þ
This implies
Np PNg
i
Pni
j di;j ,
PNg
i
Pni
j di;jni
PNg
i
Pni
j di;j
Np, XNg
i
Xni
j di;jni
Np
Ng
,
PNg
i
Pni
j di;jni
Ng
Np
Ng
,
PNg
i niPnjidi;j
Ng
: ðC3Þ
Pni
j di;jis the number ofi’s offspring that breed, and so denotingbias the proportion of individuali’s offspring that breed we havePni
j di;j¼nibiand
Eg½n,Eg½n2b
Eg½n,COVgðn2;bÞ1E½n2E½b
Eg½n,COVgðn2;bÞ1ðVARgðnÞ1Eg½n2ÞEg½b: ðC4Þ
If we assume the parental and offspring reproductive functions are independent, then COVg(n2,b)¼0 andEg[b]¼
1fp(0), wherefpis the probability mass function for the distribution of offspring from individuals in generationp.
Given the assumption of independence, we need to give the conditions under which
Eg½n,ðVARgðnÞ1Eg½n2Þð1fpð0ÞÞ: ðC5Þ
Here we show that this will be the case for some common distributions when population size is constant and the distribution of offspring in different generations is identically distributed.
For the Poisson distribution, we have
Eg½n,ðVARgðnÞ1Eg½n2Þð1fpð0ÞÞ
1,2ð1expð1ÞÞ
1,1:264: ðC6Þ
For a multinomial distribution with each parent having equal probability of success,
Eg½n,ðVARgðnÞ1Eg½n2Þð1fpð0ÞÞ
1, N 1
N 11
1 N 1
N
N
0,N 1
N
N 1
N
N11
N 1
N
N
1. N 1
N
N
1 N 1
N
N1
: ðC7Þ
Eg½n,ðVARgðnÞ1Eg½n2Þð1Fpð0ÞÞ
sp
1p ,
sp ð1pÞ2 1
ðspÞ2 ð1pÞ2
ð1 ð1pÞsÞ
1, 1
1p1
sp
1p
ð1 ð1pÞsÞ
1, 1
1p11
ð1 ð1pÞsÞ
0,ð1pÞ1 ð1
pÞs1 ð1
pÞs
1.ð1pÞs1ð1pÞs11
1.ð1pÞð1pÞ=p1ð1pÞ1=p; ðC8Þ