Enhancement of ECG Signal Using Ensemble
EMD Algorithm and Higher Order Statistics
Mohit Tyagi
1, Ranjeeta Yadav
2, Sanjay K. Singh
3P.G. Student, Department of Electronics & Communication Engineering, A.B.E.S. Engineering College, Ghaziabad,
India1
Sr. Assistant Professor, Department of Electronics & Communication Engineering, A.B.E.S. Engineering College,
Ghaziabad, India2
HOD, Department of Electronics & Communication Engineering, A.B.E.S. Engineering College, Ghaziabad, India3
ABSTRACT: There are different techniques and methods used in ECG signal processing that is denoising of ECG signal. The Ensemble Empirical Mode Decomposition Algorithm is one of them and is both an iterative and empirical process to decompose signal into IMF and further to decomposition instantaneous frequency data is extracted. This new intermittence approach avoided the problem of mode mixing happens during the original EMD process. EEMD method is designed to work well on nonlinear and nonstationary data set. As EEMD is a time-space analysis method, the length of the IMFs is same as the original signal thereby keeps the characteristics of varying frequency unchanged. The performance of this technique in denoising of ECG signal is based on the numerical values in terms of SNR and RMSE. The study is limited to signals corrupted by additive white Gaussian random noise.
KEYWORDS: Empirical mode decomposition (EMD), Intrinsic mode function (IMF), Hilbert-Huang transform
(HHT) Statistical parameters, RMSE, SNR.
I. INTRODUCTION
ECG identification technology is an emerging new biometric modality. Great progress has been made in the research about ECG biometrics, yet there are several open questions. These include factors associated with the ECG signal collection, heartbeats affected by different cardiac irregularities, noise involvement etc.
Vol. 7, Issue 6, June 2018
Fig. 1. Normal ECG waveform containing P, QRS, T & small U wave. P-R interval, P-R segment, Q-T interval, S-T segment, S-T interval, R-R interval, T-Q interval are the key paramenters as shawn in figure.
The fluctuation in these parameters leads to illness of the heart. Generally ECG picks up electrical impulses generated by the polarization and depolarization of cardiac tissue and translates into a waveform. Normal rhythm produces four entities as shawn below in figure.1 — a P wave, a QRS complex, a T wave, and a U wave — that each have a fairly unique pattern.
The P wave represents atrial depolarization.
The QRS complex represents ventricular depolarization.
The T wave represents ventricular repolarization.
The U wave represents papillary muscle repolarization.
However, the U wave is not typically seen and its absence is generally ignored. Changes in the structure of the heart and its surroundings (including blood composition) change the patterns of these four entities or we can say fluctuation in these parameters leads to illness of the heart. An ECG produces a pattern reflecting the electrical activity of the heart and usually requires a trained clinician to interpret it in the context of the signs and symbols the patient presents with. It can give information regarding the rhythm of the heart, whether that impulse is conducted normally throughout the heart, or whether any part of the heart is contributing more or less than expected to the electrical activity of the heart. ECG signal is contaminated with various artifacts during acquisition for example Power line interference, Patient electrode motion artifacts, Electrode-pop or contact noise, and Baseline Wandering and Electromyographic (EMG) noise. Analysis of ECG signals becomes difficult to inspect the cardiac activity in the presence of such unwanted signals. So, de-noising of ECG signal is extremely important to prevent misinterpretation of patient‘s cardiac activity. The paper is organized in such a way that Section I provides the fundamental knowledge about ECG signal and its characteristics, Section II provides theoretical analysis of denoising techniques using EMD algorithm & EEMD method. Section III provides performance measures & Finally section IV presents conclusion.
II. THEORETICALANALYSIS
distribution of signal amplitude (or energy), designated as the Hilbert spectrum, which permits the identification of localized features.
Empirical mode decomposition (EMD): The Hilbert–Huang transform (HHT) is designed to work well for data that
is nonstationary and nonlinear. In contrast to other common transforms like the Fourier transform, the HHT is more like an algorithm (an empirical approach) that can be applied to a data set, rather than a theoretical tool. The Hilbert–Huang transform (HHT) was proposed by Huang et al. a NASA designated. It is the combination of the empirical mode decomposition (EMD) and the Hilbert spectral analysis (HSA). The HHT uses the Empirical mode decomposition, an iterative process to decompose real signals into so-called intrinsic mode functions (IMF) with a trend, and applies the HSA method to the IMFs to obtain instantaneous frequency data. Since the signal is decomposed in time domain and the length of the IMFs is the same as the original signal, HHT preserves the characteristics of the varying frequency. This is an important advantage of HHT since real-world signal usually has multiple causes happening in different time intervals. Infact HHT provides a new method of analyzing nonstationary and nonlinear time series data.
Empirical mode decomposition (EMD) is the fundamental part of the HHT i.e an iterative process of Breaking down signals into various component, EMD can be compared with other analysis method such as Fourier transform, Wavelet transform & Particle Filter. Using the EMD Algorithm technique, any complicated data set can be decomposed into a finite and often small number of components. These components form a complete and nearly orthogonal basis for the original signal. In addition, they are described as intrinsic mode functions (IMF). Even in the time domain EMD is adaptive and highly efficient. As the decomposition of the signal is based on the local characteristic time scale of the data, it is applied to nonlinear & nonstationary processes. An IMF is defined as a function ψ of a real variable t then it must satisfy the following two conditions.
ψ has exactly one zero between any two consecutive local extrema.
ψ has zero ―local mean.‖
A function which is required to satisfy only condition (a) will be called a weak-IMF. In general, the term local mean in condition (b) may be purposefully ambiguous, but in the EMD procedure it is typically the pointwise average of the ―upper envelope‖ (determined by the local maxima) and the ―lower envelope‖ (determined by the local minima) of ψ.
Given a signal x(t), the effective algorithm of EMD can be summarized as follows [12]: 1. identify all extrema of x(t)
2. interpolate between minima (resp. maxima), ending up with some ―envelope‖ emin(t) (resp. emax(t))
3. compute the average m(t) = (emin(t) + emax(t)) / 2
4. extract the detail d(t) = x(t) − m(t) 5. iterate on the residual m(t)
In practice, the above procedure has to be refined by sifting process which amounts to first iterating steps 1 to 4 upon the detail signal d(t), until this latter can be considered as zero-mean according to some stopping criterion. Once this is achieved, the detail is considered as the effective IMF, the corresponding residual is computed and step 5 applies. By construction, the number of extrema is decreased when going from one residual to the next and the corresponding spectral supports are expected to decrease accordingly. While modes and residuals can intuitively be given a ―spectral‖ interpretation, it is worth stressing the fact that, in the general case, their high vs. low frequency discrimination applies only locally and corresponds by no way to a pre-determined sub-band filtering (as, e.g., in a wavelet transform). Selection of modes rather corresponds to an automatic and adaptive (signal-dependent) time-variant filtering.
Stoppage Criteria of the Sifting Process The stoppage criterion determines the number of sifting steps to produce an IMF. Following are the four existing stoppage criterion:
Standard Deviation
Vol. 7, Issue 6, June 2018
Threshold Method
Energy Different Tracking
Drawback of EMD: The major disadvantage of EMD is the mode mixing consequence and the End effect as well as
unstblity is also a problem with EMD. Mode-mixing shows that the oscillations of different time scales co-exist in a given IMF or oscillations with the similar time scale is being allocated to different IMFs. Specific signal may not be separated into the same IMFs every time. In 2D version the main disadvantage of EMD is the decomposition in two dimensions is extremely time consuming. Mode mixing problem can be avoided by including a intermittence test during the HHT process i.e EEMD.
Ensemble empirical mode decomposition (EEMD): EEMD utilizes the scale separation capability of the EMD, and
enables the EMD method to be a truly dyadic filter bank for any data. By adding finite noise, the EEMD eliminated largely the mode mixing problem and preserve physical uniqueness of decomposition. Therefore, the EEMD represents a major improvement of the EMD method. The basic principle of the EEMD is to separate signal s of different scales without undue mode mixing. Adding white noise helps to establish a dyadic reference frame in the time–frequency or timescale space. The real data with a comparable scale can find a natural location to reside. The EEMD utilizes all the statistical characteristic of the noise: it helps to perturb the signal and enable the EMD algorithm to visit all possible solutions in the finite (not infinitesimal) neighborhood of the true final answer; it also takes advantage of the zero mean of the noise to cancel out this noise background once it has served its function of providing the uniformly distributed frame of scales, a feat only possible in the time-domain data analysis.
Mode Mixing Problem:“Mode mixing” is defined as any IMF consisting of oscillations of dramatically disparate
scales, often caused by intermittency of the driving mechanisms. When mode mixing occurs, an IMF can cease to have physical meaning by itself, suggesting falsely that there may be different physical processes represented in a mode. Even though the final time–frequency projection could rectify the mixed mode to some degree, the alias at each transition from one scale to another would irrecoverably damage the clean separation of scales. Such a drawback was first illustrated by Huang et al.2 in which the modeled data was a mixture of intermittent highfrequency oscillations riding on a continuous low-frequency sinusoidal signal. An almost identical example used by Huang et al.2 is presented here in detail as an illustration[7].
End Effect: End effect occurs at the beginning and end of the signal because there is no point before the first data point and after the last data point to be considered together. In most cases, these end points are not the extreme value of the signal. While doing the EMD process of the HHT, the extreme envelope will diverge at the end points and cause significant error. This error distorts the IMF waveform at its endpoints. Furthermore, the error in the decomposition result accumulates through each repetition of the sifting process[10].
In a way, EEMD approach is essentially a controlled repeated experiment to produce an ensemble mean for a nonstationary data as the final answer. In a way, this new approach is truly a NADA method that is effective in extracting signals from the data.
EEMD can be summarized as follows[6]: 1. Add a white noise series to the targeted data.
2. Decompose the data with added white noise into IMFs.
3. Repeat step 1 and step 2 again and again, but with different white noise series each time. 4. Obtain the (ensemble) means of corresponding IMFs of the decompositions as the final result.
Basic script to generate input signal with noise:
N=length(x);
% original_signal=x; % n1=(1/2)*randn(1,N); % t=0:N-1;
% n2=sin(100*pi*t); % n3=(1/2)*sin(.666*pi*t); % n4=(.5)*(n1+n2)+n3; % x=n4+original_signal;
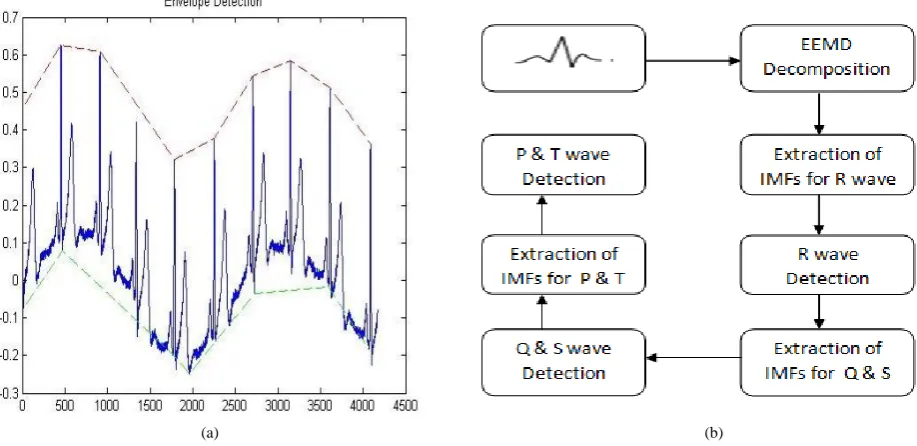
(a) (b)
Fig. 2. In figure 2 the Envelope Detection process is shawn in figure (a) and EEMD algorithm is shawn in figure (b).
III. PERFORMANCEEVOLUTIONOFEMD&EEMD
Vol. 7, Issue 6, June 2018
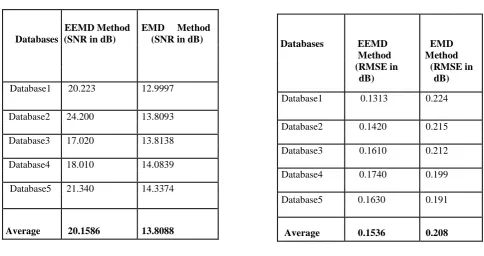
Table 3.1 SNR values for EMD & EEMD Table 3.1 RMSE values for EMD & EEMD
Databases
EEMD Method (SNR in dB)
EMD Method (SNR in dB)
Database1 20.223 12.9997
Database2 24.200 13.8093
Database3 17.020 13.8138
Database4 18.010 14.0839
Database5 21.340 14.3374
Average 20.1586 13.8088
IV.CONCLUSION
Our experience in using the EEMD brought up two other previously existing problems for the EMD method: the end effect and the stoppage criteria. Both the problems and their solutions are discussed in this paper. The confidence limit of the EMD-produced results have been addressed to some extent by Huang et al. it is percieved as the EEMD method provides an alternative, yet better, measure of confidence limit, since the EEMD-produced decompositions are much less sensitive to the stoppage criteria used and to the perturbations to data. As for the end effect, the noise-added processes help to ameliorate the difficulty, for with the added noise the end slope will be more uniformly distributed. Thus, the final results could avoid a deterministic drift in one direction or the other. Many investigator were introduced the various approaches and methods for ECG signal processing or to de-noise them. This paper provides us a comparison between EEMD & EMD algorithms. This paper includes applicability of such methods to ECG de-noising, their advantages and disadvantages. The comparative analysis of methods presented reveal that the EEMD is more efficient than the EMD de-noising method, and EEMD is superior to all, in terms of the signal-to-noise ratio and Root mean square error to improve corrupted ECG signals. Electrocardiography is of paramount importance in the understanding of cardiac rhythm and hence in the further development of pacing.
REFERENCES
[1] Neeraj kumar, Imteyaz Ahmad, Pankaj Rai ―Signal processing of ECG using Matlab ‖International journal of Scientific and Reasearch Publications, volume 2,Issue 10, October 2012 pg no.1-6.A
[2] N.E. Huang, Z. Shen, S.R. Long, M.L. Wu, H.H. Shih, Q. Zheng, N.C. Yen, C.C. Tung and H.H. Liu, ―The empirical mode decomposition and
Hilbert spectrum for nonlinear and non-stationary time series analysis,‖ Proc. Roy. Soc. London A, Vol. 454, pp. 903– 995, 1998
[3] Changnian Zhang, XiaLi and Mengmeng Zhang, ―A novel ECG signal denoising method based on Hilbert-Huang Transform‖ International
Conference on Computer and Communication Technologies in Agriculture Engineering 2010
[4] Anil Chacko and Samit Ari, ―Denoising of ECG signals Decomposition IEEEInternational Conference On using Empirical Mode based
technique Advances In Engineering, Science And Management (lCAESM -2012) March 30, 31, 2012
[5] A Wavelet Tour of Signal Processing, 3rd ed. Stéphane Mallat. Academic Press, dec . 2008
[6] Digital Image Processing, S. Jayaraman, S. Esakkirajan And T. Veerakumar. Tata McGraw - Hill Education Pvt. Ltd.
[7] M. Arulampalam, S. Maskell, N. Gordon and T. Clapp, ―A turorial on particle filters for online nonlinear/non-Gaussian Bayesian
tracking,‖IEEE Trans. On Signal Proc. 50 (2), pp. 174-188, 2002
Databases EEMD EMD
Method Method
(RMSE in dB)
(RMSE in dB)
Database1 0.1313 0.224
Database2 0.1420 0.215
Database3 0.1610 0.212
Database4 0.1740 0.199
Database5 0.1630 0.191
[8] P. E. McSharry, G. D. Clifford, L. Tarassenko, and L. A. Smith, ―A dynamic model for generating synthetic electrocardiogram signals,‖ IEEE Trans. Biomed. Eng., vol. 50, no. 3, pp. 289–294, Mar. 2003
[9] P. Flandrin and P. Gonçalves, ―Empirical mode decompositions as data-driven wavelet-like expansions,‖ Int. J. Wavelets, Multires., Inf.
Process., vol. 2, no. 4, pp. 477–496, 2004
[10] A. Gotchev, N. Nikolaev, and K. Egiazarian, ―Improving the transform domain ECG denoising performance by applyinginterbeat and
intrabeat decorrelating transforms,‖ in Proc. 2001 IEEE Int. Symp. Circuits Syst. (ISCAS), Sydney, 2001, pp. 17–20
[11] Z. Wu and N. E. Huang, Statistical significant test of intrinsic mode functions, in Hilbert–Huang Transform: Introduction and Applications,
eds. N. E. Huang and S. S. P. Shen (World Scientific, Singapore, 2005), pp. 125–148.