INVESTIGATION
Empirical Complexities in the Genetic Foundations
of Lethal Mutagenesis
James J. Bull,*,†,‡,1Paul Joyce,§,** Eric Gladstone,* and Ian J. Molineux†,††
*Institute for Cellular and Molecular Biology,†Center for Computational Biology and Bioinformatics,‡Department of Integrative Biology, and††Department of Molecular Biosciences, University of Texas, Austin, Texas 78712, and§Department of Mathematics and **Department of Statistics, University of Idaho, Moscow, Idaho 83844
ABSTRACTFrom population genetics theory, elevating the mutation rate of a large population should progressively reduce average fitness. If the fitness decline is large enough, the population will go extinct in a process known as lethal mutagenesis. Lethal mutagenesis has been endorsed in the virology literature as a promising approach to viral treatment, and severalin vitrostudies have forced viral extinction with high doses of mutagenic drugs. Yet only one empirical study has tested the genetic models underlying lethal mutagenesis, and the theory failed on even a qualitative level. Here we provide a new level of analysis of lethal mutagenesis by developing and evaluating models specifically tailored to empirical systems that may be used to test the theory. Wefirst quantify a bias in the estimation of a critical parameter and consider whether that bias underlies the previously observed lack of concordance between theory and experiment. We then consider a seemingly ideal protocol that avoids this bias—mutagenesis of virions—butfind that it is hampered by other problems. Finally, results that reveal difficulties in the mere interpretation of mutations assayed from double-strand genomes are derived. Our analyses expose unanticipated complexities in testing the theory. Nevertheless, the previous failure of the theory to predict experimental outcomes appears to reside in evolutionary mechanisms neglected by the theory (e.g., beneficial mutations) rather than from a mismatch between the empirical setup and model assumptions. This interpretation raises the specter that naive attempts at lethal mutagenesis may augment adaptation rather than retard it.
L
ETHAL mutagenesis is extinction of a viral population by artificially elevating its mutation rate. The concept was originally inspired by Eigen and Schuster’s “error catastro-phe”theory that has commonly been construed to represent extinction at high mutation rate, and then by evidence that an antiviral drug known as ribavirin acts in part by elevating viral mutation rates (Eigen 1971; Eigen and Schuster 1977; Eigen et al. 1988; Crotty et al. 2001; Graci and Cameron 2002). In the past decade, a variety of studies have also shown that mutagenic drugs can extinguish viral popula-tions in tissue culture (Crotty et al. 2001; Anderson et al. 2004; Chunget al.2007; Martinet al.2008).It is obvious that a sufficiently high rate of lethal mutations will extinguish a population. Less obvious is the minimum mutation rate that will cause extinction over time and what
deleteriousfitness effects are needed for extinction. One model proposed for lethal mutagenesis of asexual organisms is based on the principle that a large population subjected only to deleterious mutations every generation will eventually decay to afitness equilibrium of
WN¼W0 mð0Þ; (1a)
whereW0is the initial meanfitness of the population prior
to mutagenesis andm(0) is the probability that an offspring escapes deleterious mutation (Kimura and Maruyama 1966). Under a Poisson model of mutation with an average of U deleterious mutations per generation, this equation becomes
WN¼W0 e2U: (1b)
Extinction ensues if the baseline fecundity W0is not large
enough to offset thefitness decline from mutation, but con-versely, a sufficiently high fecundity can offset any negative impact of mutations and avoid extinction (Bullet al.2007). The Poisson model lends itself to many useful extensions
Copyright © 2013 by the Genetics Society of America doi: 10.1534/genetics.113.154195
Manuscript received June 10, 2013; accepted for publication July 29, 2013 Available freely online through the author-supported open access option.
1Corresponding author: Department of Integrative Biology, University of Texas, 1
and will be assumed in much of what follows. However, a Pois-son process need not operate, and (1a) gives the general result. A limitation of both models is that beneficial mutations are omitted; beneficial mutations are no doubt inescapable in most systems and obviously raise fitness above that predicted by deleterious mutations alone. Recent work has begun to address mutation processes that include deleteri-ous and beneficial mutations (Gerrishet al.2013). A second and subtle point is that the equilibria in (1a) and (1b) hold only up to certain types of error catastrophe (Eigen and Schuster 1977; Eigen et al. 1988; Wiehe 1997; Bull et al. 2007). The standard model of an error catastrophe is loss of the mutation-free genotype in favor of a mutationally robust genotype or network, a robustness that buffers the popula-tion against extincpopula-tion at higher mutapopula-tion rates (Wilkeet al. 2001; Wilke and Adami 2003). However, the full set of pro-cesses considered as error catastrophes is diverse and not easily connected to biology (Wiehe 1997), so the results in (1) cannot be generalized to account for error catastrophes. These equilibria have four noteworthy properties. First, the equilibria apply to large populations; stochastic effects do not enter. Second, effect size and epistasis of the mutations do not matter to the equilibrium. However, equilibrium applies in the long term; effect sizes and epistasis do influence the rate of approach to equilibrium. Third, and true only for (1b), the mutation rate enters as an exponent; thus small changes in the mutation rate have large effects onfitness. Last, genome size does not enter directly, only the deleterious mutation rate per genome.
The single empirical test of this model, applied to the virus T7, failed to observe any decline in fitness after 200 generations of continuous mutagenic growth in large exper-imental populations, even though the predicted decline based on this equilibrium was large (Springmanet al.2010). To the extent that those results reflect an underlying misunderstand-ing of the fitness consequences of mutation, this failure sug-gests that attempts to induce lethal mutagenesis may be misguided and have the unintended consequence of provid-ing raw material for adaptation. The failure also inspires attempts to understand the basis of the discrepancy between predicted and observedfitness.
A central question motivated by that empirical test is whether the model failure resides at a fundamental level, such as failing to capture fundamental genetic and evolutionary principles or instead resides at a technical level whereby the specific implementation of the test is a poor match to the assumptions of the model. The purpose here is to develop the theory of lethal mutagenesis as it applies to the types of empirical systems and assays that may be easily employed with viruses, with the specific goal of resolving the question.
The T7 Mutagenic Protocol
In prior work, T7 was grown in cultures of hosts infused with the mutagen N-methyl-N9-nitro-N-nitrosoguanidine (Springman et al. 2010). Hosts were replaced every few
generations, but phage populations were propagated se-quentially. The major direct effect of this mutagen on the phage is manifested intracellularly, during viral replication, as an increase in mutation rate. The measured number of mutations per genome per infection was four to six, depend-ing on protocol, the lower value bedepend-ing the approximate num-ber of viable mutations. However, mutations accumulate continually, and their cumulative effect is expected to ulti-mately decrease fitness toward the equilibrium, hence the need for serial propagation across hundreds of generations.
Both the bacteria and phage are adversely affected by mutagen, however, and the bacteria are greatly impaired in their ability to support phage growth. Thus there is a strong physiological effect of the mutagen on phage fitness that is not manifested through mutations, and this physiological effect must be partitioned intoW0to parameterize the model.
Phagefitness was measured as growth rate in the mutagenic environment, a log2transform of the per-capita increase in
phage numbers per unit time.
Structure of the Article
The question motivating this study is the previously ob-served failure offitness decline under mutagenesis in phage T7. This article considers possible reasons for this failure and an alternative empirical approach to testing the model, using the following organization:
1. Thefirst part of the article addresses the possibility that the methodology for estimating baselinefitness isflawed; new theoretical results are proposed, the original T7 study is reconsidered, and a new set of empirical results is offered.
2. Second, the article considers an alternative empirical sys-tem that seems ideal for testing the theory: mutagenic treatment of free virus particles. Prior empirical work on this type of system is reviewed, and new theory is de-veloped to address an apparent empirical anomaly. Data using the mutagen hydroxyamine on T7 are presented and used to infer limitations of that system.
3. Third, a complexity is noted in the conversion between measured mutation rate and thefitness impact of those mutations.
Results
Estimatingfitness in the mutagenic environment: Deleterious mutations confound the baseline estimate
The fitnesses in Equations 1a and 1b apply to the environ-ment in which the virus is grown while being subjected to mutation. Thus, it is necessary to measure both the baseline
fitness,W0, and thefinalfitness,WN, in that environment.
parameterizing the model is that measuring W0in the
mu-tagenic environment introduces mutations, during the assay, that confound a precise estimate ofW0.
The fitness consequences of viral growth in the muta-genic environment may be partitioned as follows:
1. Mutagen impairs bacterial physiology and growth, reduc-ing the number of phage progeny produced by the cell; although fewer progeny are produced, the progeny pro-duced are not affected by this mechanism.
2. Progeny viruses from hosts grown in mutagen potentially have structural defects in their virions; these effects are not heritable but they do affect the ability of those prog-eny to initiate infections.
3. Replication of viruses in hosts grown in mutagen intro-duces nonlethal mutations in progeny viral genomes; these effects are heritable, affectingfitness across future generations.
4. Viral replication in hosts grown in mutagen introduces lethal mutations in some progeny; progeny with lethal mutations leave no descendants and cannot be counted.
The difficulty is that the nonheritable effects are con-founded with heritable effects when measuring (initial)
fitness, but the model requires that only the nonheritable effects be included. Suppose the burst size (fitness in this example) of the wild-type genome in the absence of mutagen is 100. Thefitness assay conducted in the presence of mutagen reveals a (viable) burst of 30 for the wild type, giving the impression that W0is 30. However, suppose the
host has reduced ability to support phage growth—effects 1 and 2 in the list above—and that the trueW0is 50; lethal
mutations kill all but 60% of those progeny. The value ofW0
is thus 50, not 100 nor 30. Yet there is no obvious way to disentangle the nonheritable effects of mutagen on the host from the effect of mutagen in killing 40% of the actual progeny. Ignoring the problem and treating the observed 30 asW0leads to predicting too low of afinalfitness; hence
the model would be rejected even if it was correct. In the case of T7, the initial fitness W0 was based on an assay
spanning six generations, so the effect is possibly substan-tial. How serious, then, is the expected impact of the early mutations?
The decline infitness with continual mutagenesis
Thefitness impact of mutagenesis is easily calculated under the Poisson model. Johnson (1999) provided a set of recur-sions by which the impact of progressive mutation may be calculated iteratively, although the formula we need remains to be derived. Let all mutations be deleterious. Within the set of deleterious mutations there arenclasses according to their effect size: those with deleterious effectsiarise at
ge-nomic rate Ui. The combined deleterious rate across all
mutations is PiUi¼U. We further assume the convenient
property that a genome’s fitness declines multiplicatively with its set of mutations. Mean fitness after k generations of mutation and selection is
Wk ¼W0 e2Uþ Pn
i¼1½Uið12siÞ k
(2)
(Appendix). Meanfitness in thefirst two generations of ex-posure and selection follows W1¼e2sU and W2¼
e2Uþ
Pn i¼1Uið12siÞ
2
¼eUð22sþs2þVarðsÞÞ (for s¼Pn iUisi=U).
Wkþ1 is always smaller thanWkexcept in the extreme case
that all mutations are either neutral or lethal. With appro-priate limits on the mean and higher-order moments of s, meanfitness declines approximately as the powerkearly in the process.
The mutation load experienced in thekth generation of mutagenesis isW02Wk. The residual load, i.e., that
expe-rienced beyond generationk, is thusWk2WN. This residual
load is what is measurable in protocols that assay initial
fitness during exposure to mutagen, for assays lastingk gen-erations. Ass/1, the residual load vanishes even at lowk because the full effect of mutation is experienced after few generations of mutagenesis.
From (2), there are important consequences of a muta-genesis protocol using fitness measured in the mutagenic environment. Overall, the observed decline in fitness be-tween the initial and final estimates will be less than the true negative impact of mutations on fitness, as given by (1b). The observational bias is worse still if the“final” pop-ulation has not attained equilibrium. This bias arises be-cause the observed initial fitness is confounded by deleterious mutations accumulating during the assay, and the bias increases the larger the mutational effects and the longer the assay continues. Failure to account for this bias— by assuming that the initial fitness estimate representsW0
instead ofWk—will overpredict the expectedfitness decline from a high mutation rate. The theory would then be tested inappropriately.
A few comments about model (2) are warranted. First, the model assumes an infinite number of sites in each classi. Thus a genome can theoretically experience and accumulate infinitely many mutations in each class. Second, the model admits beneficial mutations (sj,0), but with even a single
class of beneficial mutations, fitness increases without bound as k increases to infinity (Uj(1 2 sj)k / N). The
unbounded fitness is due to the infinite sites assumption, which allows genomes to accumulate ever-increasing num-bers of beneficial mutations (as favored by selection). Con-sequently, use of (2) with beneficial mutations should be limited to the initial generations of mutagenesis. The long-term equilibrium may be calculated for a finite number of beneficial mutations by assuming that initial genotype has already acquired the beneficial mutations (withW0adjusted
accordingly).
experienced in the first generation and will not be detect-able by many methods that assay fitness in the mutagenic environment. The average fitness effect of all mutations is
20.3 and20.36 for the two phages, and even more nega-tive for VSV. By this measure as well, there should be a sub-stantialfitness decline in thefirst few generations.
T7 revisited
In the study of bacteriophage T7 mutagenesis, initial growth rate of the wild-type virus in the mutagenic environment was 18.3 doublings/hr (Springmanet al.2010). From a di-rectly measured 4.3 viable mutations per genome per gen-eration, the viable deleterious mutation rate was converted to 2.6 by assuming a deleterious fraction of 0.6 (based on direct estimates from other viruses). A model similar to that in Equation 1b but tailored to viral growth rate gave a pre-dicted equilibrium of 8.6 doublings/hr. The observedfitness after 200 generations of propagation was 21.9, higher than
fitness of the initial virus and a profound failure of the the-ory. Per 20 min viral generation, the difference between 21.9 and 8.6 is equivalent to a 20-fold difference in number of offspring.
Several possibilities were addressed in attempting to account for those results (Springmanet al.2010):
1. The phage may have evolved a lower mutation rate dur-ing the adaptation. T7 encodes its own DNA polymerase (DNAP) for genome replication, and resistance to muta-gen could easily have evolved in that muta-gene. However, a replicate evolution in which the phage DNAP was pre-vented from evolving exhibited a similar lack of fitness decline.
2. Deleterious fitness effects may be too small to expect a fitness drop in 200 generations. This possibility is in-consistent with thefitness effects of mutations reported in other viruses.
3. With 200 generations of evolution, beneficial mutations may have been able to ascend and offset the decline. The trajectory of fitness evolution supported this possibility, but with only a small magnitude of effect:fitness at 15 generations was not significantly below that of the esti-matedW0, butfitness at 80 generations showed a
signif-icant but small decline of about one doubling per hour below that ofW0. Fitness at generation 200 thus implied
a rise from generation 80 of about four doublings per hour. The question was whyfitness exhibited such a mod-est decline at the earlier time points.
The question raised by the preceding analysis is whether the predicted impact of mutations was affected by a biased estimate ofW0. It is of course not possible to explain afitness
increase from this bias, but an upward correction of the predictedfinalfitness certainly helps reduce the discrepancy. The solution suggested by (2) is to correct for the early accumulation of deleterious mutations. However, if the dis-tribution of deleteriousfitness effects is not known, the cor-rection is not straightforward.
As one approach, Springman et al. (2010) developed a model that partitioned lethals separately from other dele-terious mutations and then parameterized the model so that the predicted fitness drop was restricted to the nonlethal component. This correction mirrors the one suggested above—thefitness impact of lethals on meanfitness is the same from thefirst generation onward so is independent of the duration of thefitness assay. In contrast, thefitness im-pact of nonlethals accumulates gradually and is thus possi-bly detectable when comparing assays of different durations.
Partitioning the deleterious mutation rateUinto a lethal rate (UL) and a nonlethal rate (UnL), Equation 1b may be
rewritten as WN¼ ðW0 e2ULÞ e2UnL. The product in
paren-theses is the initial viablefitness. This value corresponds to the 30 in our example three sections above and is easily measurable. Using this adjusted fitness as initial fitness, the predicted decline from other deleterious mutations is now the component due to nonlethals, e2UnL. This decline should accumulate gradually and thus be detectable with the methods used in the study, to the extent that the average effect of nonlethal, deleterious mutations is small. Of course, this drop does not represent the full negative impact of deleterious mutations, but understanding its magnitude could facilitate resolving the enigma of T7 evolving higher
fitness under mutagenesis.
As the standard fitness assay spans several generations and thus might have partitioned some of the nonlethal component into W0e2UL, the T7 study estimated initial fi
t-ness in two ways. One method directly measured fitness (growth rate) from viral titers compared between three and six generations, so that estimate would indeed have been depressed below its true value by the early accumula-tion of nonlethal mutaaccumula-tions. The other estimate, which avoids this problem, parameterized afitness function using
fitness components obtained during thefirst generation of mutagen exposure. This latter method should avoid the effects of deleterious mutations, save for lethal mutations (which were already accounted for by using the viable burst size).
The twofitness estimation methods gave broadly similar values, albeit variance in the fitness function estimate was not quantified. Consequently, there was no obvious bias attributable to nonlethals accumulated during the first six generations of mutagenic growth. For bothfitness estimates, the long-term predictedfitness decline was the component based on the nonlethal mutation rate, and a directly measured nonlethal mutation rate was used to parameterize that component. The predicted decline was substantial and profoundly at odds with thefitness increase observed at the end of the experiment. Thus it does not seem that the failure of the theory is due to a biased initialfitness estimate.
A surrogatefitness measure in T7
To test the model appropriately, the assays used to estimate
mutagenic evolution; thus the most appropriatefitness assay environment would use mutagenic growth. For short-term evolution, however, fitness measured in a nonmutagenic environment may correspond to fitness in the mutagenic environment so that alternative fitness assays are accept-able. Specifically, if most mutations deleterious in the mutagenic environment are also deleterious in a surrogate environment, the fitness decay over a few generations of mutagenesis may parallel each other in the two environ-ments. A fitness decline may then be more easily docu-mented in a nonmutagenic environment and be free of the estimation biases noted above. In the long term, adaptive evolution specific to the mutagenic environment may de-stroy any correspondence in fitness between the two environments, but this problem will not arise in the very short term.
We thus attempted an alternative fitness assay of T7 exposed to mutagen to shed light on these anomalies of initialfitness measures. As in prior work, T7 was grown on cells exposed to nitrosoguanidine to introduce mutations, but here fitnesses of those stocks were assayed in the absence of mutagen. We obtained samples of phage exposed for zero generations (mutagen-free control), exposed for one generation, or exposed for three generations. These phage were then added to separate, mutagen-free cultures of cells, with titers determined at 2 min and 13 min; the sample at 2 min represents the number of viable parent phage and the sample at 13 min represents the number of progeny after a single infection cycle. For the mutation-free control, burst occurs at just under 11 min (Heineman and Bull 2007), so the titer at 13 min should be an effective burst size. For mutated genomes, the effective burst may be re-duced by three mechanisms—reduced adsorption rate, re-duction of progeny in the cell, and delay of burst (an infected cell not yet burst plates as a single progeny phage). If there is a rapid accumulation of deleterious, nonlethal mutations during the first few generations of mutagenesis, these effective burst sizes should decline progressively with the number of generations of exposure.
Figure 1 reveals that the highest effective burst size is with no exposure (red squares), but no further decline is seen between 1 and 3 generations of exposure (solid blue and open black circles). There is thus an apparent contra-diction here: from Equation 2, a decline in thefirst genera-tion should be followed by addigenera-tional declines in the next few generations unlesssis near 1. Herein lies a methodolog-ical problem, however. The observed decline in thefirst gen-eration need not be due to classic mutations; it could be due to mutagen effects on the nongenomic part of the virion or to epigenetic effects on the genome (see the following sec-tion for an example of the former). Thus these data fail to provide clear evidence of a short-termfitness decline from nonlethal mutations. These results are consistent with those of Springman et al. (2010), whose assay of initial fitness based on six generations of mutagenic growth matched the estimate based on one generation. The failure of T7
fitness to decline on long-term mutagenic propagation appears to reside at a fundamental level of evolution, such as neglecting beneficial mutations or overestimating the del-eterious fraction of mutations, not to a confounded estimate ofW0.
Avoiding problems with in vivo mutagenesis: Virions exposed to mutagen
If viral growth in the presence of mutagen confounds mutagenic effects on the virus with impairment of host, one solution is to mutate the genome separately from the host, by treating free virus particles (virions) with mutagen. Thefitness of both the wild-type and mutated viruses can be measured in the mutagen-free environment, fully avoiding the estimation biases highlighted in the preceding section. If sequencing is employed to measure the average mutation rate, and a Poisson distribution is assumed for the incidence of mutations per genome, the surviving fraction of virions can be used to calculate the lethal mutation rate. An average burst size among the survivors may even be used to estimate an average fitness effect of nonlethal mutations.
Virion survival upon exposure to mutagens was assayed extensively nearly half a century ago (e.g., Benzer 1961; Tessman et al. 1964, 1965; Tessman 1968; Botstein and Shortle 1985). For chemicals supposedly creating base changes (hydroxylamine, nitrous acid, EMS, MMS), the typ-ical decay in viability was log-linear with time of exposure.
Figure 1 Effective burst sizes after exposure to nitrosoguanidine for zero, one, and three generations. Across three trials, there is a clear pattern of decline from zero- to one-generation exposure and no evident decline from one- to three-generations exposure. For each trial (conducted with a different, freshly mutagenized phage stock) the three pairs of values exhibit statistically significant heterogeneity. Methods: Populations of T7Hi from Heineman and Bull (2007) were grown in 10mg/ml of the mutagen nitrosoguanidine for a single infection cycle (one generation, or 1 g), or for 70 min (three generations) or grown without mutagen (zero gener-ations) and collected over chloroform to kill cells. These phage stocks were then added to mutagen-free cells that had been grown for 1 hr to a density of 13108cells/ml and plated at 2 min and 13 min after
Log-linear decay is expected if there is a constant rate of lethal mutations per unit time, even if the fraction of muta-tions that are lethal differs across genes. For example, if the mutation rate per unit time isUifor gene i(U is the total
genomic rate and Ui =piU) and the lethal fraction within
that gene is Li, the viable fraction of genomes viable (V)
under a Poisson model is
V¼
Q
i
e2UiLi or
logðVÞ ¼ 2
P
i
UiLi
¼2U
P
i
piLi¼ 2 UL;
(3)
wherePipi¼1.Lis independent of the total mutation rate,
so if the mutation rateUis linear with time of exposure, the plot of log(V) will decline linearly with time, as commonly reported. In phage T4, for example, the log linearity spans the entire viability plot, nearly 6 orders of magnitude sur-vival (Tessman 1968).
At face value, the virion survival methods developed in this early work are ideally suited to test the foundations of lethal mutagenesis theory, because they seem to provide genome survival rates that could be aligned with base substitution rates. However, there are reasons to question whether those mutagens act solely or even primarily through classical mutations. Consider the mutagen hydrox-ylamine, reported to induce largely C/T transitions. Using phage T4, Tessman (1968) observed log-linear declines in viability across 5–6 orders of magnitude with time of expo-sure. Mutations in the survivors were detected phenotypi-cally in a diagnostic phage gene, indicating that at least some of the mutagen’s effect was an induction of standard mutations. However, base substitutions may not be the only cause of virion death. Hydroxylamine is also known to cause breaks in DNA and to cleave specific protein bonds, both of which will cause virion death (Rhaese and Freese 1968; Tessman 1968; Tayloret al.1970; Raukoet al.1993; Robins et al.2013). Thus, virion decay may be due to a combination of effects, only some of which are due to classic mutations.
Is log linearity expected from point mutations?
Another reason to question whether log-linear survival under chemical mutagenesis is due chiefly to base changes comes from recent work measuring retention of protein function for genes subjected to various base substitution rates. In these studies, mutations were generated by error-prone PCR and average base substitution rates from libraries of clones were evaluated directly by sequencing. Relation-ships between base substitution rate and protein survival did not obey log linearity but instead exhibited a shoulder effect, with an accelerating downward slope at higher mutation rates—as if robustness to mutation deteriorated once a few mutations were acquired in the protein (Bloomet al.2005, 2006, 2007). This curvature implies negative epistasis on a multiplicativefitness scale, the deleterious effects of
muta-tions together being stronger than when alone. The absence of log-linear survival for individual proteins seems incom-patible with log linearity of genome survival. However, it is not intuitive how much deviation from log linearity to ex-pect at the genome level when log linearity is violated at the gene level. We thus offer a model bridging the two pro-cesses. The model is simplified for analytical tractability.
Suppose that there arengenes in the genome. Genome survival is the product of gene survival rates across all genes. Let survival of geneibe 1 in the absence of mutation, 12s for a single mutation, and 0 for two or more mutations in that gene; the latter assumption implies negative epistasis within genes on the multiplicative scale except for s = 1. (Lethality of two or more mutations is assumed because it greatly facilitates the calculations.) Let the mutation rate of gene ibeUi(
P
iUi¼U), and for further mathematical
ne-cessity, all genes have the same mutation rate,: Ui=U/n,
and all mutations have the samefitness effect,s.
The surviving fractions for genomes with different num-bers of mutations are calculated as follows. Let Yi be the
number of mutations arising in geneiat rateU/n. The prob-ability ofksingle mutations in any set ofkgenes is
n
k
times the probability that the singles fall in thefirstkgenes (since all possible combinations have the same probability) and is
n
k
!
PðY1¼1;Y2¼1;⋯;Yk¼1;Ykþ1¼0;⋯;Yn¼0Þ
¼ n
k
!hU
ne2U=n
ikh
e2U=n
in2k
¼ n
k
!
U n
k
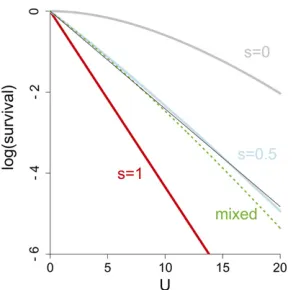
e2U: Figure 2 Log survival per mutation rate for different values of s for a genome with 30 genes (n= 30) from Equation 4; all genes experience the same value of sexcept where indicated. The gray curve represents maximal epistasis within genes (s= 0), the red line is no epistasis (s= 1), and the blue curve represents intermediate epistasiss= 0.5 (epistatic if fitness is multiplicative within genes). The curve fors= 1 is strictly linear. The thin black line overlaid on the blue curve is also strictly linear, so the blue curve is seen to bend only slightly. The dashed green curve repre-sents a genome with an equal mix of genes withs= 1 ands= 0 and is seen to have slightly greater curvature than the curve fors¼1
2. However,
A genome withksingle mutations has survival (12s)k, so
viability over all possible numbers of single mutations per genes becomes
V ¼ Pn
k¼0
n
k
!
Uð12sÞ
n
k
e2U
¼ Pn
k¼0
n
k
!
Uð12sÞ
n
k
ð1Þn2ke2U¼
1þUð1n2sÞ n
e2U: (4)
When s = 1, we recover the result that survival is merely e2U. Ifs = 0, and then as nincreases without bound, the
survival probability approaches eUe2U = 1. This result is
easily understood: with infinitely many genes and afinite number of mutations, two mutations never fall in the same gene.
As seen in Figure 2, the deviation from log-linear viability is pronounced for strong epistasis (s = 0, gray curve) but barely detectable for moderate epistasis (s¼1
2, blue line).
The slopes are greatly affected by s, but it is the curvature that is of interest when interpreting the published data, as we have no basis for interpreting that slope. The observation of log linearity for whole genomes is thus visually compat-ible with moderate epistasis at the level of individual genes. For comparison to the s¼1
2 case, the figure also shows
a curve for a mixed genome in which half the genes experi-ence s = 1 and the other half experience s = 0 (viability follows ð1þ ðU=nÞÞn=2e2U). The latter shows a slightly
greater curvature than does s¼1
2 (dashed green line) but
is still not pronounced; curvatures forsbetween1
2and 1 are
likewise slight (not shown). While the generality of these results remains to be demonstrated with more realistic mod-els, the suggestion here is that log linearity is only slightly violated by moderate levels of epistasis within genes.
Hydroxylamine and T7
Using T7, we revisited the effect of hydroxylamine on virion survival and also measured mutation rates of DNA extracted from exposed virions over a three- to four-log drop in survival (Table 1). The viability varies fivefold across the three trials for the longest treatment time (45 hr) and two-fold for the 21-hr treatments. When subtracting baseline error/mutation rates, nearly the total increase in average
mutations per genome is due to C / T transitions, as expected for this mutagen. To attribute the loss in viability to the measured increase in point mutations, consider the 21-hr data. The most generous, high survival rate is 0.05, and the excess mutations per genome is 4.6. The lethal fraction (L) of those mutations under a Poisson model is found as e24.6L = 0.05, orL = 0.65. Considering that
ap-proximately one-third of the genome is nonessential, that the lethal rate observed in a variety of small genome viruses ranges from 0.2 to 0.4 (Sanjuánet al.2004; Domingo-Calap et al.2009), and that only1/5 of residues of an essential T7 protein are lethal when mutated (Robinset al.2013), it appears that the loss in viability from exposure to hydroxyl-amine is too high to be explained by the observed rate of point mutations (under a Poisson model).
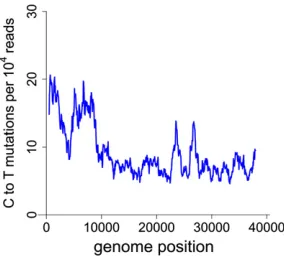
A possible concern with virion mutagenesis is an unequal distribution of mutations across the genome. DNA density in phage heads is 500 mg/ml, approaching crystalline density (Earnshaw and Casjens 1980). If only a small fraction of the genome is exposed to mutagen, as may be plausible, the observed relationship between average mutation rate and virion survival may poorly reflect the genome-wide toler-ance of mutations. A plot of C / T mutation frequency across hydroxylamine-treated genomes suggests only mod-est variation in exposure across different regions (Figure 3). As the sliding window method obscures site–site variation on a local scale, we also counted the incidence of sites with no mutations, singles, and so on (17586, 837, 134, 40, 11, 7, 1, 1), observing one site each with six and seven muta-tions. Ignoring the site–site variation in number of reads, these numbers show a strong violation of Poisson due to an excess of multiply hit sites, consistent with the much earlier results of Benzer (1961). Thus, there appears to be quantitative, nonrandom variation in exposure to the muta-gen, but not strong enough that large portions of the ge-nome completely avoid exposure.
Measuring the relevant mutation rate in double-strand genomes
Although it is easy to model an arbitrary mutation rate,
fitting the relevant empirical rate may be challenging. In a double-stranded genome, mutagenesis typically converts a base on one side of the duplex, not also its complement. If
Table 1 Effect of hydroxylamine treatment on T7
Exposure time (hr) Survivala Muts/genomeb C/T/genome
0 1.0 2.3 0.7
21 0.05, 0.05, 0.025 6.9 4.9
45 0.0005, 0.001, 0.0002 11.1 8.1
Methods. Virions of T7Hifrom Heineman and Bull (2007) were suspended in 0.1 M sodium phosphate buffer (pH 6.0) with 1 mM EDTA and 3.5 mM phenol red, incubated with or without hydroxylamine (HA) at 0.3M for the time indicated (Tessman 1968). At the end of exposure, HA-treated cultures were neutralized with acetone at 1.5% and NaOH at 0.1 M, the latter to maintain the pH near 7.0. DNA was extracted from all exposed virions regardless of viability and subjected to 454 pyrosequencing; reads were mapped with breseq (Barricket al.2009) and mutations enumerated on a per-read basis; bases were counted only if the quality score was at least 25. Our inference of thein vivomutation spectrum assumes that thein vitrosequencing method accurately mimics thein vivoconversion of lesions into base changes.
a
no subsequent replication occurs before the genome infects, virions will then carry different mutations on each strand. There are several ramifications of this heteroduplex asym-metry that depend on the viral life cycle, thefitness effect of the mutations, and on recombination. For tractability in everything that follows, we consider a single episode of mutation—progeny are not exposed to further mutagenesis. Consider first that all mutations have nofitness effect (are neutral): all infections are equally viable regardless of mutation content on either strand. Upon infection by a heteroduplex genome, and in the absence of DNA repair, semiconservative replication of the parent genome will distribute mutations on each strand to half the genomes destined for progeny, but now as homoduplexes. In T7 at least, recombination among the homoduplexes will create progeny genomes with a mix of mutations from the two parental strands; for convenience the mix may be assumed to obey linkage equilibrium, each mutation at a frequency of 0.5. If the mutation rate per parental strand isU, progeny carry an average total of 2Umutations in their double-strand genomes. With free recombination, indivi-dual progeny inherit half the total, an average ofU. The distri-bution (Poisson) will be the same as in single strands of the parent genomes. The same result would apply if there was no recombination during the process.
The situation changes when mutations have deleterious effects. Consider the extreme case that all mutations are lethal and furthermore that they are lethal regardless of strand. If the lethal rate per strand isUL, parent genomes are
now subject to a lethal rate of 2UL, twice the per-strand rate.
In the absence of other types of mutations, sequencing would observe a mutation rateUL, whereas the survival rate
would be observed to decline at 2UL, an apparent
impossi-bility under the standard Poisson model. As no real system experiences only lethal mutations, the ramifications of this process would merely be an overestimate of the fraction of
mutations that are lethal. Recombination makes no differ-ence in this case.
A less extreme case is one that applies to T7: all genes are transcribed from the same strand, and mutations on that strand will largely determine viability of the infection (Molineux 2005). Again assume that only lethal mutations occur, albeit a lethal mutation on the non-transcribed strand (NTS) does not manifest an effect until its complement is generated by replication using products made from the tran-scribed strand of the infecting genome. Lethals arise at rateUL
on each genomic strand, independently of the opposing strand. The transcribed strand escapes lethals with probability e2UL, which is thus the fraction of virions that produce viable prog-eny. Of interest, then is the fraction of progeny in those viable infections that inherit lethal mutations from the NTS.
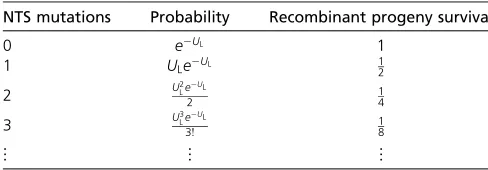
Within viable infections and with complete recombina-tion, the surviving progeny for different numbers of muta-tions on the NTS are enumerated in Table 2. The fraction of all progeny in viable infections escaping inheritance of lethals from the NTS sums as
e2UL
1þUL 2 þ
UL 2
2 1 2!þ⋯
¼ e2ULþUL=2 (5)
and is thus e2UL=2. A plot of surviving infectious particles (parent genomes producing at least some viable progeny) would be log-linear with slope2U, but the number of viable progeny from mutagenized parents would have slope
21.5U. As before, therefore, mutations arising indepen-dently on each strand will have a greater lethal effect than expected from the mutation rate observed using sequence methods (which is per strand).
Abolishing recombination among progeny genomes rai-ses fitness in this case. In the absence of recombination, minimally half the progeny of a viable infection are themselves viable because their genome is descended from the mutation-free transcribed strand of the parent; progeny survival follows e2U(1 +e2U)/2. Progeny survival without
recombination is invariably larger than with recombination, markedly so at high mutation rates. Without recombination, survival is approximately1
2e2
Uand would not necessarily be
empirically distinguishable frome2U.
Discussion
The genetic principle behind lethal mutagenesis is that a high mutation rate will drive the population to a muta-tion–selection balance in which fitness is depressed well below the starting value. A proposed theoretical framework holds that the equilibrium genetic load depends only on the genomic deleterious mutation rate (Kimura and Maruyama 1966)—a profound generality if true. The alternative out-comes of population survivalvs. extinction also depend on whether the intrinsic fecundity is high enough to offset the drop in geneticfitness (Bullet al.2007), but the focus here has been on the genetic impact of mutations.
Figure 3 A sliding window analysis of the number of C to T mutations in a T7Higenome treated with hydroxylamine 45 hr exhibits a modest
The underlying genetic foundation of lethal mutagenesis has been formally tested in one case. T7 was subjected to a genomic viable mutation rate of over four viable mutations per genome per generation; despite a predicted fitness decline of 60% on a log scale, a slightfitness increase was observed at 200 generations (Springman et al. 2010). A second example can also be interpreted in this framework. In Haydenet al.(2011), a ribozyme of 197 bases was sub-jected to a genomic rate of one mutation per generation. Across 10 generations of mutagenesis, fitness (measured as the ribozyme activity selected) declined to about two-thirds of the initial value by generation 4 but recovered to the initial value by the 10th. The model here predicts afi t-ness equilibrium ofe21= 0.37 times that of the initial value
if all mutations are deleterious. The molecular basis of the ribozymefitness recovery was not investigated, although the modal number of mutations per genome had increased by
2 at the 10th generation.
The work here has attempted to reconcile the basic model with the specifics of T7in vivomutagenesis; a second-ary goal was to consider the feasibility of more tractable empirical systems. This effort has supported the original in-terpretation of the T7 work and finds no suggestion that failure of the theory resides at a mismatch between methods and interpretation of results. Instead, it appears that the sustained moderately high mutation rate simply fails to cause a progressive fitness decline over the course of 200 generations. Thus, a mutation rate much higher than 4–6 is required to cause a majorfitness decline.
In light of the present results, we can identify three possible causes of the failure of T7 to match the predicted
fitness decline:
1. Adaptive evolution. Equations 1 do not admit beneficial mutations. Beneficial mutations have the effect of raising initialfitness after the fact, as if thefitness of the initial virus is higher than its measured value. The predicted equilibrium fitness under mutagenesis is scaled relative to the initialfitness, so neglecting the ultimate contribu-tion of beneficial mutations that would have effectively boosted initial fitness will predict an equilibriumfitness too low. In the T7 study, there was direct evidence of beneficial mutations ascending during the period of evo-lution but no unambiguous way to determine how much
fitness benefit they contributed.
2. Recombination with negative epistasis. The Kimura– Maruyama model underlying Equations 1 assumes an
absence of recombination; it makes no assumption about epistasis because epistasis is irrelevant in the absence of recombination. The protocol used for T7 allowed recombi-nation. If mutations interact so that the deleterious effects attributed to mutations are worse in combination with other deleterious mutations than alone (negative epistasis), recombination can reduce the mutation load, profoundly so in extreme cases (Kimura and Maruyama 1966). Thus, if the mutations arising in T7 tend to have negative epistasis, recombination in T7 may account for a substantially higher equilibriumfitness than predicted bye2U. The average
lev-els of epistasis observed in studies of mutation interaction in microbes have typically not supported the negative model (e.g., Jasnoset al.2008; Lali and Elena 2012), but those studies have been limited to interactions among few mutations, not necessarily shedding light on interaction terms for large numbers of mutations in the T7 populations. 3. Overestimated deleterious mutation rate. The genomic viable mutation rate was estimated directly for T7 as 4.3 per generation in the mutagenic environment Spring-manet al.(2010). However, the fraction of those muta-tions that were deleterious was taken at 0.6 based on estimates of other viruses, all viruses with smaller genomes than T7 (40 kb for T7vs. 11, 5.4, and 4.2 kb for the others). In T7, that fraction may be,0.6. Pre-dicted fitness declines approximately linearly with the deleterious mutation rate (from 21.8 withU= 0 to 8.6 withU= 2.6), so even a halving ofUwould still result in a profoundfitness drop. Thus, this violation of the model is, by itself, not likely to account for a qualitative change in the outcome.
The study of Haydenet al.(2011) admits thefirst and last of these explanations as well, although it is ambiguous whether recombination could have existed in the amplifi ca-tion step as well.
The T7 study remains enigmatic, but two avenues of further exploration seem worthy of attention. First and as noted above, our model accommodates beneficial mutations somewhat restrictively, yet beneficial mutations are known to have evolved. Other work has also begun to incorporate beneficial mutations into models of evolution at high mutation rate (Gerrishet al.2013). A particularly attractive result from their study that provides conditions sufficient for population decline is
2Ud.s2; (6) whereUis the total genomic mutation rate,dis the average effect of a mutation (combining beneficial and deleterious mutations), ands2is the variance infitness. Althoughdand s2both change during evolution, the latter will be near 0 for
a clonal population (as true of the wild-type T7 at the start of mutagenesis). For the three viruses with measures of the distribution offitness effects, the average effect is con-sistently and strongly negative (e.g., on the order of 0.3; Sanjuán et al. 2004; Domingo-Calap et al. 2009). If those
Table 2 Progeny surviving lethal mutations from the NTS
NTS mutations Probability Recombinant progeny survival
0 e2UL 1
1 ULe2UL 12
2 U2Le2
UL
2 14
3 U3Le2UL
3! 18
numbers apply to T7, this model also predicts a rapidfitness decline in T7 over thefirst few generations of mutagenesis (as does our model), although a long-term increase is cer-tainly compatible with this model. More generally, Gerrish et al.(2013) point the way toward a more realistic under-standing of the practicality of lethal mutagenesis.
The distribution of deleterious deleteriousfitness effects in T7 is an additional focus for work attempting to resolve the empirical enigmas. Fitness effect sizes in T7, with a genome of 40 kb, need not reflect those of the small genome viruses for whichfitness effects have been measured directly (Sanjuánet al. 2004; Domingo-Calap et al. 2009). Indeed, deleterious effect sizes in some essential bacterial genes have proved remarkably small (Lindet al.2010). Small average effect sizes could explain whyfitness is slow to decline upon onset of mutagenesis.
Despite the unsolved high fitness in two studies of adapted genomes exposed to a measured level of mutagen-esis, the collective quantitative work on lethal mutagenesis suggests a practical approach to extinction. When the deleterious effects of mutation from a single generation of mutagenesis (as given by Equation 2 fork = 1) are severe enough by themselves to enact population decline, the lethal mutagenesis threshold may be considered to satisfy astrong criterion—population size will begin declining immediately. Alternatively, when the deleterious effects of mutation from a single generation of mutagenesis are not severe enough to prevent population expansion but the long-term effects (as given by Equation 1a) do ensure population decline, the threshold may be considered to satisfy a weak criterion. When only the weak criterion is satisfied, the population may expand hundreds of generations before the deleterious load is expected to halt growth (Bull and Wilke 2008). Thus other evolutionary processes outside the model, especially be-neficial mutations, may intervene in time to avoid extinction.
When lethal mutagenesis succeeds, the mechanisms contributing to population decline may encompass more than base changes. Attributing fitness decline to just the ob-served base mutation rate may often be a mistake. Nonetheless, immediate population decline should be a robust indicator of successful lethal mutagenesis by whatever mechanisms, except when extreme forms of resistance to mutagen can arise with single mutations.
A type of “automatic”lethal mutagenesis has been pro-posed for asexual populations evolving toward an optimum: ever-greater mutation rates are selected because mutator alleles disproportionately generate the favored mutants and thus hitchhike to fixation. The genetic load increases much more slowly than does the benefit but eventually drives the population extinct (Gerrishet al.2007; Sniegow-ski and Gerrish 2010). Experimental evidence with mutator strains supports the process (Gentileet al.2011). Although this form of lethal mutagenesis is distinct from one in which the high mutation rate is imposed, it does rely on a slow buildup of the genetic load—which may underlie the ob-served failure in T7. The genetics of the bacterial case may thus provide a useful comparison for viral work.
Acknowledgments
We thank I. Wang and S. Abedon for strains of non-T7 phages used in our (unsuccessful) attempts to estimate multiple kill curve parameters. L. Wahl identified an initial mistake in our (A1) and worked with us to confirm le-gitimacy of text Equation 2; we thank her, Phil Gerrish, and Paul Sniegowski for comments that improved the manu-script. This work was funded by National Institutes of Health grant GM 57756 (J.J.B) and GM 76040 (P.J.). J.J.B. receives support from the Miescher Regents Professorship at the University of Texas.
Literature Cited
Anderson, J. P., R. Daifuku, and L. A. Loeb, 2004 Viral error catastrophe by mutagenic nucleosides. Annu. Rev. Microbiol. 58: 183–205.
Barrick, J. E., D. S. Yu, S. H. Yoon, H. Jeong, T. K. Oh et al., 2009 Genome evolution and adaptation in a long-term exper-iment withEscherichia coli. Nature 461(7268): 1243–1247. Benzer, S., 1961 On the topography of the geneticfine structure.
Proc. Natl. Acad. Sci. USA 47(3): 403–415.
Bloom, J. D., J. J. Silberg, C. O. Wilke, D. A. Drummond, C. Adami
et al., 2005 Thermodynamic prediction of protein neutrality. Proc. Natl. Acad. Sci. USA 102(3): 606–611.
Bloom, J. D., S. T. Labthavikul, C. R. Otey, and F. H. Arnold, 2006 Protein stability promotes evolvability. Proc. Natl. Acad. Sci. USA 103(15): 5869–5874.
Bloom, J. D., F. H. Arnold, and C. O. Wilke, 2007 Breaking pro-teins with mutations: threads and thresholds in evolution. Mol. Syst. Biol. 3: 1744–4292.
Botstein, D., and D. Shortle, 1985 Strategies and applications of in vitro mutagenesis. Science 229(4719): 1193–1201.
Bull, J. J., and C. O. Wilke, 2008 Lethal mutagenesis of bacteria. Genetics 180: 1061–1070.
Bull, J. J., R. Sanjuan, and C. O. Wilke, 2007 Theory of lethal mutagenesis for viruses. J. Virol. 81(6): 2930–2939.
Chung, D. H., Y. Sun, W. B. Parker, J. B. Arterburn, A. Bartolucci
et al., 2007 Ribavirin reveals a lethal threshold of allowable mutation frequency for Hantaan virus. J. Virol. 81(21): 11722– 11729.
Crotty, S., C. E. Cameron, and R. Andino, 2001 RNA virus error catastrophe: direct molecular test by using ribavirin. Proc. Natl. Acad. Sci. USA 98: 6895–6900.
Domingo-Calap, P., J. M. Cuevas, and R. Sanjuan, 2009 Thefi t-ness effects of random mutations in single-stranded RNA and DNA bacteriophages. PLoS Genet. 5(11): e1000742.
Earnshaw, W. C., and S. R. Casjens, 1980 DNA packaging by the double-stranded DNA bacteriophages. Cell 21(2): 319–331. Eigen, M., 1971 Selforganization of matter and the evolution of
biological macromolecules. Naturwissenschaften 58: 456–523. Eigen, M., and P. Schuster, 1977 The hypercycle, a principle of
natural self-organization. A. Emergence of the hypercycle. Na-turwissenschaften 64: 541–565.
Eigen, M., J. McCaskill, and P. Schuster, 1988 Molecular quasi-species. J. Phys. Chem. 92: 6881–6891.
Gentile, C. F., S.-C. Yu, S. A. Serrano, P. J. Gerrish, and P. D.
Sniegowski, 2011 Competition between high- and
higher-mutating strains ofEscherichia coli. Biol. Lett. 7(3): 422–424. Gerrish, P. J., A. Colato, A. S. Perelson, and P. D. Sniegowski,
Gerrish, P. J., A. Colato, and P. D. Sniegowski, 2013 Genomic mutation rates that neutralize adaptive evolution and natural selection. J. R. Soc. Interface 10(85): 20130329.
Graci, J. D., and C. E. Cameron, 2002 Quasispecies, error catastrophe, and the antiviral activity of ribavirin. Virology 298(2): 175–180. Hayden, E. J., E. Ferrada, and A. Wagner, 2011 Cryptic genetic
variation promotes rapid evolutionary adaptation in an RNA enzyme. Nature 474(7349): 92–95.
Heineman, R. H., and J. J. Bull, 2007 Testing optimality with experimental evolution: lysis time in a bacteriophage. Evolution 61: 1695–1709.
Jasnos, L., K. Tomala, D. Paczesniak, and R. Korona,
2008 Interactions between stressful environment and gene de-letions alleviate the expected average loss of fitness in yeast. Genetics 178: 2105–2111.
Johnson, T., 1999 The approach to mutation-selection balance in an infinite asexual population, and the evolution of mutation rates. Proc. Biol. Sci. 266(1436): 2389–2397.
Kimura, M., and T. Maruyama, 1966 The mutational load with
epistatic gene interactions infitness. Genetics 54: 1337–1351. Lali, J., and S. F. Elena, 2012 Magnitude and sign epistasis among
deleterious mutations in a positive-sense plant RNA virus. He-redity 109(2): 71–77.
Lind, P. A., O. G. Berg, and D. I. Andersson, 2010 Mutational robust-ness of ribosomal protein genes. Science 330(6005): 825–827. Martin, V., A. Grande-Perez, and E. Domingo, 2008 No evidence of
selection for mutational robustness during lethal mutagenesis of lymphocytic choriomeningitis virus. Virology 378(1): 185–192. Molineux, I., 2005 The T7 group, pp. 277–301 inThe
Bacterioph-ages, edited by R. Calendar. Oxford University Press, Oxford.
Rauko, P., L. Novotn, and E. Balzov, 1993 DNA breakage and
inactivation resulting from hydroxylamine and/or cis-diammi-nedichloroplatinum(II) interactions with plasmid DNA. Int. J. Biochem. 25(10): 1475–1481.
Rhaese, H. J., and E. Freese, 1968 Chemical analysis of DNA
alterations. I. Base liberation and backbone breakage of DNA
and oligodeoxyadenylic acid induced by hydrogen peroxide and hydroxylamine. Biochim. Biophys. Acta 155(2): 476–490. Robins, W. P., S. M. Faruque, and J. J. Mekalanos, 2013 Coupling
mutagenesis and parallel deep sequencing to probe essential residues in a genome or gene. Proc. Natl. Acad. Sci. USA 110 (9): E848–E857.
Sanjuán, R., A. Moya, and S. F. Elena, 2004 The distribution of
fitness effects caused by single-nucleotide substitutions in an RNA virus. Proc. Natl. Acad. Sci. USA 101: 8396–8401. Sniegowski, P. D., and P. J. Gerrish, 2010 Beneficial mutations
and the dynamics of adaptation in asexual populations. Philos. Trans. R. Soc. Lond. B Biol. Sci. 365(1544): 1255–1263. Springman, R., T. Keller, I. J. Molineux, and J. J. Bull,
2010 Evolution at a high imposed mutation rate: adaptation obscures the load in phage T7. Genetics 184: 221–232. Taylor, A. T., S. B. Crist, and O. W. Jones, 1970 Alteration of
native DNA transcription by the mutagen hydroxylamine. Can-cer Res. 30(1): 95–99.
Tessman, I., 1968 Mutagenic treatment of double- and single-stranded DNA phages T4 ans S13 with hydroxylamine. Virology 35(2): 330–333.
Tessman, I., R. K. Poddar, and S. Kumar, 1964 Identification of the altered bases in mutated single-stranded DNA. I. Hydroxylamine, ethyl methanesulfonate and nitrous acid. J. Mol. Biol. 9: 352–363. Tessman, I., H. Ishiwa, and S. Kumar, 1965 Mutagenic effects of
hydroxylamine in vivo. Science 148(3669): 507–508.
Wiehe, T., 1997 Model dependency of error thresholds: the role offitness functions and contrasts between thefinite and infinite sites models. Genet. Res. 69(1): 127–136.
Wilke, C. O., and C. Adami, 2003 Evolution of mutational robust-ness. Mutat. Res. 522(1–2): 3–11.
Wilke, C. O., J. L. Wang, C. Ofria, R. E. Lenski, and C. Adami, 2001 Evolution of digital organisms at high mutation rates leads to survival of theflattest. Nature 412(6844): 331–333.
Communicating editor: C. H. Langley
Appendix: Mean Fitness per Generation Under Mutagenic Exposure
We consider the fitness of a genotype G in generation k + 1 based on its mutational and selective history through the previous generations. LetP(Mj) represent the Poisson probability of the set ofMmutations that were acquired by genotypeG
in generationj:mj,1mutations acquired in class 1 at rateU1,mj,2in class 2 at rateU2, and so on forj= 1 thoughk. Mean fitness in generationjisWj. Thefitness of a genotypeGin generationk+ 1 is
W
Gkþ1¼
P
ð
M
1Þ
ð12s1Þ
m1;1
...ð12snÞ m1;n
W0
3
P
ð
M
2Þ
ð12s1Þm1;1þm2;1...ð
12snÞm1;nþm2;n
W1
⋮
3
P
ð
M
kþ1Þ
ð12s1Þm1;1þ...mkþ1;1...ð12snÞm1;nþ...mkþ1;nWk
;
(A.1)
whereW0[1.
Summing over themj,ifor all genotypes,
Wkþ1¼E 0
@Qni¼1ð12siÞ
Pkþ1
j¼1mj;iðk2jþ2Þ Qk
j¼0Wj
1
Solving forW1 andW2 directly, it becomes clear that several terms cancel. As one proceeds to otherWlwe hypothesize
Wl¼E
Yn
i¼1
ð12siÞlm1;i
!
: (A.3)
It follows directly from (A.2) that (A.3) is true whenl= 1. By induction we assume that (A.3) is true for alll#kand then we will show that (A.3) is true forl=k+ 1. We begin by separating thej= 1 term in (A.2) to get
Wkþ1¼
E
Qn
i¼1ð12siÞ
Pkþ1
j¼2mj;iðk2jþ2Þ
Qk j¼0Wj
E Y
n
i¼1
ð12siÞðkþ1Þm1;i
!
: (A.4)
We now show that the numerator and denominator in thefirst term in (A.4) cancels. To show this we start by changing the index by lettingl=k2j+ 2 and use the fact that all of the Poison random variables are independent to get
Wkþ1¼ Qn
i¼1 Qk
l¼1Eð12siÞlmk2lþ2;i
Qk j¼0Wj
E Y
n
i¼1
ð12siÞðkþ1Þm1;i
! :
Note thatm1,ihas the same distribution asmk2l+2,iso we can rewrite the above as
W
kþ1¼
Q
ni¼1
Q
kl¼1Eð12siÞ
lmk2lþ2;i
Q
kj¼0Wj
E
Q
n i¼1ð
1
2
s
iÞ
ðkþ1Þm1;i¼
Q
ni¼1
Q
kl¼1Eð12siÞ
lm1;i
Q
kj¼0Wj
E
Q
n i¼1ð
1
2
s
iÞ
ðkþ1Þm1;i¼
Q
kl¼1E
ð
Q
ni¼1ð12siÞ
lm1;i
Þ
Q
kj¼0Wj
E
Q
n i¼1ð
1
2
s
iÞ
ðkþ1Þm1;i¼
E
Q
n i¼1ð
1
2
s
iÞ
ðkþ1Þm1;i:
(A.5)
The last line follows by the induction hypothesis.
For independent random variablesXi,
E Y
n
i¼1
rXi
i
!
¼Y
n
i¼1
GXiðriÞ
whereGX(r) is the probability generating function of the variableX. For a Poison random variableXwith rateU it is well
known that the probability generating function is given byGX(r) =e(r21)U. We can thus rewrite (A.3) as
Wkþ1¼ Yn
i¼1
Gm1;i h
ð12siÞðkþ1Þ
i
¼e
Pn i¼1ðð12siÞ
ðkþ1Þ2