ABSTRACT
GOODNIGHT, DANA JON. Impact of a large sphere into a bed of cohesionless particles. (Under the direction of David Genereux)
Impact and penetration of a large sphere into both dry and water-saturated granular beds of
smaller particles were studied using physical and numerical experiments. In both sets of
experiments the impacting sphere displays characteristic deceleration curves that may be used to
infer the geotechnical and sedimentological character of the granular bed. Quantitative comparison
of a subset of the physical experiments with numerical ones confirms the utility and potential of
the numerical simulation model for geotechnical studies of a variety of impact phenomena. In
particular, characteristics of the impact of a large object with the seafloor can be exploited to
remotely infer seafloor properties without the need for expensive and time-consuming sampling
and laboratory measurements. Penetration phenomena were studied in both dry, non-cohesive
sands, pebbles and plastic spheres and also in water-saturated sediment beds composed of
bentonite clays, sands, pebbles, and plastic spheres. An accelerometer attached to the impacting
sphere or impactor is used to measure a time series of acceleration during freefall, impact, and
cessation of motion. The maximum deceleration and the period of damped oscillation of the
impactor are excellent quantitative descriptors of the impact process. A 121-g impactor dropped
from 400 mm into dry granular particles in a 100-mm-diameter container experiences maximum
decelerations ranging up to 29 times the nominal gravitational acceleration on Earth, g, of 9.8 m s-2.
For bed particles of a given material, the maximum deceleration generally increases with bed
particle diameter and with decreasing container diameter. Maximum deceleration in
saturated particles is generally less than in dry particles, as expected, although impact into a
water-saturated mixture of coarse and fine sand generated greater maximum deceleration values than
using a discrete-particle computer model were used for detailed intercomparison and interpretation
of physical experiments. The discrete-particle model solves the equations of motion for the
impactor and each bed particle in a granular assemblage for impacts into a bed of identical
6-mm-diameter cellulose acetate spheres having known material properties and closely matching
assumptions used in the simulations. Excellent quantitative agreement between maximum
decelerations measured in the simulations and physical experiments demonstrates the considerable
potential for use of simulations to study impacts under conditions that are not easily amenable to
physical experiments, for example, on planets or moons having gravitational accelerations different
from Earth’s. Differences between physical experiments and simulations can be attributed to
uncertainties in the initial conditions used in the numerical simulations, slight differences in the
design of the physical apparatus and the simulation impact sphere, the physical properties of the
containers used to hold the sediment bed, and, in the case of the water-saturated beds, incomplete
IMPACT OF A LARGE SPHERE INTO A BED OF COHESIONLESS PARTICLES
By
Dana Jon Goodnight
A thesis submitted to the Graduate Faculty of North Carolina State University
in partial fulfillment of the requirements for the Degree of
Master of Science
Department of Marine Earth and Atmospheric Sciences
Raleigh
2003
Approved By:
_______________________ ________________________ David Genereux Elana Leithold
Chair of Advisory Committee
B
IOGRAPHY
Dana Jon Goodnight was born on October 27, 1967, in Concord, North Carolina to
Dwight and Judy Goodnight. Dana’s interests have been broad and varied since his high school
years. As a junior in high school at A.L. Brown High School, Dana was selected to participate in
the Governor’s School program of North Carolina in the area of mathematics. Upon graduating
from high school in 1986, Dana entered the University of North Carolina at Chapel Hill where he
obtained a bachelor’s degree in Physical Education.
After marrying his wife Carol in 1991, he moved to southern California to study theology
at Westminster Theological Seminary in California, where in 1994 he received a Master of Arts in
Religion. While in California, he also began exploring the fields of curriculum design and
curriculum implementation for middle school and high school science education. Upon
reestablishing residency in North Carolina, Dana began teaching math and science at the middle
school level.
As a middle school science teacher, Dana was involved in the development of programs to
use technology to enhance math and science instruction through both the Science House at North
Carolina State University as well as a “hands on” approach to teaching Earth Science through the
Center for Mathematics and Science Education at UNC Chapel Hill. As part of a Science House
endeavor, Dana contributed to the development of a published teacher’s manual and guide for
using calculator-based and computer-based technology to enhance science instruction in North
Carolina middle and secondary schools.
In 1997 Dana once again returned to school to pursue a degree in geology at North
Carolina State University in Raleigh, North Carolina. After a brief amount of time as an
that he began his geological studies at NCSU, he began working part-time at the North Carolina
Department of Transportation Geotechnical Unit as an engineering assistant. Later he was
promoted to a temporary geologist position where he was responsible for subsurface investigations
for proposed bridge structures and roadways, slope stability analyses for cut slopes and
embankments, and groundwater monitoring of a number of state properties designated as
wetlands.
After completing most of the course-work requirements for the Master of Science degree,
Dana began working full-time as Project Geologist for Trigon Engineering Consultants, Inc. in
Raleigh, North Carolina. During his time at Trigon, Dana obtained his Professional Geologist
license to practice geology in the state of North Carolina. Dana has been involved in project
management and supervision of geological and geotechnical investigations related to a number of
major projects all around the state of North Carolina. Presently, Dana is involved in the field
operations of a long-term project at the Oregon Inlet of the Outer Banks that involves the
foundation investigation for what is projected to be one of the longest bridges on the eastern coast
ACKNOWLEDGMENTS
I would like to thank my committee members, Dr. Dave Genereux, Dr. Elana Leithold,
and Dr. Michael Kimberley, for their efforts to review and assist in the improvement of this study.
In addition to those who are members of the Marine, Earth and Atmospheric Sciences faculty who
have served as committee members, I am particularly indebted to two other individuals who were
part of the NCSU research community when the study was commenced, but have since that time
assumed responsibilities outside of NCSU. Dr. Joseph Calantoni at the Naval Research
Laboratory at the Stennis Space Center in Mississippi played a vital role in the actual
implementation of the numerical modeling portion of this study. His time and efforts made the
overall project possible. Dr. Thomas Drake, the initial developer of the numerical modeling code
used in this study, has been committed to bringing about the completion of this project even after
taking on the very large responsibilities of program manager for the Coastal Geosciences program
at the Office of Naval Research in Arlington, Virginia. His willingness to travel and stay involved
in the directing of this work has enabled the completion of this project. I am very grateful for his
assistance.
I want to thank my family, and in particular my wife, Carol, for her patience and
encouragement throughout the time of my graduate studies. Her love and support helped me to
complete the work. My three boys, Caleb, Kenan, and Micah, deserve to be recognized as well for
their endurance of and enthusiasm for the many garage and in-house experiments.
Finally, I want to give thanks to Jesus Christ, who has given me life and the opportunity to
study His creation through the sciences. He is the ultimate reason for the successful completion
TABLE OF CONTENTS
LIST OF FIGURES ...vi
1. INTRODUCTION...1
2. PHYSICAL EXPERIMENTS...4
2.1 Apparatus and Methods ...4
2.2 Sediment Beds...5
2.2.1 Bentonite Clay ...5
2.2.2 Natural Granular Sediments...6
2.2.3 Plastic Spheres...6
2.3 Data Collection ...7
2.4 Experimental Data Collection Procedure...8
2.5 Impacts into Dry Beds ...9
2.5.1 Non-Granular Target Materials... 12
2.5.2 Natural Granular Targets... 14
2.5.3 Cellulose Acetate Spheres... 17
2.6 Impacts into Water-Saturated Beds... 20
2.6.1 Natural Granular Target Materials (In Water) ... 20
2.6.2 Cellulose Acetate Spheres (In Water) ... 21
2.7 Deceleration Phenomena – Discussion ... 22
2.8 Video Observations of the Physical Experiments... 28
3. NUMERICAL EXPERIMENTS ... 29
3.1 Discrete-Particle Model... 29
3.2 Simulation Parameters ... 30
3.2.1 Container ... 30
3.2.2 Target Spheres ... 31
3.2.3 Impactor Sphere... 31
3.3 Impact Deceleration Curves for Numerical Experiments... 32
3.4 Visualization of Numerical Simulations... 33
4. INTERCOMPARISON OF EXPERIMENTAL RESULTS ... 34
5. CONCLUSIONS... 36
6. LITERATURE CITED ... 41
7. APPENDICES... 62
Appendix A. Experiment Catalog (Number of Trials and Conditions) ... 62
Appendix B. Material Properties of Cellulose Acetate Spheres... 64
Appendix C. Force Experiment Description ... 65
Appendix D. Impact Signatures for Various Target Materials... 67
Appendix E. Experimental Data Summary... 102
Appendix F. Detailed Description of CBLTM System Setup ... 130
LIST OF FIGURES
Number Page
1. The XBP Device 43
2. Physical Experiment Apparatus Schematic 44
3. Physical Experiment Apparatus and Electronics Setup 45
4. Aluminum Shaft With Impactor Sphere and Shaft Guide 46
5. Cellulose Acetate Plastic Spheres 47
6. CBLTM Device, TI-83 Graphing Calculator, and Accelerometer 48
7. Schematic Diagram of Force Experiment Apparatus 49
8. Typical Deceleration Curve for Uniform Plastic Spheres 50
9. Bentonite Deceleration Curves 51
10. Curves for Coarse Sand (Large and Small Impact spheres) 52
11. Combined Deceleration Curves for 400 mm Drop Heights (Air) 53
12. Effect of Container Size (Force Versus Time) 54
13. Impact in Dry and Water-Saturated Natural Sands 55
14. Impact in Dry and Water-Saturated Plastic Spheres 56
15. Combined Deceleration Curves for 150 mm Drop Heights (Water) 57
17. Typical Simulated Deceleration Curve 59
18. Visualization of Numerical Simulations 60
1. Introduction
Sedimentological and geotechnical observation of the seabed are required for a variety of
engineering, scientific, and defense applications. New methods to rapidly and remotely sample the
seafloor and the sediment directly beneath it include, in addition to a variety of acoustic
techniques, an expendable bottom probe (XBP) developed for deployment from a moving ship or
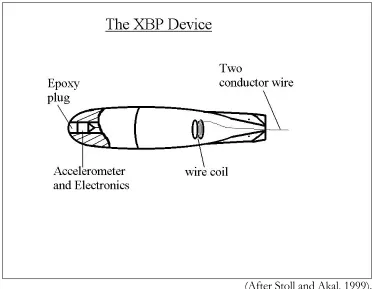
a variety of underwater vehicles (Figure 1) [Stoll and Akal, 1999; Bittner and Flood, 1999]. The
XBP falls through the water column, impacts and (usually) penetrates the seafloor, and decelerates
to a halt. One or more accelerometers measure deceleration during the penetration process, and
characteristics of the resulting deceleration curves are correlated to sediment grain size and various
measures of sediment strength [Stoll and Akal, 1999; Stoll et al. 1994]. Expendable probes address
several difficulties that presently hinder understanding of seafloor properties. Estimates of seabed
engineering properties obtained from grab samples and cores typically have large uncertainties due
to sparse sampling, which may not capture the intrinsic spatial heterogeneity of the seabed,
disturbances during sampling, and biological effects not accounted for in physical models, among
other reasons. Unlike rapid acoustic measurement of seafloor morphology, the time and expense
required to sample and perform laboratory analysis of seabed properties are often prohibitive.
Lack of physical understanding and extant models that can predict seafloor properties given
acoustic or physical measurements severely constrains present abilities to predict the penetration of
objects falling to the seafloor. Extensive, ongoing acoustic research in seafloor properties, a
long-term goal, will require extensive ground-truthing with physical measurement; such devices as the
XBP offer considerable promise for both assisting acousticians in these long-term efforts and
Enhanced understanding of fundamental impact and penetration phenomena will increase
the demonstrated efficacy of the XBP to remotely sample seafloor properties and will help to
address a number of related scientific and engineering applications. Impact phenomena span a
tremendous range of time and length scales, and also depend strongly on material properties of
impactor and substrate. The demise of a diverse assemblage of extinct life forms has been
ascribed to the impact of a 10-km-diameter extraterrestrial body into the Earth [Alvarez, 1980]; at
the opposite end of the length-scale spectrum, sand-sized micrometeorites actively “garden” the
surface of the Moon [Jenson and Haff, 1982] and other celestial bodies, effectively erasing
evidence of earlier impacts. Fundamental understanding of impact phenomena and our ability to
quantitatively predict them, especially impacts in such discrete materials as sand, is in a relatively
primitive state.
This study is the first to use discrete-particle numerical-simulation methods [e.g., Drake
and Calantoni, 2001] to explore details of impact and penetration phenomena on a grain-by-grain
basis at high temporal resolution. Exploratory physical experiments measure the deceleration of a
large, instrumented, rigid sphere impacting a variety of natural and artificial sediment beds. The
goals of this reconnaissance study are to test theories for seabed penetration in cohesionless
granular materials with a series of carefully controlled physical experiments, and to verify the
potentialities of numerical experiments for further study of seabed impact processes by
comparison of computer simulations with measurements from the physical experiments.
Several inexpensive penetrometers were designed and interfaced with signal processing
instrumentation in order to measure high temporal resolution time series of impactor acceleration.
Exploratory experiments in which an uninstrumented steel sphere was dropped from various
After completion of preliminary investigations, physical experiments using newly designed
impact penetrometers were conducted using a broad range of target materials under various
conditions. (See Appendix A for a complete summary of physical experiments performed). A
selected subset of the physical measurements were chosen for comparison with discrete-particle
computer simulations. The discrete-particle simulation technique idealizes sediment grains as
frictional spheres having variable density, radius, frictional, and elastic properties. Successful
simulation of a variety of sedimentary processes including granular avalanches, bedload transport
in steady and oscillatory flows, and the angle of repose provides confidence that the simulations
capture the essential physics of granular motion in a broad range of sedimentologically relevant
situations. In particular, the numerical techniques are well suited to simulation of static and
shearing assemblages of cohesionless grains in which momentum transfer between grains is
dominated by forces generated by direct particle-to-particle contact. For grains having properties
corresponding to quartz, forces between particles having diameters greater than about 0.25 mm
typically fit assumptions implicit in the simulations. The reader is cautioned, however, that the
simulations in their present form do not correctly treat acoustic propagation of sound through a
granular material, although such simulations are certainly of interest and the subject of ongoing
research. Since a number of discrete-particle codes are available to the scientific community; the
details of the particle-interaction algorithms embedded in the simulations should be examined to
determine the suitability of such codes for the intended application.
Simulations provide both detailed quantitative information on the forces between grains
and the useful ability to visualize the impact and penetration process. Impact and penetration in
the physical experiments were documented using digital video recording, which allows comparison
experiments used a force sensor to examine the effects of the container diameter on penetration
resistance.
2. Physical Experiments
2.1 Apparatus and Methods
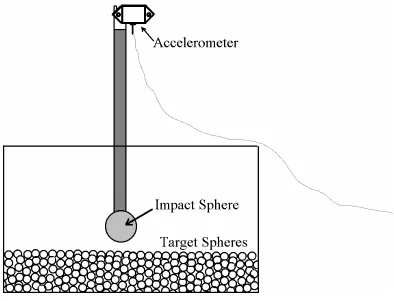
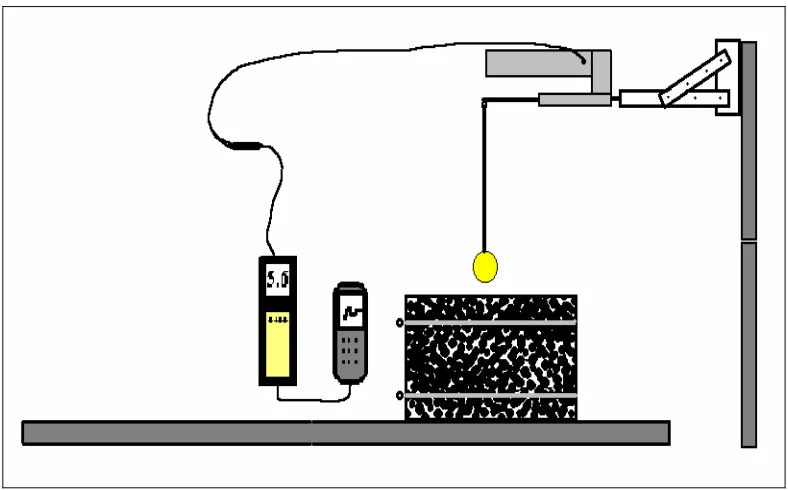
Impact and penetration experiments used a 24-mm-diameter, polished, solid steel sphere epoxied
to one end of an 8-mm-diameter, 830-mm-long hollow aluminum shaft (Figures 2 and 3). An
accelerometer was attached to the shaft at the end opposite the steel sphere; the total mass of the
apparatus, including the sphere, shaft, accelerometer, and accelerometer cable was approximately
121 grams. Some experiments used a 56-mm-diameter, solid phenolic resin sphere on an
860-mm-long shaft weighing 217 grams. Variation in the suspended length of the accelerometer cable
during the experiment introduces an uncertainty of about 1% in the mass of the impacting sphere
apparatus.
The impactor velocity at first contact with the granular bed was varied by changing the fall height
and allowing the impactor to freefall under gravity. In some experiments a mechanical guide
ensured that the shaft remained in a vertical position at impact and throughout the duration of the
penetration (Figure 4).
Typical initial impactor height above the granular bed was 400 mm for experiments in air
and 150 mm for experiments in water, although the guide apparatus allowed a continuous range of
heights between 0 and 770 mm. Assuming negligible drag for the experiments conducted in air,
the magnitude of the impact velocity v for tests conducted in air is v=(2gh)0.5, where g is the
magnitude of the acceleration due to gravity and h is the distance to the bed. A practical limitation
was imposed on the experiments by the accelerometer, which could measure a maximum
spheres in which the fall height was varied from 100 mm to 900 mm in 100 mm increments
established a rough upper limit of approximately 900 mm for the fall height.
The impactor penetration depth was obtained by comparing the position of the upper end
of the shaft against a fixed metric scale before and after the impact.
2.2 Sediment Beds
2.2.1 Bentonite Clay
A fine, bentonite clay and water mixture was tested as an example of a non-granular,
cohesive target material. The bentonite formed a colloidal suspension gel when mixed thoroughly
with water. By varying the amounts of water, the density of the mixture was changed to four
different values (1.05 g cm-3, 1.06 g cm-3, 1.07 g cm-3, and 1.10 g cm-3). This material cannot be
modeled using a discrete particle approach, but the deceleration curve obtained for this material
provided a representative data set that could be compared and contrasted with the curves derived
from impacts into non-cohesive sands, pebbles or the cellulose acetate spheres. The densities of
the bentonite mixtures were measured using a Fann Mud Balance Model 140 made by Fann
Instrument Company of Houston, Texas.
Several cylindrical containers having various diameters were used for the bentonite
experiments. The container diameter did not have any appreciable effect on the maximum
deceleration because of the nature of the penetration process in this soft, non-granular and
cohesive target material. However, penetration depth was affected by the mixture depth in the
container; in particular, an insufficient mixture depth allowed the impactor to contact the container
2.2.2 Natural Granular Sediments
A number of non-cohesive granular sediments that can be found in natural environments
were utilized in the physical experiments including poorly-graded coarse sand and fine gravel (grain
sizes ranging from 1 mm to 2 mm), well-graded fine-to-coarse sand (grain sizes ranging from 0.1
mm to 2 mm) and angular quartz pebbles (average maximum dimension of 10 mm). Note: The
term “graded” is used in the geotechnical engineering sense. It refers to how variable the grain
sizes are within a sample. Poorly-graded sands are basically unimodal, whereas, well-graded sands
have a broad range of grain sizes. The individual grains comprising these natural sediments were
predominantly quartz and had an approximate density of 2.65 g cm-3.
Granular target beds were tested under dry and submerged conditions in a number of
containers having different diameters made from sections of PVC pipe glued to smooth acrylic
plastic bases. Some experiments used other prefabricated plastic containers and a rectangular glass
aquarium 410 mm long by 260 mm wide by 210 mm deep. The granular material was remixed by
either repouring or by stirring after each experimental trial, and the horizontal upper surface of the
natural granular material was smoothed before proceeding with additional trials.
2.2.3 Plastic Spheres
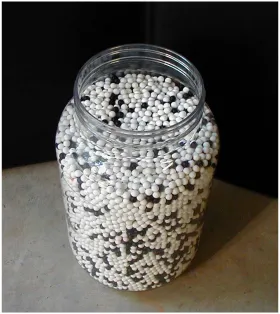
Cellulose acetate plastic spheres were used in a number of the laboratory experiments to
provide a target bed with well characterized geometry and material properties for comparison with
numerical experiments. The cellulose acetate spheres were smooth, black and white, highly
spherical and uniform in both size and density (Figure 5). The density of the spheres was 1.319 g
cm-3. Unimodal beds of both 4-mm- and 6-mm-diameter were used. A complete description of
A 100-mm-diameter container 300 mm deep was filled with the spheres to a height of
approximately 200 mm for each experiment. The number of target spheres held in the container
for each impact experiment was approximately 5,800. Additional experiments were performed in
150-mm-diameter and 300-mm-diameter containers. The maximum deceleration was independent
of bed depth for depths greater than about 200 mm; impacts into shallower beds exhibited
markedly increased maximum decelerations, indicating significant influence of the container
bottom. Care was taken to ensure that the impactor descended directly into the center of the
container.
The bulk density of the spheres was homogenized after each test using one or more of
several methods. For many tests, the target spheres were emptied from the container after each
experiment and poured back into the container at a fixed rate through a funnel held at a fixed
height. After numerous trials and a comparison of the results, it was determined that the most
effective and consistent means of mixing the spheres was to manually stir the bed with a rod. The
upper surface of the target bed was smoothed by hand prior to each experiment, and the container
was not allowed to be moved or tapped since either of these mechanisms could cause bed
densification. Although the bed surface was always horizontal in the experiments, thus
representing a nominally flat seafloor, a series of impacts on a tilted bed would also be relevant to
rippled seafloor topography. The details of the impact processes in the present experiments were
not sensitive to minor perturbations of the nominally flat bed.
2.3 Data Collection
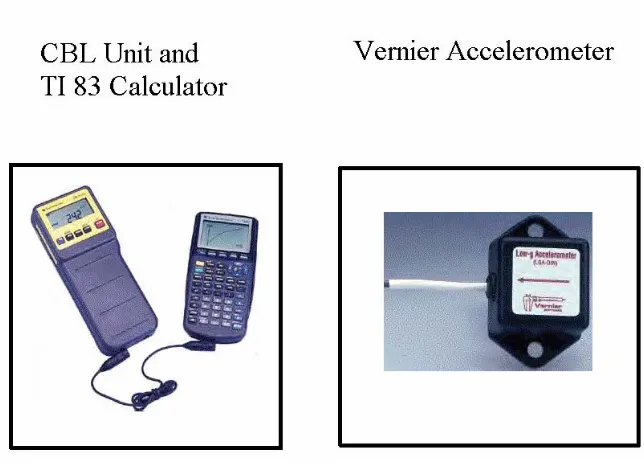
The electronic data collecting devices used in the physical experiments consisted of a
Graphing Calculator, appropriate software for collecting acceleration data, and a Vernier 25-g
accelerometer (Figure 6).
A DIN adapter connected the accelerometer sensor cable to the CBLTM channel port. A
Vernier Software, Inc. software program loaded into the TI-83 graphing calculator was used to
capture the deceleration data at specified time steps. The CBLTM unit was connected to the
calculator via its I/O port and a 2.42-m-long flexible cable was used to connect the accelerometer
sensor to the CBLTM. Other programs were utilized for data transfer from calculator to computer
and for data analysis and presentation. The same electronic setup was used to perform a series of
force experiments using a Vernier Force Sensor in place of the accelerometer. Figure 7 is a
schematic diagram of the force experimental setup and Appendix C provides a description of the
force experiments and discussion of the results.
2.4 Experimental Data Collection Procedure
A series of steps to set up the data collecting parameters on the TI-83 calculator was
required prior to each experimental test run. Once the experimental parameters including the time
step interval and the length of the experiment were specified, the apparatus was ready to initiate a
deceleration test. Data collection by the CBLTM unit and calculator commenced when the
ENTER key on the calculator was pressed (or when the specified threshold deceleration value
was exceeded in those tests which utilized the “triggering” function of the CBLTM setup). Before
pressing the ENTER key, the shaft was manually lifted to the selected drop height. The
ENTER key was then pressed, beginning the time step sequence. Immediately after pressing the
At the end of each experiment, the acceleration data was plotted and analyzed. A
preliminary analysis was conducted by viewing a plot of the time series on the graphics window of
the TI-83 calculator to ensure that the experimental trial had executed properly. After transferring
the data to a personal computer, more detailed observations and analyses of the deceleration
curves were made.
The following description and analysis of the impact and penetration process involving
various target materials is a synthesis of observations based on the experimentally determined
deceleration time series. Several phases of the impact and penetration process can be qualitatively
identified in each of the tests, and are presented in detail below.
2.5 Impacts into Dry Beds
A seriesof graphs of the deceleration time series covering the extensive experimental
parameter space consistently reveal characteristic signatures that can be related to such parameters
as the grain size of the target bed, among others. Non-granular cohesive clays were also tested for
comparison purposes. The coordinate system and conventions used to describe the impactor
deceleration are as follows: the positive z axis extends downward parallel to earth’s gravitational
field. The magnitude of the impactor deceleration, a, is measured in units of g=9.8 m s-2 (the
nominal magnitude of the acceleration due to gravity at the Earth’s surface). The portion of the
impactor deceleration curves where a<0 corresponds to slowing of the impactor due to grain/fluid
stresses generated as the impactor deforms the target bed. A quantity of particular interest is the
maximum deceleration amax which is the absolute minimum of a(t).
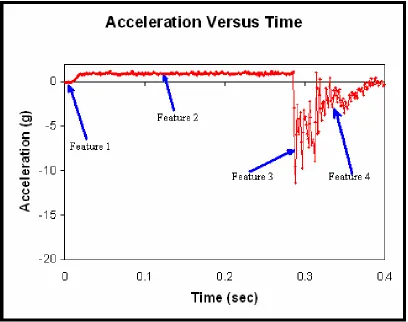
Four characteristic features are exhibited in a typical deceleration curve (Figure 8); these
1. A period of time starting at t=0 with no deceleration (a=0g); lack of such a period indicates that the triggering mechanism was used in the data collection scheme. Use of the triggering
option eliminates unnecessary data sampling prior to the release of the impactor, followed
by
2. a period of acceleration (a>0) to a near constant value of about 1 g as the impactor falls freely
in air, or, for experiments in water, between 0.9g and 0.5g. As soon as the impactor
contacts the target bed, there follows
3. a period of rapid and monotonically increasing deceleration (a<0) to a peak value denoted
amax; followed by
4. a period of decreasing deceleration, usually in conjunction with observable damped
oscillation in a as the impactor comes to rest, at which time a approaches zero.
The time increment between acceleration observations ranged from 0.01 to 0.00023 s.
Feature 1. The deceleration curve observed subsequent to each experiment was
approximately constant at 0 gexcept for signal noise until the impactor was released. Fluctuations
around the nominal zero mean were measured to be ± 0.143 g , within the range of 0.25-g
peak-to-peak fluctuations described in the sensor specifications [Vernier, 1997]. Minor changes in
temperature during the course of lengthy periods of experimentation caused the offset voltage to
drift, which necessitated frequent recalibration of the accelerometer to minimize this source of
error. When the triggering capability of the CBLTM system was utilized, a specified threshold value
had to be reached before the data sampling would begin. A specified percentage of data points
leading up to the moment at which the threshold value was reached was also selected. For
experiments triggered by crossing a threshold value, Feature 1 was entirely eliminated from the
using the triggering mechanism was a value that would be exceeded during the first moments of
impact, as the acceleration dropped below zero g.
Feature 2. At the moment the impactor was released, it and the attached aluminum shaft and accelerometer began to descend under the influence of gravity. This rapid increase in
acceleration from 0 g to 1 g occurs in approximately 0.01 to 0.02 s in air. The acceleration then
leveled off and remained constant at approximately 1 g (in air) as the apparatus continued its
descent under the influence of gravity until the nominal point of impact, at which time the
impactor had attained its maximum or impact velocity vmax. The precise time of impact is not well
defined, since fluid (either air or water) must be expelled from the rapidly decreasing space
between the impactor and target bed, thus reducing impactor velocity somewhat before its actual
contact with the bed.
When the impactor and target bed were immersed in water, a subtle difference was noted
for the deceleration curve. Like the experiments performed in air, the acceleration rapidly
approached 1 g once the impactor apparatus was released. However, after the impactor
acceleration reached 1 g, the acceleration gradually decreased to between 0.9 and 0.5 g before
impacting the target bed. This decrease in acceleration is due to fluid drag on the sphere and sides
of the shaft as it penetrated deeper into the water column. Most of the water experiments were
designed to allow the impact sphere to fall through a column of water that was 150 mm above the
upper surface of the target material. The approximate velocity of the descending apparatus for the
experiments conducted in a medium of water was around 1.3 m s-1 at the point of impact.
Feature 3. Acceleration of the impactor decreased dramatically at impact in all target materials, including the cohesive bentonite mud tests. Deceleration curves generated from impacts
compared to impacts into the non-cohesive natural sediments, as well as the cellulose acetate
spheres and hard surfaces. Differences in the curves will be developed further below.
Feature 4. After the deceleration reached a maximum, a period of approximately- sinusoidal damped oscillation was typically observed as the deceleration decreased to 0 g. In some
experiments only the peak deceleration value was recorded and the oscillations were not observed.
The damped oscillations are thought to be a post-penetration phenomenon caused by the elastic
response of the target material that is dissipated by frictional interactions between target material
grains. Under certain conditions the characteristics of the damped oscillations can be related to the
shear modulus (stiffness) of the target material [Stoll and Akal, 1999].
With the exception of Feature 1, each of these basic components was exhibited by most
of the deceleration curves for the different target materials tested. However, important differences
were also evident. In the following sections (sections 2.5.1 through 2.5.3), a more detailed
description of the deceleration results for the various target materials and experimental conditions
is discussed. Appendix D catalogs the majority of the deceleration curves obtained in the study.
The curves displayed are from trials conducted at a time step rate of at least 0.001 seconds.
2.5.1 Non-Granular Target Materials
Although the bentonite was a water-saturated rather than dry target material, the
experimental apparatus was allowed to freefall through air rather than water before impacting, so
the tests involving bentonite are described here. For the tests using bentonite suspensions, the
smaller impact sphere with a diameter of 24 mm was the sole impact apparatus utilized. The
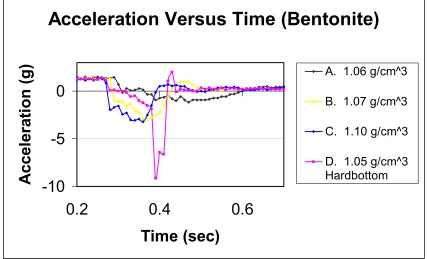
deceleration curves generated for the experiments using bentonite clay were all very similar
regardless of the density and container size (Figure 9). In all of the bentonite trials, the portion
shape compared to the curves for the granular materials. Superimposed on the gradual overall rise
and fall in deceleration are secondary oscillations, having a period of about 0.03 seconds. Both
the penetration depth and amax are largely independent of the container dimensions because of the
nature of the penetration process in this soft, non-granular and cohesive target material.
However, penetration depth was affected by the depth of the container. Experiments that were
conducted with a low-density bentonite mix required a deeper container to allow for the impact
and penetration process to operate unimpeded. When a shorter container was used, the
penetration of the impact sphere was stopped abruptly by the container bottom. In the
experimental trials where the penetrating sphere bottomed out, two distinct sections were evident
in the deceleration curve (Curve D of Figure 9). The deceleration record indicated that the
initial part of the curve was round and slowly increasing toward the maximum g value for the
bentonite. At the point of impact with the container bottom, the curve dropped rapidly to form
a sharp peak.
At the point of impact, the cohesive bentonite mixtures responded differently from both
the natural and synthetic granular materials. Because the bentonite was a cohesive fluid-like
material, individual particles were not expelled from the mixture. Impacts generated a subdued
splash similar to a stone falling into calm water, rather than the distinct ejection of individual
grains observed in the impacts into non-cohesive granular targets. During at least some of the
experimental trials, small amounts of the bentonite material were separated from its surface as
would be expected from a splash in fluid. However, because the material was so viscous, this
material separation was minimal. Circular and concentric series of wavefronts were produced
that moved out to the container edge and then rebounded. The bentonite material surface then
Bentonite mud having a density of 1.10 g cm-3 was the most viscous material tested, and
thus, the most resistant to penetration by the impact apparatus among the cohesive samples. The
mean amax was -3.2 g and mean penetration depth was approximately 160 mm. At this density,
the bentonite was viscous enough to maintain at least a partially open cavity behind the
penetrating sphere. After penetration ceased, the walls of the cavity eventually closed in around
the apparatus shaft and impact sphere when the container was subjected to vibration.
Bentonite mud with a density 1.07 g cm-3 had an average a
max of -3.1 g and bentonite with
a density 1.06 g cm-3 had an average a
max of -1.7 g. This was the lowest amax obtained in any of the
experiments conducted in which a drop height of 400 mm was used.
Bentonite with a density of 1.05 g cm-3 had insufficient strength or viscosity to keep the
impact apparatus from penetrating all the way to the bottom of the container when dropped
from 400 mm, so no amax was recorded.
2.5.2 Natural Granular Targets
A 24-mm-diameter and a 56-mm-diameter impactor sphere were used in experiments with
natural granular target beds. The mean amax was determined using a time increment between
acceleration observations of 0.00023 s, unless stated otherwise, to sufficiently resolve the rapid
acceleration fluctuations. Various container sizes were utilized with the sands and pebbles, and a
typical drop height of 400 mm was used for most of the tests, which provided an impact velocity
of approximately 2.8 m s-1.
Deceleration curves for impacts in dry natural, granular target materials are similar in
shape to those generated by impact into a water-saturated target. The impact signature
oscillations were evident near the peak deceleration, and after it, as the deceleration curve returned
to zero. The penetration process was very rapid, usually taking less than 0.04 s. Generally, after
reaching amax, curves dropped back to zero and then exhibited a minor amount of damped
oscillation before the impactor came to rest. The variability of amax for impacts in sands was
notably less than for other target beds. The large ratio of impactor to target particle size may
increase the number of contacts with the sand bed surface to a level such that the statistics of a
large number of interacting contacts dominates the impact process, unlike cases where the
impactor to target grain size ratio is of order 10 or less, in which case individual grain contacts
dominate the impact process. An alternative explanation for the decreased variability in amax may
be that significant variations in bulk density are much less likely to occur in fine-grained sand
mixtures compared to variations in bulk density that commonly occur in assemblages of identical
spheres.
Well-graded coarse-to-fine sand
Impacts of the 24-mm-diameter sphere with the bed of well-graded coarse-to-fine sand
generated a smooth, V-shaped deceleration curve having a mean amax of -13.4±1.0 g and mean
penetration of approximately 35 mm in the 150-mm-diameter container. The bulk density of the
bed of well-graded coarse-to-fine sand was approximately 1.45 g cm-3.
When the impact sphere made first contact with the sand surface, the deceleration rapidly
increased to a maximum within approximately 0.01 s. Approximately 0.035 s after the first contact,
the deceleration had already approached zero, indicating the end of the active phase of penetration.
The period of damped oscillation lasted for approximately 0.05 s, after which accelerations
The mean maximum deceleration for trials using the 56-mm-diameter impactor was
approximately -19 g. The major differences between the large and small impactor curves are the
larger value of amax observed for the larger impactor and the more rapid return to zero deceleration
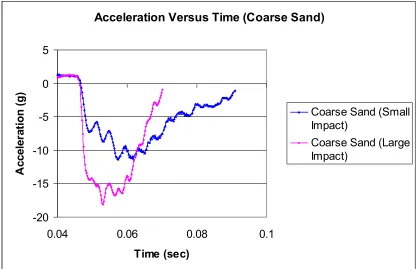
after reaching amax (Figure 10).
Poorly-graded coarse sand
Impacts of the 24-mm-diameter sphere with the bed of poorly-graded coarse sand
generated smooth, V-shaped deceleration curves that are very similar to impact curves for the
well-graded sand but with a slightly lower mean amax.of approximately -11±0.8 g. Impacts with the
56-mm-diameter sphere produced a mean amax of -18±1.0 g. The curves are independent of container
size. When the impact sphere made first contact with the sand surface, the deceleration increased
to amax within approximately 0.015 s, or slightly longer than for the well-graded sands. The average
penetration distance of 45 mm was slightly more than for the well-graded sands. Differences
between impact processes for the two sand mixtures may be the result of the packing and
arrangement of the particles, and possibly to the influence of humidity on the interparticle forces
between small grains. Although the poorly-graded coarse sand had a bulk density of 1.46 g cm-3 ,
similar to that of the well-graded coarse-to-fine sand (1.45 g cm-3), impacts into the coarse sand
exhibited a much greater tendency to be splashed outward from the impact crater. The reduction
in size of the granular splashes observed in the well-graded sand could be due to humidity-induced
cohesion at contacts between finer grains. This speculative hypothesis could be tested by
conducting additional physical experiments, or alternatively, by exploring effects of cohesion in the
context of numerical models.
Quartz pebbles
Impacts into a bed of angular, quartz pebbles generated curves having maximum
decelerations around -29±0.1 g, which exceeds the specified recommended range of the
accelerometer. Impactor penetration was approximately 20 mm in the 150-mm-diameter container.
Impacts into angular quartz pebbles generated both the largest decelerations and shortest
deceleration curves. From first contact with the pebble surface, deceleration of the impactor
increased to amax in less than 0.005 s. Deceleration approached zero after approximately 0.02 s
after initial contact, indicating that penetration had ended; then a rebound phase produced an
acceleration a >0 of 3 to 4 g immediately after reaching the peak in amax(Figure 11). The duration
of damped oscillation was approximately 0.1 s. The bulk density of the bed of pebbles was
approximately 1.26 g cm-3. This value was much lower than the sands due to the large air-filled
voids in the interstitial space. Even though the bulk density was lower than for the sand mixtures,
the pebble-sized pieces of quartz were massive enough relative to the impactor that the impactor
was unable to effectively penetrate into the bed. Deceleration curves for impacts into the quartz
pebbles were most similar to the curves produced by impact into a flat, hard surface such as the
acrylic plastic container bottom.
2.5.3 Cellulose Acetate Spheres
Experiments to study impacts into a target bed of identical cellulose acetate were
undertaken to assess the potentialities of the discrete particle modeling technique. Beds comprised
of 4-mm- and 6-mm-diameter spheres were created in cylindrical plastic containers having
diameters of 100 mm, 150 mm, and 300 mm. Reported values for amax are from trials using a time
performed with the cellulose acetate spheres (and other target materials) along with the number of
trials performed under each set of conditions. A large number of impacts into 6-mm-diameter
spheres in the 100-mm-diameter container were studied to generate an adequate statistical
description of the impact process for comparison with numerical model results.
The mean amax for impacts where the 24-mm impactor was dropped from a height of 400
mm above the bed surface into dry cellulose acetate spheres was -12.5±2.1 g for trials using a
300-mm-diameter container, -12.4±2.6 g for trials using a 150-300-mm-diameter container, and -13.6±2.0 g
for trials using a 100-mm-diameter container. The mean penetration depths for the 300-mm-,
150-mm-, and 100-mm-diameter containers were 81 mm, 76 mm, and 70 mm, respectively.
In general, the suite of measurements indicate that, as expected, the mean penetration
depth increases and amax decreases with increasing container diameter. For the case of most
practical importance, where the impactor diameter is much greater than the diameter of the target
grains, both the penetration depth and amax are essentially independent of container diameter when
the ratio of impactor diameter-to-container diameter is greater than about 10.
Plastic spheres at the surface of the target bed in the neighborhood of the point of impact
were ejected upward and outward by the impactor. As the impactor penetrated downward, target
spheres displaced by the impactor filled in the cavity created behind the impactor, leaving only the
aluminum shaft protruding out of the bed of spheres at the end of each experiment. The
deceleration curves for impacts into beds of plastic spheres are qualitatively similar to impacts into
other materials. One distinct difference, however, was the occasional occurrence of multiple peaks
in deceleration before amax was attained. Such peaks are inferred to result from the interaction of
the impactor with individual bed spheres at time scales that could be resolved by the accelerometer
experiments, but the apparatus is unable to resolve them. After amax was attained, the
instantaneous deceleration usually entered into the damped oscillation phase when the magnitude
of the deceleration was about -2 g. Typically, the time between amax and the first crossing of the
deceleration curve over the zero g line was about 0.03 s. The phase of damped oscillation typically
lasted for approximately 0.15 to 0.2 s. The damped oscillations in the plastic sphere impacts were
considerably more prominent than those observed in the natural granular materials; in the plastic
spheres two or three oscillations having magnitudes nearly as great as amax were not uncommon,
whereas the impacts in sand displayed a single prominent peak and oscillations having greatly
reduced magnitude.
The deceleration curves for impacts in the bed of plastic spheres display considerably
more structure than the curves from other experiments. During the period of damped oscillations,
for example, approximately 20 peaks were observed, with instantaneous fluctuations in
deceleration ranging from 0 to -10 g. Ancillary observations in which the shaft and impact sphere
apparatus were pushed into the bed of spheres by hand clearly indicated the episodic, erratic
stick-slip nature of the penetration process. Supplemental experiments which utilized a force sensor
descending at a constant rate through the bed of spheres generated a “stair-step” shaped curve,
giving the impression that the penetration resistance did not increase smoothly but in discrete
steps (Figure 12). Quite possibly, chains of contacting spheres become “locked” by frictional
forces, causing the resistance force acting on the penetrating sphere to build rapidly to a threshold
point (Albert et al., 1999). As the stress increases, bed grains are forcibly displaced until the
assemblage fails locally and penetration proceeds until another chain forms. Such chains have
been visually observed in both two-dimensional and three-dimensional assemblies of photoelastic
phenomena are responsible for the prominent sinusoidal oscillations displayed on the impactor
deceleration curves.
2.6 Impacts Into Water-Saturated Beds
2.6.1 Natural Granular Target Materials (IN WATER)
Impacts in submerged natural, granular target materials produce deceleration curves that
are qualitatively similar to those produced in dry impacts, with several notable differences. In
particular, curves for water-saturated impacts lack the phase of oscillations ubiquitous in the dry
impact curves (Figure 13). Only the 24-mm-diameter impactor was used in the saturated impact
tests, and the initial impact velocity for all tests was approximately 1.3 m s-1. Typical values of the
absolute magnitude of amax in the saturated experiments are less than those observed during dry
impacts under comparable conditions, with the notable exception of the experiments using a
well-graded coarse-to-fine sand described below.
Well-graded coarse-to-fine sand (IN WATER)
The mean amax for impact of the small impactor into a submerged bed of well-graded
coarse-to-fine sand was -15.4±2.7 g (Figure 13 provides a comparison of typical curves under
dry and submerged conditions). The impactor dropped through a 150-mm-high water column to
the bed, which was held in the 150-mm-diameter container. The increase in amax over the dry
impact case is thought to be the result of the so-called dilatancy effect (Holtz and Kovacs, 1981).
Dilatancy is caused by the local expansion of the solid granular matrix during shearing that
tendency toward expansion during rapid shearing induces a negative pore pressure in the fluid in
the interstices, which in turn increases the shear strength of the sediment.
Poorly-graded coarse sand (IN WATER)
In sharp contrast to the results for the well-graded saturated sands, the mean amax observed
for impacts in the poorly-graded coarse sands was -4.6±0.8 g for the same experimental
conditions. This large change is tentatively and perhaps unsatisfactorily explained by reference to
the dilatancy phenomenon, but the detailed analysis of transient fluid motion in the deforming
granular assemblage necessary to fully address the problem is beyond the scope of this study.
Quartz pebbles (IN WATER)
The mean amax observed for impact of the small impactor into a submerged bed of quartz
pebbles was approximately -16.6±4.8 g, compared to values up to and exceeding the accelerometer
specifications of -25 g for impacts in air.
2.6.2 Cellulose Acetate Spheres (IN WATER)
Impacts into a submerged bed of cellulose acetate spheres are qualitatively similar to
impacts in dry media (Figure 14). As expected, values of amax for the submerged bed impacts are
significantly less than for the dry bed impacts, by a factor of nearly three. Because the numerical
simulation does not presently address the complex fluid flows generated during the impact
process, the data collected to date will be of considerable value for future work but is not
2.7 Deceleration Phenomena - Discussion
Experimentally derived deceleration curves demonstrate the ability of the accelerometer
device to distinguish various target materials. The experiments confirm that a single parameter,
amax, can satisfactorily determine important bulk properties of the seafloor. Figure 11 provides a
comparison of the curves for various target materials for impacts in air (see Figure 15 for
comparison of the curves for impacts under water). Other parameters that may be correlated with
seafloor properties may include the penetration time, the presence or absence of damped
oscillations in the deceleration curve, among others. In practical applications various cost-benefit
criteria will likely determine the parameters of greatest value that can be obtained quickly and
cheaply. The laboratory experiments offer the opportunity to examine the variability of the several
parameters under controlled conditions, which heretofore has not been addressed. During the
development of the database of deceleration curves for all experimental trials, it was noticed in the
initial series of experiments that the maximum g values for the same experimental conditions often
fluctuated over a relatively large range of values (See Appendix E for a summary of amax values for
the experimental trials). In a given set of 10 to 20 trials, amax values for several of the tests might
vary by a factor of 2 from the mean value for that set. This was particularly apparent in the
experiments involving the cellulose acetate spheres, although variability was also evident in the
natural granular trials involving sand, but to a lesser extent. In order to attempt to answer why the
accelerometer was recording such varied results for the same target materials, additional tests were
undertaken and various possibilities were explored. An important aspect of any measurement
technique is understanding the various sources of uncertainty. Such sources are considered in
detail in the following section.
For experiments involving cellulose acetate spheres and natural granular particles, the
equipment and protocol, and natural variability inherent in the granular impact process. Sources
a-d below fall into the former category, ana-d sources e-g fall into the latter:
a. Instrument accuracy (the physical mechanism within the accelerometer device that
measures the changes in voltage and converts these values into acceleration) may
have led to errors in the results.
b. Apparatus inconsistencies (such as the shaft causing the accelerometer to descend
away from an exactly vertical line and/or the interference of the free-swinging,
flexible cable which attached the accelerometer to the data collector) may have led
to variation in the results.
c. Time step interval lengths (sampling rate inadequate to resolve the true maximum
deceleration) may not have captured the maximum acceleration if the peak
occurred and then dropped back down too quickly to be recorded.
d. Human error (slight variations in the shaft release, including a constant drop height
for each trial and precision with respect to the impact occurring at the center of
the container) may have affected the results.
e. The ratio of the impact-sphere diameter to the diameter of the target spheres
(resulting in non-uniform contacts and collisions between trials at the surface of
the spheres) may have led to variation in the results.
f. Variations in the packing or arrangement of the bed of spheres, such that ordered
structures or “force chains” formed from time to time, may have altered the
results.
g. Variations in the bulk density of the bed of spheres (due to the methods of mixing,
In order to determine which, if any of these factors, were the most important sources of
the inconsistency in the results, a number of experimental trials utilizing slightly different methods
and devices were conducted beyond the initial series of laboratory experiments. The discussion
below describes what the additional tests indicated about the variation.
Instrument Accuracy - In order to determine the accuracy and precision of the Vernier
accelerometer, the specifications were consulted as a first step. The expected accuracy for the
device used in these experiments is ± 0.25 g. In order to test this level of expected error against
the actual device being used, the accelerometer was positioned completely at rest with its sensors
lined up with the gravitational field of the earth, and then the acceleration was measured for the
same period as would transpire in an actual impact experiment. The measured readings which
should have been nominally 0 g were typically 0 ± 0.143 g. This is within the range of error
stated in the device specifications, and indicates that this source of error is probably negligible.
The Physical Experiment Apparatus – Experiments that utilized the guide for
maintaining the vertical orientation of the impact apparatus and sensor were sometimes affected
by friction, reducing the impact velocity and amax. Ancillary measurements show that the guide
friction is small compared to other sources of variability. In addition to friction caused by the shaft
guide, the orientation of the accelerometer can generate measurement error; such errors are
directly proportional to the cosine of the angular deviation from vertical, which would generate
errors of less than 6% for an accelerometer misaligned by 20 degrees from the vertical and thus are
small compared to other sources of variability.
The free-swinging cable connecting the CBLTM to the accelerometer was kept loose and
included in the mass of the apparatus; that portion was crudely approximated by weighing the
length of cable that did not rest on the ground surface during an experimental trial. The same
portion of cable was in motion for each trial, and behaved in a similar fashion during the course of
each trial.
Time Step Intervals - Measurements using an inadequate sampling frequency were
determined to be a cause of significant variability in results. A set of experiments using four
different time step intervals, 0.01, 0.005, 0.001, and 0.00023 s, was used to determine the minimum
sampling frequency. The sampling frequency that adequately resolves the impact phenomena
depends on the target bed material. For natural granular materials, a 0.001 s sampling interval is
adequate for determining amax; the difference between measurements 0.001 s and 0.00023 s is
statistically insignificant. Impact and penetration tests that involved a longer interval of time to
penetrate the target material (i.e., the bentonite suspension tests), did not exhibit large variability.
Human Error - The experimental protocol introduced two other potentially important
sources of error: small variations in the height from which the apparatus was dropped, and small
errors in the axial position of the apparatus relative to the container holding the target materials.
Both sources were determined to be small relative to other, natural sources of variability in the
experiments.
Natural or Intrinsic Sources of Experimental Variability
Analysis of the several sources of variability due to experimental equipment or protocol
indicate that natural or intrinsic variability in the impact phenomena dominates the observed
variability. Several sources of natural variability can be identified and evaluated; in particular, the
effects of discrete grains on the impact process can be expected to become important when the
container diameter, are comparable to the length scale of the target bed grains. As the ratio of the
diameters of the impact sphere and target grains approaches one, the impact process is dominated
by the details of the geometry of the initial contact point. Conversely, if the impactor diameter is
thousands of times larger (or more) than the diameter of the target bed spheres, it may be
reasonable to treat the bed as a continuum (e.g., a visco-plastic material) rather than as a collection
of discrete particles. The phenomena of interest in this study fall between these limits: the
experiments address diameter ratios ranging between about 4 to several hundred. At small values
of the ratio, interactions between individual grains are important, and variability in the impact
process is expected to be relatively high. As the diameter ratio increases, more grains participate in
the impact process, and the statistics of the process involve much greater sample sizes, and thus
the macroscopic variability of the impact phenomena are reduced. Experimentally measured
variations in amax decrease as expected with increase in the ratio of the diameters of the impactor
and bed grains.
A second source of natural variability in the impact experiments arises from a comparison
of the impactor and target-grain length scales with a length characterizing the dimensions of the
container. If the container is much larger than both the impactor and target grains, the impact
phenomena may be reasonably expected to be independent of container size. However, explicitly
quantifying “large” in this context is not straightforward. Additional length scales can easily be
imagined that might enter into consideration; for example, the distance over which forces exerted
at the point of initial impact fall off by a factor of 1/e. Such length scales are not easily derived,
but the experiments show empirically that both the width and depth of the container must have
dimensions exceeding tens of target grain diameters before the effects of container size can not be
The length scales involved in target-particle packing variations or equivalently, bulk
density variations, may also be important. For example, differences were observed in the way the
upper surface of the target spheres behaved during repeated trials under the same conditions. In
some experiments target spheres were ejected completely out of the container by the impact, but
in other nominally identical experiments no spheres were ejected. Possibly related to these upper
surface variations are the deceleration patterns for some of the experimentally derived curves for
the plastic spheres. Figure 16 depicts two different maximum g patterns that were observed to
have an effect on the magnitude of the amax. Two additional observations indicate that particle
packing significantly influences amax. First, the methods of filling the container with target spheres
and homogenizing the mixture are critical processes. When spheres were poured into the holding
container from the same height and approximately the same rate so that their settling and particle
arrangement were dynamically adjusted by the pouring process, the measured amax was significantly
higher, by tens of percent, than when the bed of spheres was stirred with a mixing rod prior to a
test run. Second, when tests were performed after tapping and shaking the container, the mean
values of amax were increased; in the case of the well-graded sand mixture, amax for the shaken sand
bed was approximately -28 g, while measured mean values of amax when the bed was gently mixed
and then smoothed without disturbing the container was only -13 g. Various methods were used
to control the bulk density and particle arrangement including controlling the pour rate and height
of the target materials as they were placed into the container before each trial, manual mixing after
the particles were already in the container, not disturbing the container prior to a test, and
smoothing the upper surface of the material with a flat tool. Large variations were observed, and
point to the need for additional study of the effects of natural processes that may affect amax,
A final consideration in the present experiments is the potential for long-range
organization of the identical plastic target spheres, which have been observed to spontaneously
assume closest-packed geometries during container filling. Such nonrandom packing
arrangements are easily discovered by visual inspection through the clear container walls, and thus,
are avoided. However, small clusters of closest packed spheres, which might mimic very large
particles, may have been undetectable in the interior of the container.
2.8 Video Observations of the Physical Experiments
Real-time digital video recordings of the physical experiments were made using a Sharp
VL-NZ50 Digital Viewcam with MiniDV technology and a Kodak DX 4330 digital camera with
video capability. Digital video was then observed on the LCD screen of the cameras as well as on
a television screen or computer monitor when connected to these output devices. The video
could be slowed down by a factor of 8 in order to see the impactor collision and consequent
motion of the target spheres. All of the observable aspects of the impact and penetration process
were captured for review and visual analysis, which provides valuable data for comparison with the
numerical simulations, as discussed in more detail later.
Review of the video images in both real time and slow motion indicated that at the
moment the large sphere first made contact with any target spheres, surface target spheres were
ejected up and outward toward the edge of the container. As the impact sphere penetrated rapidly
into the target spheres, the overall volume of the bed of spheres increased. This increase in
volume was visually evident as a slight vertical movement of the upper surface of the target
spheres relative to the initial level of the upper surface. Bed spheres immediately rolled back over
the large impactor at its point of penetration due to the depression that was created. The upper
even after target spheres rolled back toward the center of the container to partially fill the
depression. At the end of the experiment, the impactor sphere was completely beneath the surface
of the smaller sphere bed, and only the guiding shaft protruded out from the bed.
3. Numerical Experiments
The particle-dynamics computer simulations used in this study explicitly solve the
equations of motion for a number of particles under the influence of body and interparticle forces
[Drakeand Walton 1995]. The simulations integrate F=ma and a corresponding set of equations for the torques for each of the target spheres as well as the impactor sphere. Normal and tangential
forces between contacting particles are linear functions of the distance between sphere centers and
the relative tangential displacement at the contact point, respectively. Particle interactions are both
inelastic and frictional [Drake and Calantoni 2001].
The numerical simulations were designed to allow quantitative comparison with physical
experiments involving impact of a spherical impactor into a bed of dry spheres. Physical
experiments involving spheres submerged in water were not simulated in this study, since a
detailed model of the fluid motion in the impact process is not presently available. The
simulations presented here are fully three-dimensional prototype simulations of the physical
experiments with no free parameters.
3.1 Discrete-Particle Model
Normal and tangential forces between contacting spheres are based on approximations
[Walton and Braun, 1986a, 1986b; Drake and Walton, 1995] to theoretical models for identical,
homogenous Hertzian elastic spheres developed by Mindlin and Deresiewicz [1953]. The magnitude
(
i
For loading (approaching particles)
Fn=k1a
For unloading (receding particles)
Fn=max[k2(a-a0),k3a]
where a is the overlap of spheres, a0 is the value of a where the unloading curve goes to zero, and
k1, k2, and k3 are constants. No negative values are allowed for Fn. For binary collisions the
coefficient of normal restitution e is approximately
e=(k1/k2)1/2
The tangential force Ft, described in detail by Drake and Walton [1995], is
Ft=min |ktds|,|µφFn|),
where kt is the tangential stiffness, ds is the tangential displacement at the contact point, µφ is the
friction coefficient (sliding and static friction are not differentiated here), and the sign of Ft
opposes relative motion of the spheres at the point of contact.
3.2 Simulation Parameters
The geometry of the container, the target spheres, and the impact sphere come directly
from the physical experiments. The following paragraphs describe how the physical parameters
were incorporated into the numerical simulations.
3.2.1 Conta ner
The container used in the simulations was a rectangular prism 95 mm by 105 mm, filled