Centre for Advanced Spatial Analysis University College London
1-19 Torrington Place Gower Street
London WC1E 6BT
Tel: +44 (0) 171 391 1782 Fax: +44 (0) 171 813 2843 Email: [email protected] http://www.casa.ucl.ac.uk
http://www.casa.ucl.ac.uk/surfacenetworks.pdf
Date: July 2000
ISSN: 1467-1298
ABSTRACT
Parameterisation of a topographic surface into a framework of fundamental points and lines is a prominent research topic in geographic information science. Metric Surface Network also called Pfaltz's graph or surface network is an example of such a framework. Surface Network is a graph topological data structure and pits, passes, peaks are its three sets of vertices while ridges (lines from passes to peaks) and channels (lines from pits to passes) make up the edge set. Each point and line is assigned a weight, which indicates their importance in the surface. The most significant aspect of surface network is their ability to undergo generalisations by a graph theoretic technique called homomorphic contraction, which reduces the number of points and lines but preserves the topological structure of the corresponding topographic surface. This paper presents a review of the generalisation and visualisation methods by experimenting with two surface networks, one hypothetical and the other from Latschur region in Western Carinthia, Austria. Experiments revealed that the traditional weight measure i.e., difference in elevation between a pair of linked points, may not be able to provide desired generalisation and as an alternative three new weights measures namely edge lengths, edge slopes and degree (or valency) of points are proposed. This work also proposes the use of 3D visualisation for surface networks to understand the topological relations between points more clearly.
Introduction
Parameterisation of the continuously varying topographic surface into a discrete topological data structure or framework is an area of consistent investigation in spatial information science. A prominent example of such surface topology data structures is the Metric Surface Network also called Pfaltz's graph (Pfaltz, 1976; Wolf, 1988; Wolf, 1990) or simply surface network. Surface network is a graph theoretic based topological data structure, which has proved to be useful for both characterising and generalising the form and topology of topographic surfaces1. The basic aim of these topological data structures is to use less storage space and allow faster heuristics but yet be able to represent both the major form (geometry) and structure (topology) of the topography, which is particularly useful for applications such as generalisation, drainage network analysis and route planning. However in spite of their powerful capabilities of manipulating the structure of topography, not much work has been done to implement surface network and understand their properties. The aim of this paper is to revive this idea and report on the characteristics of the
1
generalisation methods and the use of 3D visualisation in surface networks. The next section presents a background on surface networks and also sets the aims of the experiments in this work.
Surface Networks - Background
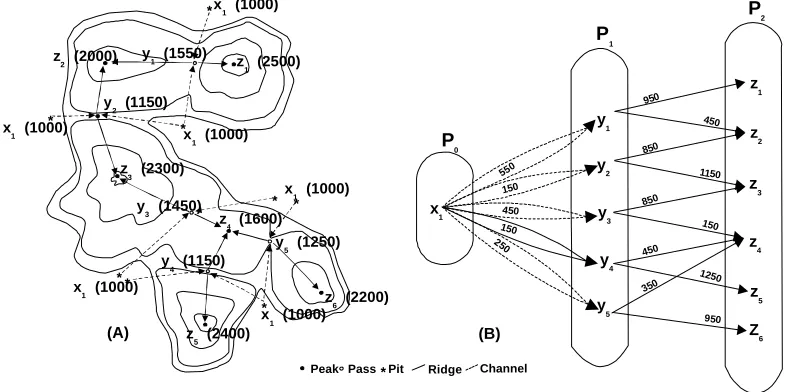
In simple terms surface networks store topography as a graph made of the fundamental points (vertices) namely pits, passes and peaks, and the fundamental lines (edges) namely ridges (lines from passes to peaks) and channels (lines from pits to passes) (Figure 1) of a surface. However not all topographic surfaces and all such graphs can be used for surface networks but only the ones which satisfy the definition of topographic surface given below and the topological rules deduced by Pfaltz (1976) and Wolf (1988).
Definition of the topographic surface:
1. The surface should be twice continuously differentiable, which means it can not have sudden slope breaks or overhangs,
2. The surface should be defined over a domain, which is simply connected which means it can not have holes, and
3. The surface is bounded by a closed contour line, represented as either a surrounding pit or surrounding peak.
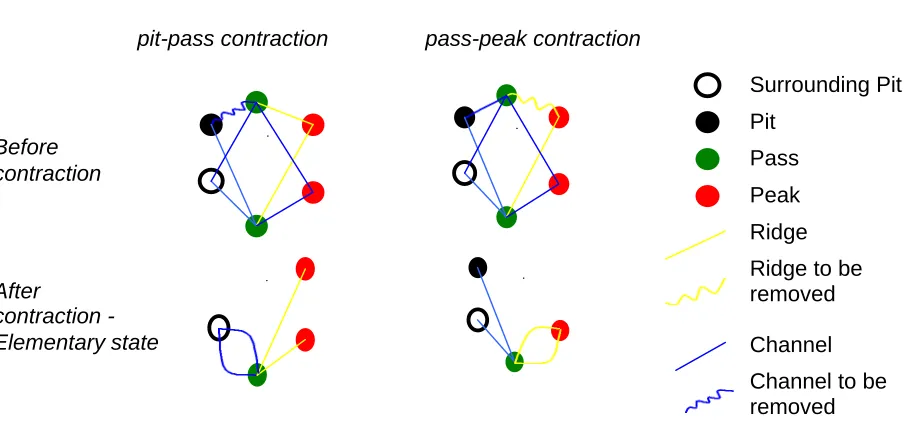
In nature, there are two other points on the surface namely junctions and bifurcations, which are not fundamental as an entity but have significant importance in structure of topography. Wolf (1990) proposed that channel junction/bifurcation and ridge junction/bifurcation could be represented as an infinitesimally close interpolated pair of pit-pass and pass-peak, respectively. Each vertex and edge is assigned a real positive number (a weight), which represents their importance in the surface. A typical weight measure is the difference in elevation between a pair of linked peak-pass and pass-pit. In case of junctions and bifurcations, an arbitrary low weight can be assigned to indicate their proximity, for example Wolf (1990) used a value of 2.
pit (or peak), which becomes free, is then connected to the pit (or peak) originally linked to the contracted pass, thus restoring topological consistency (Figure 2). The complete mathematical proof of the contractions is provided in Pfaltz (1976) and Wolf (1989).The selection of a pit or peak is based on an importance criterion, which depends upon the particular problem and the topography. Three possible importance criteria for the selection of pits and peaks, based on edge weights are:
• The maximum of the elevation differences between a peak or pit and all its adjacent passes. This measure can be used to remove peaks and pits ranked on the basis of the steepest ridge and channel linked to them.
• The minimum of the elevation differences between a peak or pit and all its adjacent passes. This measure can be used to remove peaks and pits ranked on the basis of the shallowest ridge and channel linked to them.
• The sum of the elevation differences between a peak or pit and all its adjacent passes. This measure can be used to selectively remove pits and peaks with low number of crossings.
The original ideas on generalisation and weight measures from Wolf (1988) however have limitations, which restrict the implementation of surface networks. The following list presents a compilation of the doubts raised by Rana (1998) and fresh proposals on weight measures.
Condensation:
Sequential condensation of surface networks does not provide flexibility to the user to generate a desired topology and topography. Wolf (1989) experienced a typical limitation. He observed that the quality of condensed contour maps could be improved substantially if the step to eliminate a peak and its adjacent pass were shifted to a subsequent one. It is also apparent that vertex importance based selection criteria are insensitive to the ridge or channel structure at a peak or pit. This means that edges are solely selected for condensation, based on their weights and no consideration is given to the size or significance of the host structure (such as length of edges), which may not be suitable in some cases. Rana (1998) proposed the User Defined Contraction (UDC), in which a user can arbitrarily select an internal pit or peak for removal, which allows not only the flexibility desired above, but also the power to create experimental surface networks.
Weights:
• The sum of edge weights will not be able to differentiate between two equally weighted points but with a different number of edges. Thus it is not a good indicator of the ridge and channel crossings at a point.
This work proposes the use of edge lengths, edge slopes and degree (or valency) of points as alternative weights to avoid these limitations and examples of these will be shown in the next section. The use of edge length is also more effective for cartographic generalisation as it brings out high frequency elevation changes in surfaces for condensation.
• One more doubt in current ideas is the lack of suggestions to decide between equally weighted points.
Visualisation:
Due to the look of a straight-line graph, the visualisation of surface networks in 2-dimensions can give an impression of non-planarity to a user, when edges overlap during condensations. This also limits the user's scope of generalising the surface network. Rana (1998) proposed the use of 3D visualisation, which would show the relations between points clearly. This proposal has been implemented in this work and an example of its use will be shown in the next section.
Experimentation
Methodology
Points
Point Column 1 Column
2
Column 3 Column 3 Column 4 Column 5
Pit X ID x-co-ordinate
y-co-ordinate
z-co-ordinate
0 (if surrounding) or 1 (if internal)
Pass Y ID -do- -do-
-do-Peak Z ID -do- -do -do 0 (if surrounding) or 1 (if internal)
Lines
Column
1
Column 2 Column
3
Column
4
Column 5 Column 6
E YID X1ID X2ID Z1ID Z2ID
For example part of the data for the Figure 4b surface network is as follows:
Y y4 1.61 0.58 1150
X x5 0.77 0.45 1000 0
Z z6 2.74 0.35 2200 1
E y1 x1 x2 z1 z2
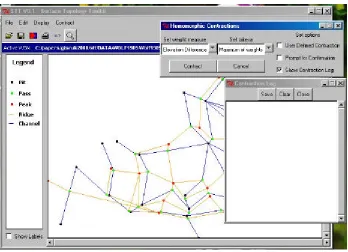
The generalisations were carried out using an application, Surface Topology Toolkit (STT), developed by the author in Tcl/Tk. Tcl/Tk is becoming a popular language amongst GIS programmers (Dykes, 1997). The highlight of Tcl/Tk functions is the provision of dynamically manipulating the properties of graphical objects with ease and speed, which is particularly useful for cartographic and other visualisation applications. Owing to the Graphic User Interface (Figure 5) and UDC present in STT a user is able to achieve considerable improvement over the earlier methods for the generalisation and visualisation of surface networks (Wolf, 1991). The other main advantages of STT are as follows:
• STT informs the user of every contraction (except for continuous contractions) so that a selection can be made more intuitively.
• Users can generalise the topography by a combination of importance measure rather than a single one and can also arbitrarily select an internal pit or peak for contraction.
• Users have the flexibility to undo a contraction to observe the changes in results for better generalisation.
This work has the following experimental aims:
1. To compare the effectiveness of drop in elevation, edge length and valency weight measures. 2. To compare the effect of maximum, minimum and sum of edge weights contraction criteria on
the topography.
3. To use UDC to generate artificial landform changes.
4. To use 3-Dimensional visualisation to test topological consistency of surface network with overlapping edges.
Results
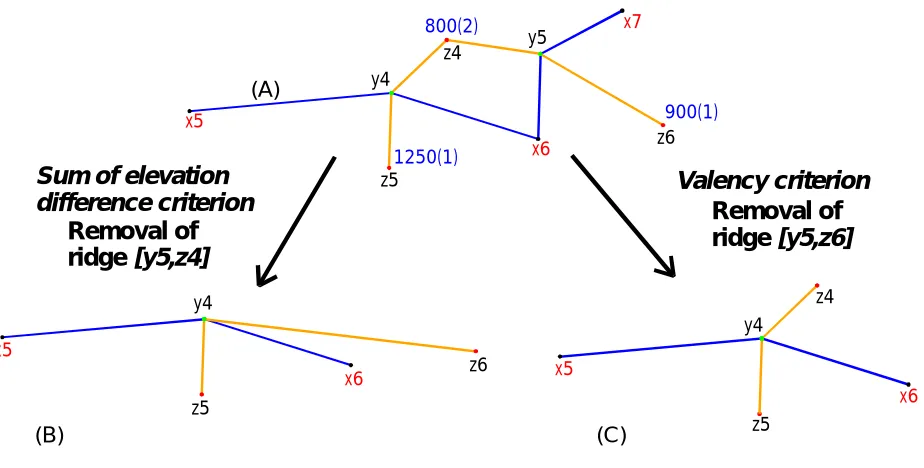
Effectiveness of drop in elevation, edge length and valency weight measure
As mentioned earlier the aim of using maximum and minimum edge weight criteria is the removal of peaks/pits based on respectively the steepest and shallowest ridges/channels linked to them. However, as would be expected a drop in elevation weight does not take into account the length of the edges, therefore it makes long edges vulnerable for condensation. For example, for the surface network shown in Figure 6a, the next maximum drop in elevation weight criterion based condensation will remove the ridge [y1, z2] (Figure 6b) although it is longer, thus more important, than some of the other ridges in the surface. On the other hand, maximum edge length weight criterion based condensation selects to remove the ridge [y1, z1] (Figure 6c) and therefore is a more sensible measure. However, it is important to note that even after a better decision the ridge [y1, z2] is still removed due to topology condensation rules, which proves the earlier stated proposal, that condensation solely based on weights, ignores the structure of ridge/channel networks.
Effect of maximum-, minimum- and sum of edge weight contraction criteria on the
topography
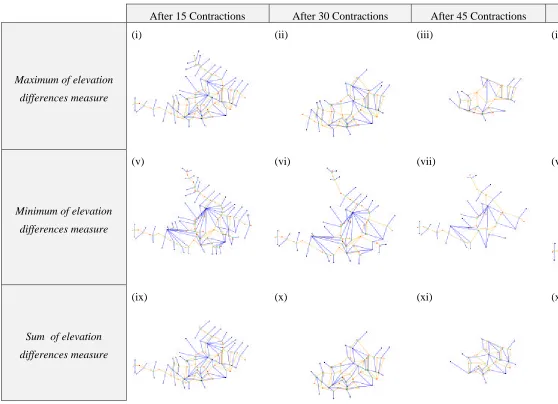
Surface networks from different contraction measures were collected after each 15 steps of contraction of the Latschur surface network (Figure 5a,b) to compare the generalisation of the corresponding topographic surface (Figure 8). The following striking observations were noted:
• Contractions based on minimum of edge weights measure produced intersections between edges very early in the generalisation process but it was the only one to maintain the continuity of the ridge structure through the entire area. Even after 60 contractions, the ridge structure could be observed in the surface network (Figure 8 viii). This indicates that minimum of edge weights measure would be the most suitable of the three measures for generalisation of topography based on a surrounding pit, if the major structure is to be retained.
• Contractions based on sum of edge weights (Figure 8 ix - xii) and valency result in the maximum and fastest contraction of the topographic structure (meaning loss of topography), moving from periphery (because of degree one edges) towards the centre.
Use of UDC to generate artificial landform changes
Study of landform evolution is a very useful topic of research in order to understand the geomorphic and tectonic phenomena in nature. Researchers use some form of landform models to simulate changes and predictions, but often require detailed mathematical analysis. As an alternative, this work proposes that UDC can be used to introduce similar changes more easily and quickly. An example of the generation of a NW-SE trending artificial valley in the Latschur surface network is shown in Figure 9. This valley was achieved simply by merging minor channels in this area and the removal of the intersecting ridges along these channels. However, as its apparent, the changes are purely topological and one of the main advantages of other landform evolution models is their ability to regenerate the topography.
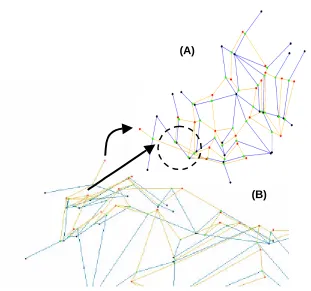
Use of 3-Dimensional visualisation to view overlapping edges
Conclusion
Surface Networks have an immense potential for future research and some key areas which needs to be addressed are:
• Detailed understanding of the property and effects of each of the condensation criterion.
• Development of routines of the automated extraction of surface networks. An essential issue in this research will be to implement surface network for biased topographic forms such as glaciated-, karstic-, volcanic- surfaces as they would not have clearly defined surface network components.
• Development of models for the regeneration of topography incorporating topological settings. One aspect associated with this research will be the transformation of surface networks from a 2D straight-line graph like appearance to a more realistic (meandering ridge and channels) representation for realistic visualisation and morphometric analysis.
Acknowledgements
Many thanks to Gert Wolf, University of Klagenfurt, Austria for providing the data for Latschur surface network and Sarah for help in the manuscript preparation.
References
Dykes J.A. (1997), cdv: A Flexible Approach to ESDA with Free Demonstration Software, Proceedings 34th Annual Symposium of British Cartographic Society, 100-107.
Pfaltz, J. L., (1976), Surface Networks, Geographical Analysis 8(2), 77-93.
Rana, S. S. (1998) Extraction of Surface Topology from Digital Elevation Models, MSc Dissertation, Department of Geography, University of Leicester, 68pp.
Wolf, G.W., (1988) Weighted Surface Networks and their Application to Cartographic Generalisation, in W. Barth (Ed), Visualisierungstechniken und Algorithmen, Springer Verlag, Berlin, 199-212.
Wolf, G. W. (1990) Metric Surface Networks, in Proceedings 4th International Symposium on Spatial Data Handling, Zurich, Switzerland, 844 – 856.
Wolf, G. W. (1991) A FORTRAN subroutine for cartographic generalization, Computers and Geosciences 17(10), 1359-1381.
Figure 1. (A) Pits, passes, peaks, ridges and channel lines on a topographic surface (numbers in the parentheses
indicate altitude of points) and its (B) Surface Network as a tripartite graph, where P0, P1, P2 are the three vertex sets
representing the sets of all pits, passes and peaks, respectively. Edge weights are indicated on the edges (From Wolf,
1991).
z (2000)2 y (1550)1
z (2500)1
y (1150)
2
z (2300)
3
y (1450)
3
z (1600)4
x (1000)
1
x (1000)1
x (1000)
1
x (1000)
1
x (1000)1 x (1000)
1
y (1150)
4
y (1250)
5
z (2200)
6
z (2400)5
* * * * * * * * x1 y2 y1 y3 y4 y5 z1 z2 z3 z4 z5 Z6 550 150 450 150 250 950 450 850 1150 850 150 450 1250 350 950 P0 P1 P2 (A) *
Surrounding Pit
Pit
Pass
Peak
Ridge
Ridge to be removed
Channel
Channel to be removed
pit-pass contraction pass-peak contraction
Before contraction
After
contraction -Elementary state
Figure 2. Mechanisms of Homomorphic Contractions.
Figure 3. (A) Topographic surface (same as Figure 1) and its (B) surface network. Blue contour represents the
surrounding pit.
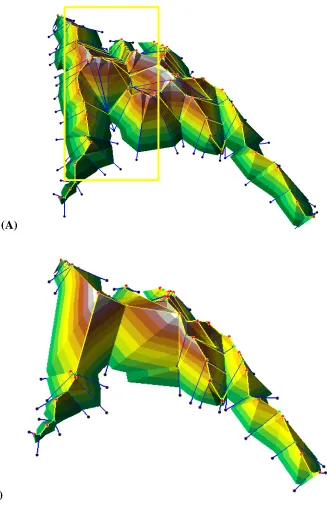
Figure 4. (A) Landscape of a portion of the Latschur Mountains in Western Carinthia, Austria and its (B) surface
network. Blue contour represents the surrounding pit.
(A) (B)
(A)
Figure 5. The Graphical User Interface of the Surface Topology Toolkit application with the functionalities
(A) (B) (C) (A) (B) (C) 800(2) 900(1) 1250(1) x7 z6 x6 y5 z4 y4 z5 x5 x6 z4 y4 z5 x5 z6 x6 y4 z5 x5
Sum of elevation
difference criterion Valency criterion
Removal of ridge [y5,z4]
Removal of ridge [y5,z6]
x2 x1 x3 z1 y1 z2 y2 x2 x3 z1
y2 x2 x3
z2
y2 Maximum of elevation
difference criterion Maximum of edge
criterion length
Removal of
ridge [y1, z2] Removal of
ridge [y1, z1]
Figure 6. Comparison of the effectiveness for selection of points in the surface network (A), between maximum of elevation difference criterion (B) and maximum of edge length criterion (C). Note that criterion (B) selects a long ridge due to its low drop in elevation (350).
After 15 Contractions After 30 Contractions After 45 Contractions After 60 Contractions
Maximum of elevation
differences measure
(i) (ii) (iii) (iv)
Minimum of elevation
differences measure
(v) (vi) (vii) (vii)
Sum of elevation
differences measure
(ix) (x) (xi) (xii)
Figure 8. Surface Networks of Latschur area after each 15 contractions based on maximum of elevation differences criterion (i-iv), minimum of elevation differences
(A)
(B)
Figure 10. (A) Latschur surface network showing an apparent intersection of the edges in 2D inside the dotted
circle. (B) The same surface network in 3D shows that the ridges are above the channels and the topological
consistency is maintained. Arrows connect corresponding features in the surface networks.
(A)