Introduction to Interaction Overview Diagram as a
Model
Sumender Roy#1 Research Scholar
JNTU Kakinada
Dr Samuel Vara Prasada Raju#2 Prof. (SDE),
Andhra University
Abstract UML diagrams became an industry standard to capture the system structure and behavior are considered as well suited diagrams in model based testing. Software testing is one of the main activities to be carried out in the software development life cycle. It consumes more money and time, which leads to automation that reduces the human effort in finding bugs and errors. Automation in the last phase of system development is similar to manual testing. In both cases bugs are detected only after code has been complete. So rectifications and modification of the code takes lot of time. So testing process should be started from the beginning phase of software development life cycle and should continue till the last phase. Three approaches in testing are code based testing, specification testing and model based approach. So we focus on Model Based Approach for automatic test case generation. In this paper we focus on Interaction overview diagram as a suitable model that can be used in model based testing.
I. INTRODUCTION TO SOFTWARE TESTING
Software testing is a process of validating and verifying that a computer application meets the requirements that guided its design and development, works as expected, can be implemented with the same characteristics, and satisfies the needs of stakeholders. Generally, software testing consumes thirty to fifty percent of the software development budget, resources and time. Software failures cost companies and consumers loose large amount of money. The worst software failures have already damaged reputations, impacted negatively on financials, and caused stress to users and highlights the continuing problems faced by the financial and banking sector. Software failure happens only when there is insufficient testing done for the system. In August 2011, Honda had to recall 2 million cars due to a software failure problem. The problem had to do with the transmission control modules of some of its models. Among the recalled models were the 2001 and 2002 Accord, 2001 to 2003 Civic, 2003 CRV, 2003 Pilot and 2003 Acura 3.2 TL. GM also recalled about 50,000 units of the Cadillac SRX crossover SUVs in June 2011 because of a software failure that may not allow the deployment of airbags for passengers sitting in the right rear seat in the event of an accident.
Significant investment must be made on testing in terms of time and effort. Organizations shouldn't measure testing purely on cost and time but should look at the value it can bring. According to a study it can be summarized as: 'Software is normally written by humans, humans make mistakes, and when they make a mistake while coding, the software is said to contain a fault or defect or bug. If the fault is "executed", a failure may occur. Testing is the process of detecting faults before software is made operational. Software testing always remains a tedious, complex, and error-prone process as a consequence of the latest tools and technologies perpetually trying to match the ever growing size, functionality, complexity, and heterogeneity of software systems. The capability for delivering high quality software under competitive pressure and tight schedules has become an important factor for software organizations. Spending too much time or money on unnecessary testing can possibly result in late delivery and wastage of resources. It is important to remember, if software testing can take a company to its business heights it is the same testing (if not conducted properly) that can ruin not only its reputation but the entire company.
II. MODEL BASED TESTING
An advanced approach used now days in testing is model-based testing (MBT) where test cases are generated from pre existing models of the system under test. The model under test need not be a formal specification of the system and can merely be a representation of some aspects of the requirements to be tested. A model is a description of a system's behavior. Behavior can be described in terms of input sequences, actions, conditions, output, and flow of data from input to output. It should be practically understandable and can be reusable; shareable must have precise description of the system under test. Model based testing is a testing technique where run time behavior of software under test is checked against predictions made by a formal specification or model. In other means, it describes how system behaves in response to an action determined by a 333model. Model-based testing is a variant of testing that relies on explicit behavior of models that encode the intended behavior of a system and possibly the behavior of its environment. Pairs of input and output of the model of the implementation are interpreted as test cases for this implementation: the output of the model is the expected output of the system under test (SUT). In terms of model-based testing, the necessity to validate the model implies that the model must be simpler than the SUT, or at least easier to check, modify and maintain. Otherwise, the efforts of validating the model would equal the efforts of validating the SUT. On the other hand, the model must be sufficiently precise to serve as a basis for the generation of “meaningful” test cases. A model-based testing process must take into account the involved abstractions, and it is likely that omissions in the model mean that these omitted parts cannot be tested on the grounds of the model in question.
Over the last two decades the popularity of object oriented programming in software engineering increased the growth of testing techniques named as model based testing. MBT is a software testing method is used to generate test cases entirely or partially from a behavior model. The test cases generated from this model are abstract test cases which are not executable. MBT is generally assumed as black box testing because the test cases are generated from models instead from the source code. MBT is a technique for automatic generation of test cases using models extracted from software artifacts. MBT is a simple approach that is based on test case generation and test result evaluation. Fundamental tasks in model based testing involve gathering the necessary information to build a model, generating tests from the model, and evaluating the test generated from the model. Model is a depiction of the behavior of software system. Behavior is defined in terms of input, output, actions, conditions, control flow, and data flow in the software system. There exist many models that describe different aspects of software behavior. Some of them are finite state machines, state charts, UML, markov chains, petri nets, and decision tables.
III. UMLMODELS
Unified modeling language called as UML was initially developed by James Rumbaugh and Grady Booch. The evolution of UML began with the need for a modeling language in which you can develop models of objet oriented software systems. During the mid 70’s and late 1980’s, three prominently used modeling languages in industry includes Booch’s Booch’ 93, Jackob’s Object Oriented Software Engineering, Rumbaugh’s Object Modeling Technique. Due to the availability of several modeling languages in the industry, lead to the invention of a standard language for modeling. For the first time Booch’s 93, OOSE, and OMT were unified and released as UML version 0.9.software organizations such as HP, I-Logix, IBM, Microsoft, Oracle, Rational software, and Unisys formed as the UML consortium and presented a version UML1.1. OMG which is a nonprofit organization standardized UML1.1 and took the responsibility of maintaining the versions of UML.
UML is now developed and administered by Object Management Group is used to create well documented models. Latest versions of UML include UML 2.0 in 2005, UML 2.4.1. in August 2011, in process version UML 2.5 in October 2012. The new diagrams that are added to the previous list include Model Diagram, Manifestation diagram, and Network architecture diagram. The latest version of UML reduces redundancy by specifying models in the form of human readable elements and increases clarity by providing detailed explanation of the semantics. The 4 layer architecture has been removed by OMG as it was rarely used. With invent of Model based testing UML can be defined as a diagram and a model, where a model represents all relations and contains documentation where as it can be viewed as a diagram or a graphical representation. UML is used to study both the structural and behavioral semantics of a system. Structural semantics specify the meaning of the UML structural model elements. Behavioral semantics define the meaning of UML behavioral model elements.
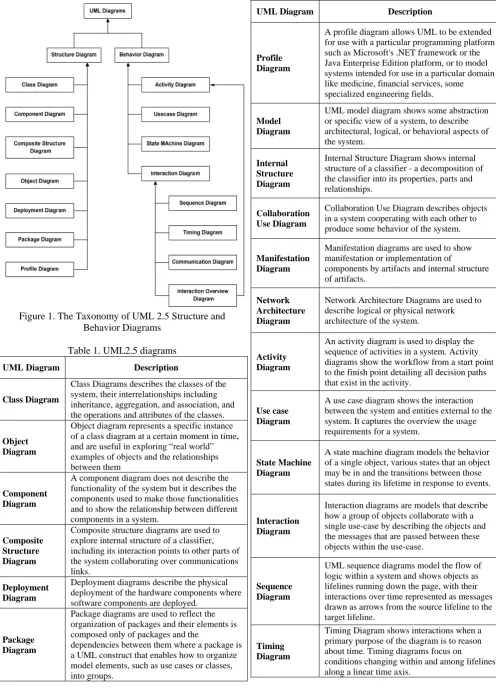
Figure 1. The Taxonomy of UML 2.5 Structure and Behavior Diagrams
Table 1. UML2.5 diagrams
UML Diagram Description
Class Diagram
Class Diagrams describes the classes of the system, their interrelationships including inheritance, aggregation, and association, and the operations and attributes of the classes.
Object Diagram
Object diagram represents a specific instance of a class diagram at a certain moment in time, and are useful in exploring “real world” examples of objects and the relationships between them
Component Diagram
A component diagram does not describe the functionality of the system but it describes the components used to make those functionalities and to show the relationship between different components in a system.
Composite Structure Diagram
Composite structure diagrams are used to explore internal structure of a classifier, including its interaction points to other parts of the system collaborating over communications links.
Deployment Diagram
Deployment diagrams describe the physical deployment of the hardware components where software components are deployed.
Package Diagram
Package diagrams are used to reflect the organization of packages and their elements is composed only of packages and the
dependencies between them where a package is a UML construct that enables how to organize model elements, such as use cases or classes, into groups.
UML Diagram Description
Profile Diagram
A profile diagram allows UML to be extended for use with a particular programming platform such as Microsoft's .NET framework or the Java Enterprise Edition platform, or to model systems intended for use in a particular domain like medicine, financial services, some specialized engineering fields.
Model Diagram
UML model diagram shows some abstraction or specific view of a system, to describe architectural, logical, or behavioral aspects of the system.
Internal Structure Diagram
Internal Structure Diagram shows internal structure of a classifier - a decomposition of the classifier into its properties, parts and relationships.
Collaboration Use Diagram
Collaboration Use Diagram describes objects in a system cooperating with each other to produce some behavior of the system.
Manifestation Diagram
Manifestation diagrams are used to show manifestation or implementation of
components by artifacts and internal structure of artifacts.
Network Architecture Diagram
Network Architecture Diagrams are used to describe logical or physical network architecture of the system.
Activity Diagram
An activity diagram is used to display the sequence of activities in a system. Activity diagrams show the workflow from a start point to the finish point detailing all decision paths that exist in the activity.
Use case Diagram
A use case diagram shows the interaction between the system and entities external to the system. It captures the overview the usage requirements for a system.
State Machine Diagram
A state machine diagram models the behavior of a single object, various states that an object may be in and the transitions between those states during its lifetime in response to events.
Interaction Diagram
Interaction diagrams are models that describe how a group of objects collaborate with a single use-case by describing the objects and the messages that are passed between these objects within the use-case.
Sequence Diagram
UML sequence diagrams model the flow of logic within a system and shows objects as lifelines running down the page, with their interactions over time represented as messages drawn as arrows from the source lifeline to the target lifeline.
Timing Diagram
UML Diagram Description
Communicatio n Diagram
Communication Diagrams focuses on the interaction between lifelines where the architecture of the internal structure and how this corresponds with message passing. They focus on collaboration of objects rather than the time sequence.
Interaction Overview Diagram
Interaction overview diagrams focus on the overview of the flow of control of the interactions of a system where the nodes are interactions or interaction uses.
Information Flow Diagram
Information Flow Diagrams shows exchange of information between system entities at some high levels of abstraction. They describe circulation of information through a system by representing aspects of models.
Behavioral State Machine Diagram
Behavioral State Machine Diagrams describes the discrete behavior of a part of designed system through finite state transitions.
Protocol State Machine Diagram
Protocol State Machine Diagrams describes the usage protocol or a lifecycle of some classifier
IV.
B
ASIC CONCEPTS OF INTERACTION OVERVIEW DIAGRAMInteraction overview diagrams give an overview of interaction diagrams that include sequence diagram, communication diagram, timing diagram, and interaction overview diagram. Sequence diagrams emphasize on time sequence of messages and collaboration diagram emphasizes on the structural organization of the objects that send and receive messages. To combine all together IOD captures the dynamic behavior of a system, message flow in the system, sequence in which the messages are flowing, structural organization of the objects. Over all UML IOD presents execution path through an application. It represents the logical interaction between the interaction diagrams and the control flows in between the set of interaction diagrams. These diagrams are a variant of Activity diagrams in which the nodes represent interaction diagrams. Along with the notations used in Activity diagrams, interaction elements and interaction occurrence elements are used in IOD. Interaction elements display an inline interaction diagram, which can be a sequence diagram, communication diagram, timing diagram, or interaction overview diagram. Interaction occurrence elements are references to an existing interaction diagram in a rectangular frame, where as interaction occurrence elements are visually represented by a frame, with “ref” in the frame’s title space or top left corner. The diagram name is indicated in the frame contents. These frames indicate the type of diagram, “sd” for sequence diagram, “td” for timing diagram, “cd” for communication or collaboration diagram, and “iod” for interaction overview diagram. Messages and Activity Partitions are not directly included in IOD, they contain more overview than a detail activity diagram. So these diagrams are suitable only when an overview is desired. Some of the nodes used in Interaction Overview diagram are as follows.
Table2. Nodes in UML Interaction Overview Diagram.
Node type Description
Action
Action is an individual step within an activity. An action may have incoming and outgoing edges. Action will not begin until all input conditions are satisfied.
Initial Node
Indicates the starting point of an activity. When the activity starts, a token flows from the initial node. An activity can have several initial nodes.
Activity Final Node
Indicates the ending point of an activity. When a token arrives, the activity terminates. It denotes the end of all control flows in the activity. An activity can have more than one activity final nodes.
Decision Node
Indicates a conditional branch point in an activity. A decision node has one input and two or more outputs. An incoming token is presented to the multiple outgoing edges and it emerges on just one of the outgoing edges.
Guard
A condition which is associated with the outgoing edges of a decision node which specifies whether a token can flow along a connector.
Merge Node
Required to combine flows that were split with a decision node. Merge node has two or more inputs and one output. A token from one incoming edge is accepted among multiple alternate flows.
Comment Provides additional information about
elements to which it is linked.
Activity
Activity describes the highest level of behavior in an activity diagram. It is a container element that contains actions, control flows and other elements that make up the activity.
Fork Node
Fork node splits a single flow into concurrent flows. It has one incoming and multiple outgoing edges. Each incoming token produces a token on each outgoing edge.
Join Node
Join node synchronizes multiple flows. Combines concurrent flows into a single flow. It has multiple incoming edges and one outgoing edge.
Object Node Object node indicates an instance of a
particular state or a point in the activity.
Input Pin
Input pin is used to represent the input parameters on an action. It holds input values that are received from other actions.
Output Pin
Output pin is used to represent the output parameters on an action. It holds output values that an action produces.
Activity Parameter Node
Activity parameter nodes specify the input and output parameters of the activity.
Control Flow
Control flow is an edge the shows the movement of control from one node to another.
Object Flow Object flow is a path along which objects
Node type Description
Constraint
Constraint is a condition expressed in natural language to declare semantics of an element.
Lifeline
Lifelines represent either roles or object instances that participate in the sequence being modeled.
Messages
Messages depict work flow or activity over time from element to element. Allowed messages are complete, lost or found, synchronous or asynchronous, call or signal.
Gate
A gate is a message end or a connection point for relating a message outside the interaction fragment with a message inside the interaction fragment.
Execution Occurrence
Execution Occurrence represent the time an object needs to complete a task.
Interaction fragment
Interaction fragment represents an interaction.
State Invariant
A state invariant is an interaction fragment which represents a runtime constraint on the participants of the interaction.
Interaction use Interaction use is an interaction fragment
which allows calling another interaction.
Destruction occurrence
Destruction occurrence is a message occurrence which represents the destruction of the instance described by the lifeline.
State Timeline A state or condition timeline represents
the set of valid states and time
Duration Constraint
Duration constraint is an interval constraint that refers to a duration interval is used to determine whether the
constraint is satisfied or not.
Time Constraint
Time constraint is an interval constraint that refers to a time interval to determine whether the constraint is satisfied or not.
Constraint
A constraint is a restriction expressed in natural language text or in a machine readable language to specify the semantics of an element.
Frame
A frame in interaction overview diagram encloses other forms of interaction diagrams
Many researchers developed different techniques to generate tests from different UML diagrams [4] [5] [7] [8]. Abdurazik and Offut et al. [6] developed a technique to generate test cases from UML state diagrams. Kim et al. [9] present a approach to generate test cases from UML activity diagram. Sharma et al. [1] generated test cases from Sequence diagrams. Swain et al. [3] have proposed a method for generating the test cases using sequence diagram and activity diagram. Nayak et al. [10] generated test cases using Sequence diagrams. Samuel et al. [2] in their work they proposed a method for generating test cases from Sequence diagrams. Abdurazik and Offut [11] developed a technique to generate test cases from UML Collaboration diagrams.
V. CASE STUDY:ONLINE SHOPPING INTERACTION OVERVIEW DIAGRAMS [12]
The following is a simple case study of Online shopping interactive overview diagram. In online shopping case study customer tries to find either by searching or browsing for the item, whether an item is present or not, if the item is present customer views the item, if the customer likes the item adds it to the cart, if the customer dislikes an item removes the item. It contains basic activity nodes like initial node, activity final node, decision node, merge node and it contains seven interaction use nodes. they refer to seven sequence diagrams namely search items, browse items, update cart, add item to cart, remove item from cart, view item, and check out.
Figure 2. Online shopping Interaction Overview diagram
VI. CONCLUSION
REFERENCES
[1] M. Sarma, D. Kundu and R. Mall, “Automatic Test Case Generation from UML Sequence Diagrams”, In IEEE 15th International Conference on Advanced Computing and Communications, pp. 60-65, 2007.
[2] P. Samuel and A. T. Joseph, “Test Sequence Generation from UML Sequence Diagrams”, , In IEEE Ninth ACIS International Conference on Software Engineering, Artificial Intelligence, Networking, and Parallel/Distributed Computing, pp. 879-887, 2008. [3] S. K. Swain and D. P. Mohapatra , “Test Case Generation from
Behavioral UML Models ”, International Journal of Computer Appli-cations,Volume-6, pp. 5-11, September 2010.
[4] Emanuela G. Cartaxo, Francisco G. O. Neto and Patricia D. L. Machado, “Test Case Generation by means of UML Sequence Diagrams and Labeled Transition Systems ”, International Journal of Computer Applications,pp. 1292-1297, 2007.
[5] L. Briand and Y. Labiche, “A UML-Based Approach to System Testing”, Journal of Software and Systems Modeling, Springer Verlag, Volume-1, pp. 10-42, 2002.
[6] A. Abdurazik and J. Ofut, “Generating Tests from UML
Specifications ”, In the Proceedings of 2nd International Conference on Unified Modeling Language (UML), Fort Collins, CO, 1999.
[7] S. K. Swain, D. P. Mohapatra and R. Mall , “Test case generation on use case and sequence diagram ”, International Journal of Software Engineering, Volume-3, pp. 2152, 2010.
[8] F. Fraikin, and T. Leonhardt, “SEDITEC-testing based on sequence diagrams”, In Proceedings 17th IEEE International Conference on ASE,pp. 261266, 2002.
[9] H. Kim, S. Kang, J. Baik, and I. Ko. , “Test cases generation from UML activity diagrams Application ”, Eighth ACIS International Conference on Software Engineering, Artificial Intelligence, Networking, and Parallel/Distributed Computing, pages 556 561, 2007.
[10] A. Nayak and D. Samanta , “Automatic test data synthesis using UML sequence diagram ”, Journal of Object Technology,Volume-09, pp. 75-104, 2010.
[11] A. Abdurazik and J. Ofut, “Using UML Collaboration Diagrams for Static Checking and Test Generation ”, In the Proceedings of UML 2000 — The Unified Modeling Language, Springer Volume 1939 , pp 383-395 Date: 28 September 2001