K.Sivarami Reddy, B. Ramachandra, A. Srinivasulu, D. Srinivasula Reddy, N.V.S.Naidu*
Department of Chemistry, S.V.University, Tirupati, Andhra Pradesh, India.
*Corresponding author’s E-mail:[email protected]
Accepted on: 10-10-2014; Finalized on: 30-11-2014. ABSTRACT
A simple, precise and accurate HPLC method has been developed for the estimation of Lamivudine in pharmaceutical formulations. The chromatographic separation was achieved on Hypersil BDS C18, 150 X 4.6, 5µ analytical column. Mix buffer and acetonitrile used as the mobile phase in the ratio 60: 40 at a flow rate of 1.0 ml/min and detector wavelength at 274 nm. The validation of the method was accomplished for specificity, linearity, accuracy, precision; limit of detection (LOD), limit of quantification (LOQ) and robustness. The linear dynamic ranges were from 3.75–22.50µg/ml for Lamivudine. The percentage recovery obtained for Lamivudine was 98 to 102%. Limit of detection and quantification for Lamivudine was 0.477 and 1.4454 µg/ml. The method was validated for accuracy, precision, robustness, detection and quantification limits as for ICH guidelines. The wide linearity range, accuracy, sensitivity, short retention time and composition of the mobile phase indicate that this method was successfully applied to quantification of Lamivudine in pharmaceutical formulations.
Keywords: Development and validation, HPLC, Lamivudine.
INTRODUCTION
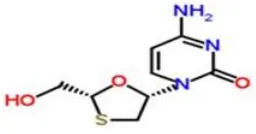
amivudine is synthetic nucleoside analogues with activity against human immuno deficiency virus (HIV)1 and form one of the first line regimens in HIV treatment as fixed dose combination.2 Fixed dose combinations (FDCs) become the mainstay in clinical management of HIV-1 infection as they offer several advantages over single products with respect to storage, prescribing, dispensing, patient use, consumption and disease management several drugs from various classes are combined to form FDCs. Formulation of an FDC being driven by therapeutic need, can result in combination of drugs with varying biopharmaceutical (solubility, permeability) and pharmacokinetic properties3 Lamivudine was initially developed for the treatment of HIV infection.4,5 The chemical name of Lamivudine is (2R, cis)-4-amino-1-(2-hydroxymethyl-1, 3-oxathiolan-5-yl)-(1H)-pyrimidin-2-one. Lamivudine is the (−) enan omer of 2ı- deoxy-3ı-thiacytidine, which is a nucleoside analog. The (−) enan omer of the racemic mixture shows much
less cytotoxicity than the positive enantiomer. Lamivudine (Figure 1) has very low cellular cytotoxicity and generally less potent than Zidovudine in inhibiting HIV-1 and HIV-2 replication in vitro.1,6,7 It is rapidly absorbed with bioavailability of approximately 80%. Literature survey reveals several methods that have been used for the quantitative determination of the two drugs individually, such as Spectrophotometry, HPLC.8,9 HPLC with tandem mass spectrometric detection10, radio-immunoassay,11 and etc. RP-HPLC method with solid phase extraction procedure has-been reported for simultaneous determination of six nucleoside analog reverse transcriptase inhibitors of which Lamivudine and Stavudine are a part12 Quantitative high-performance
liquid chromatography (HPLC)–UV assays to measure Zidovudine or Lamivudine in human plasma and urine have been well described in the literature.13–18
Figure 1: Structure of Lamivudine
Several immunoassays have also been developed to measure Zidovudine, including a commercially available radioimmunoassay kit, an enzyme-linked immuno- sorbent assay (ELISA) method, and a fluorescence polarization immunoassay.19–21 These immune assays allow for a smaller sample size, have greater sensitivity, and require less analysis time per sample than the HPLC– UV techniques. The radioimmunoassay kit has been used to measure Zidovudine in both blood and seminal plasma.22 However, until the recent development of a HPLC–tandem mass spectrometry (HPLC-MS–MS) method by Kenney et al.23, quantification of Lamivudine and Zidovudine required separate analyses, using HPLC–UV for Lamivudine quantification and an immunoassay for Zidovudine analysis. The HPLC–MS–MS technique has been shown to be a highly specific and sensitive method for the simultaneous measurement of both Zidovudine and Lamivudine in blood plasma. This paper described a validated HPLC method to measure Lamivudine concurrently in pharmaceutical formulations.
Development and Validation of HPLC Method for Estimation of Lamivudine in
Pharmaceutical formulations
L
MATERIALS AND METHODS
Chemicals
Lamivudine (99.69 %) was obtained from Chemipro Labs Hyderabad, India. Potassium dihydrogen orthophosphates (AR Grade) and acetonitrile (HPLC Grade) were purchased from E. Merck (India) Ltd. Worli, Mumbai, India. The 0.45 µg nylon filters were purchased from Advanced Micro Devices Pvt. Ltd. Chandigarh, India. Double distilled water was used throughout the experiment. In house film coated tablets containing Lamivudine 150 mg per tablet, were used for the study.
Equipments
Analysis was performed on a Waters HPLC 2 2695 series consisting 4 pump. Auto sampler with 5 racks, each has 24 vials holding capacity with temperature control. Auto
injector has capacity to inject 5µL to 500µL with UV-Vis Detector along with PDA. Thermostat column compartment connected to maintain 5°C to 60°C column temperature. Waters (alliance) HPLC System is equipped with Empower software 2 software.
Chromatographic conditions:
Column : Hypersil BDS C18, 150 X 4.6,
5µ.
Flow Rate : 1.0 ml/min
Wave length : 274 nm
Column temperature : 30°C
Injection volume : 20 µL
Diluent : Mobile Phase
Elution type : Isocratic
Needle wash solution : Water: Acetonitrile (90:10)
Mixed Phosphate Buffer preparation: 1.36 gms of Potassium dihydrogen orthophosphate and 0.6gms of di potassium hydrogen phosphate in 1000ml water, adjusted pH 3.0 with dilute orthophosphoric acid solution.
Mobile phase preparation
Mixed buffer and Acetonitrile at 60: 40 ratios were sonicated; the resulting solution was degassed using vacuum filtration through 0.4 micron membrane filter.
Standard and stock solutions and calibration graphs.
Weighed and transferred accurately about 15.0 mg of Lamivudine working standard to a 100 mL volumetric flask. Add 100 mL of diluent and sonicated to dissolve and diluted to volume with diluent. The diluent was a mixture of mixed buffer and acetonitrile at 60: 40 ratios. Transferred 10 mL of standard stock solution into 100 mL volumetric flask and diluted to volume with diluent. To study the linearity range of component, serial dilutions
3.75–22.50µg/ml of Lamivudine. Graph was plotted as concentration of drug versus peak area response. A mixed standard solution was prepared for the system suitability test. For the same, about 22.50 mg of Lamivudine working standard system suitability test was performed from five replicate injections of mixed standard solution.
Sample preparation
Sample was prepared, by selecting twenty tablets randomly and weighed and finely powdered. The average weight of the tablets was determined from the weight of 20 tablets. From the prepared sample, a portion of powder equivalent to the weight of one tablet was accurately weighed into 15.0 mg of Lamivudine in to 100 mL volumetric flask added 100 mL of diluent, sonicated to dissolve for 10 minutes and diluted to volume with diluent. Further filtered the solution through filter paper. Diluted 10 ml of filtrate to 100 ml with mobile phase in the volumetric flask. Finally, 20 microlitres of the prepared test solution was injected and chromatogram was recorded, and the amount of the drug was calculated.
Method Validation
The HPLC method was validated according to ICH guidelines in terms of precision, accuracy and linearity. Six independent test solutions were taken for determination of assay method precision. Evaluation of the accuracy of the assay method was done with the recovery of the standards. The LOD and LOQ for analyte were estimated by injecting a series of dilute solutions with known concentration. To determine the robustness of the method, the final experimental conditions were purposely altered and the results were examined.
RESULTS AND DISCUSSION
Optimization of the chromatographic conditions
Peak tailing is one of the well known problems in pharmaceutical industry during the analysis of Lamivudine drug. This is so because basic compounds strongly interact with polar ends of HPLC column packing materials, causing severe peak asymmetry and low separation efficiencies. The problem could be overcome to a great extent by using high purity silica backbone and advancement in bonding technology. The present method was optimized by tasted different columns and two solvents (buffer and acetonitrile). After a series of screening experiments, it was concluded that phosphate buffers gave better peak shapes. With acetonitrile as solvent the peak shows less theoretical plates and less retention time. The chromatographic separation was
achieved on a Hypersil BDS C18, 150 X 4.6, 5µ analytical
Validation of Method
Specificity
Solution Preparation
Standard
Weighed and transferred 15 mg of Lamivudine standard solution into 100 mL volumetric flask added 100 mL of diluent and sonicated to dissolved and diluted to volume with diluent. Further transferred 10 mL of above solution into 100 mL volumetric flask and diluted to volume with diluent. There were no interferences at the retention time of Lamivudine in the chromatogram of the placebo solution. The peak purity was analyzed with UV-V detector. This clearly indicates that the peak of analyte was pure. The chromatogram of Lamivudine as shown below
Figure 2: Chromatogram of Lamivudine
Accuracy
The accuracy of the test method is demonstrated by % of recovery. The sample preparations are spiked with known amount of standard at three concentration levels and each concentration is injected three times (Like 50% 100% and 150%). Acceptance criteria the % of recovery should be between 98 to 102% the values given in table -1.
Table 1: Results of the recovery (Accuracy-50%, 100% and
150%)
S. No. Area S. No. Area S. No. Area
Injection-1 365190
Injection-1 734379
Injection-1 1094832
Injection-2 364943
Injection-2 734405
Injection-2 1095468
Injection-3 364280
Injection-3 734676
Injection-3 1095909
Avg 364804 Avg 734487 Avg 1095403
amt
Recovered 49.53
amt
Recovered 99.75
amt
Recoverd 148.73 %
Recovery 99.07
%
Recovery 99.75
%
Recovery 99.16
Precision
System Precision and Method precision
Preparation of solution: Diluted 10 ml of standard stock solution with 100 mL of diluent. Injected the above solution six times.
Table 2: System precision
S. No. Name RT Area
1 Injection-1 2.645 729154
2 Injection-2 2.646 739157
3 Injection-3 2.642 729431
4 Injection-4 2.648 732657
5 Injection-5 2.649 746709
6 Injection-6 2.643 729918
Average 2.646 734504
Std Dev 0.003 7062.8
% RSD 0.104 0.96
Table 3: Method precision
S No Name RT Area
1 Injection-1 2.641 730254
2 Injection-2 2.643 734536
3 Injection-3 2.647 741055
4 Injection-4 2.649 746548
5 Injection-5 2.646 747290
6 Injection-6 2.649 743735
Avg
Std Dev 2.646 740570
% RSD 0.003 6840.7
Table 4: Intra-Inter day Precision
Name RT Area
Injection-1 2.641 730254
Injection-2 2.643 734536
Injection-3 2.647 741055
Injection-4 2.649 746548
Injection-5 2.646 747290
Injection-6 2.649 743735
Injection-7 2.639 724380
Injection-8 2.641 729022
Injectoion-9 2.641 730190
Injection-10 2.645 739914
Injection-11 2.647 741659
Injection-12 2.64 729955
AVG 2.644 736544.83
STDEV 0.00359 7728.719
Preparation of solution
Dilute 10 ml of standard stock solution, with 100 mL of diluent. Prepare six solutions and inject each solution.
Acceptance criteria: The % of RSD for Area and RT from Repeated injections should not be more than 2.0%.The precision of an analytical procedure may be defined as the closeness of agreement between a series of measurements obtained from multiple sampling of the same homogeneous sample under the prescribed conditions. The system precision is a measure of the method variability that can be expected for a given analyst performing the analysis and was determined by performing six replicate analyses of the same working solution. The relative standard deviation (R.S.D.) obtained for Lamivudine system precision, method precision were 0.96 and 0.92 %, respectively. The intra and inter-day precision data are given in Table -4. The intra-day precision of the developed HPLC method was determined by preparing the standard sample solution. The inter-day precision was also determined by assaying the tablets in triplicate per day for consecutive 3 days. The result clearly indicates a good precision of the developed method. System precision and method precision values are given in tables 2 and 3.
Linearity
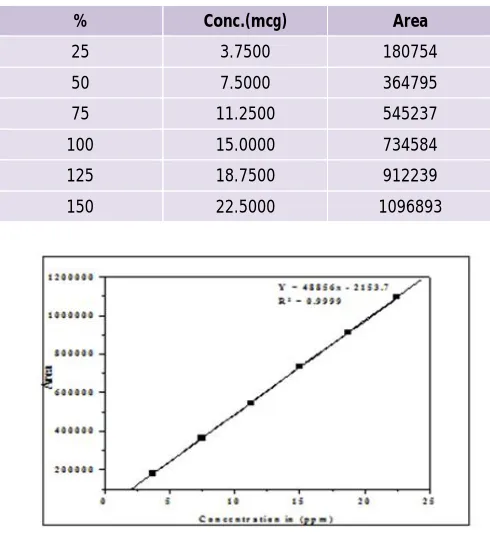
Linearity of Lamivudine was in the range of 3.75–22.50 µg/ml. The correlation coefficient (‘r2’) value for Lamivudine was "1". Typically, the regression equation for the calibration curve was found to be Lamivudine y =48856x – 2153.The linearity values are given in table -5 and the linearity curve as shown in figure 3.
Table 5: Linearity
% Conc.(mcg) Area
25 3.7500 180754
50 7.5000 364795
75 11.2500 545237
100 15.0000 734584
125 18.7500 912239
150 22.5000 1096893
Limit of detection (LOD) and limit of quantization (LOQ).Calibration curve method was used for the determination of LOD and LOQ of Lamivudine Solution of Lamivudine was prepared in the range of 3.75 µg/ml to 22.50 µg/ml and injected in triplicate. Average peak area of three analyses was plotted against concentration. LOD and LOQ were calculated by using following equation where “a” is standard deviation; “b" is slope. LOD and LOQ for Lamivudine were 0.477 and 1.4454µg/ml respectively.
Ruggedness
The ruggedness of test method is demonstrated by carrying out precision studies with different analysts and on different days.
Results for Lamivudine:
% of RSD on Day-1 & Day-2 RT = 0.14%
Area = 1.05%
Acceptance criteria: The % of RSD of areas from six injections should not be more than 2.0%
Robustness
The robustness of test method is demonstrated by carrying out intentional method variations like mobile phase flow changes, mobile phase compositions and column oven temperature variations etc… The result should show some variation from standard results. Acceptance criteria: The % of RSD of areas & RTs from repeated injections should not be more than 2.0 %.
Assay
Standard preparation
Transfer 10 ml of standard stock solution in to 100 mL volumetric flask and made up to volume with diluent.
Sample Preparation
Transfer sample quantitatively equivalent to 15 mg of Lamivudine in to 100 mL volumetric flask, added 100 mL of diluent, sonicated to dissolve for 10 minutes and diluted to volume with diluent. Further filtered the solution through filter paper. Diluted 10 ml of filtrate to
100 ml with mobile phase. Procedure: Injected 20 µL of
blank solution, standard solution and sample solution recorded the chromatogram and calculated percentage of assay. Assays result: Lamivudine = 100.14 %.
CONCLUSION
The HPLC method that has been developed and validated for quantitative determination of Lamivudine a new tablet formulation is found to be simple, specific, linear, precise, and accurate. The method can be regarded as simple and specific .Therefore this method can be successfully used for routine quality control analysis work.
REFERENCES
1. Chong KT, PJ Pagano, Antiviral Research, 34(1), 1997, 51-63.
2. Kayitare E, et al., International Journal of Pharmaceutics, 370(1-2), 2009, 41-46.
3. http://www.fda.gov, Guidance for Industry Fixed Dose Combination and Co-packaged Drug Products for treatment of HIV, 2004.
4. Kano EK, et al., International Journal of Pharmaceutics, 297(1-2), 2005, 73-79.
5. Bisset LR, et al., Antiviral Research, 53(1), 2002, 35-45. 6. Mulder JW, et al., Antiviral Research, 13(3), 1990, 127-138. 7. Von Kleist M, W Huisinga, European Journal of
Pharmaceutical Sciences, 36(4-5), 2009, 532-543.
8. Indian Pharmacopoeia 199(Addendum 2002) Govt. of India, Ministry of Health and Family Welfare, Controller of Publications, Delhi, 1996, 930–938.
9. Indian Pharmacopoeia 1996 (Addendum 2002) Govt. of India, Ministry of Health and Family Welfare, Controller of Publications, Delhi, 1996, 913.
10. D. Morris, K. Selinger, J. Pharm. Biomed. Anal., 12, 1994, 255–264.
11. S. Kaul, B. Stouffer, V. Mummaneni, N. Turabi, S. Mantha, P. Jayatilak, R. Barbhaiya, J. Pharm. Biomed. Anal., 15, 1996, 165–174.
12. N. Rezk, R. Tidwell, A. Kashuba, J. Chromatogr., B 791, 2003, 137–144.
13. DM Morris, K Selinger, J. Pharm. Biomed. Anal., 12, 1994, 255.
14. AJ Harker, GL Evans, AE Hawley, DM Morris, J. Chromatogr., B 657, 1994, 227.
15. XJ Zhou, JP Sommadossi, J. Chromatogr., B 691, 1997, 417– 424.
16. T. Toyoshima, S. Kimura, S. Muramatsu, H. Takahagi, K. Shimada, Anal. Biochem., 196, 1991, 302.
17. K. Peter, JP Lalezari, JG Gambertoglio, J. Pharm. Biomed. Anal., 14, 1996, 491.
18. N Frijus-Plessen, HC Michaelis, H Foth, GF Kahl, J. Chromatogr., 534, 1990, 101.
19. DJ Anderson, TR O’Brien, JA Politch, A Martinez, GR Seage III, N Padian, CR Horsburgh Jr., KH Mayer, JAMA, 267, 1992, 2769.
20. I Schrive, JC Plasse, J Chromatogr., B 657, 1994, 233. 21. GG Granich, MR Eveland, DJ Krogstad, Antimicrob Agents
Chemother., 33, 1989, 1275.
22. K Henry, BJ Chinnock, RP Quinn, CV Fletcher, P de Miranda, HH Balfour Jr, JAMA, 259, 1988, 3023.
23. KB Kenney, SA Wring, RM Carr, GN Wells, JA Dunn, J. Pharm. Biomed. Anal., in press.