Fission program at n_TOF
L. Tassan-Got1,2,3, N. Colonna4, M. Diakaki2, Z. Eleme5, A. Manna6,7, A. Sekhar8, A. Stamatopoulos2,O.Aberle1,V.Alcayne9,S.Amaducci10,11,J.Andrzejewski12,L.Audouin3, V.Babiano-Suarez13,M.Bacak1,14,15,M.Barbagallo1,4,S.Bennett8,E.Berthoumieux15,D. Bosnar16, A. S. Brown17, M. Busso18,19, M. Caamaño20, L. Caballero13, M. Calviani1, F. Calviño21,D.Cano-Ott9,A.Casanovas21, F.Cerutti1,E.Chiaveri1,8,G. P.Cortés21,M. A. Cortés-Giraldo22,L.Cosentino10,S.Cristallo18,23,L. A.Damone4,24,P. J.Davies8,M.Dietz25, C.Domingo-Pardo13,R.Dressler26,Q.Ducasse27,E. Dupont15,I.Durán20,B. Fernández-Domíngez20,A.Ferrari1,I.Ferro-Gonçalves28,P.Finocchiaro10,V.Furman29,R.Garg25,A. Gawlik12, S. Gilardoni1, K.Göbel30, E. González-Romero9, C. Guerrero22, F.Gunsing15, S.Heinitz26,J.Heyse31,D. G.Jenkins17,U.Jiri26,A.Junghans32,Y.Kadi1,F.Käppeler33, A. Kimura34, I. Knapová35, M. Kokkoris2, Y. Kopatch29, M. Krtiˇcka35, D. Kurtulgil30, I. Ladarescu13, C. Lederer-Woods25, J. Lerendegui-Marco22, S.-J. Lonsdale25, D. Macina1, T. Martínez9, A. Masi1, C.Massimi6,7, P. F.Mastinu36, M. Mastromarco1, E. Maugeri26, A. Mazzone4,37, E. Mendoza9, A. Mengoni38,6, V. Michalopoulou1,2, P. M. Milazzo39, M. A. Millán-Callado22, F. Mingrone1, J. Moreno-Soto15, A.Musumarra10,11, A.Negret40, F. Ogállar41,A.Oprea40,N.Patronis5,A.Pavlik42,J.Perkowski12,C.Petrone40,L.Piersanti18,23, E.Pirovano27, I.Porras41, J.Praena41, J. M.Quesada22,D.Ramos Doval3, R.Reifarth30, D. Rochman26, C. Rubbia1, M. Sabaté-Gilarte22,1, A. Saxena43, P. Schillebeeckx31, D. Schumann26, A. G. Smith8, N. Sosnin8, P. Sprung26, G. Tagliente4, J. L. Tain13, A. E. Tarifeño-Saldivia21, B. Thomas30, P. Torres-Sánchez41, A. Tsinganis1, S. Urlass1,32, S. Valenta35,G.Vannini6,7,V.Variale4,P.Vaz28,A.Ventura6,D.Vescovi18,44,V.Vlachoudis1, R.Vlastou2,A.Wallner45,P. J.Woods25,T. J.Wright8, andP.Žugec16
1European Organization for Nuclear Research (CERN), Switzerland
2National Technical University of Athens, Greece
3IPN, CNRS-IN2P3, Univ. Paris-Sud, Université Paris-Saclay, F-91406 Orsay Cedex,France
4Istituto Nazionale di Fisica Nucleare, Bari, Italy
5University of Ioannina, Greece
6Istituto Nazionale di Fisica Nucleare, Sezione di Bologna, Italy
7Dipartimento di Fisica e Astronomia, Università di Bologna, Italy
8University of Manchester, United Kingdom
9Centro de Investigaciones Energéticas Medioambientales y Tecnológicas (CIEMAT),Spain
10INFN Laboratori Nazionali del Sud, Catania, Italy
11Dipartimento di Fisica e Astronomia, Università di Catania, Italy
12University of Lodz, Poland
13Instituto de Física Corpuscular, CSIC - Universidad de Valencia, Spain
14Technische Universität Wien, Austria
15CEA Saclay, Irfu, Université Paris-Saclay, Gif-sur-Yvette, France
16Department of Physics, Faculty of Science, University of Zagreb, Croatia
17University of York, United Kingdom
18Istituto Nazionale di Fisica Nazionale, Perugia, Italy
19Dipartimento di Fisica e Geologia, Università di Perugia, Italy
20University of Santiago de Compostela, Spain
22Universidad de Sevilla, Spain
23Istituto Nazionale di Astrofisica - Osservatorio Astronomico d’Abruzzo, Italy
24Dipartimento di Fisica, Università degli Studi di Bari, Italy
25School of Physics and Astronomy, University of Edinburgh, United Kingdom
26Paul Scherrer Institut (PSI), Villigen, Switzerland
27Physikalisch-Technische Bundesanstalt (PTB), Bundesallee 100, 38116 Braunschweig, Germany
28Instituto Superior Técnico, Lisbon, Portugal
29Joint Institute for Nuclear Research (JINR), Dubna, Russia
30Goethe University Frankfurt, Germany
31European Commission, Joint Research Centre, Geel, Retieseweg 111, B-2440 Geel,Belgium
32Helmholtz-Zentrum Dresden-Rossendorf, Germany
33Karlsruhe Institute of Technology, Campus North, IKP, 76021 Karlsruhe, Germany
34Japan Atomic Energy Agency (JAEA), Tokai-mura, Japan
35Charles University, Prague, Czech Republic
36Istituto Nazionale di Fisica Nucleare, Sezione di Legnaro, Italy
37Consiglio Nazionale delle Ricerche, Bari, Italy
38Agenzia nazionale per le nuove tecnologie, l’energia e lo sviluppo economico sostenibile (ENEA),
Bologna, Italy
39Istituto Nazionale di Fisica Nazionale, Trieste, Italy
40Horia Hulubei National Institute of Physics and Nuclear Engineering (IFIN-HH),Bucharest
41University of Granada, Spain
42University of Vienna, Faculty of Physics, Vienna, Austria
43Bhabha Atomic Research Centre (BARC), India
44Gran Sasso Science Institute (GSSI), L’Aquila, Italy
45Australian National University, Canberra, Australia
Abstract.Since its start in 2001 the n_TOF collaboration developed a measure-ment program on fission, in view of advanced fuels in new generation reactors. A special effort was made on measurement of cross sections of actinides, ex-ploiting the peculiarity of the n_TOF neutron beam which spans a huge energy domain, from the thermal region up to GeV. Moreover fission fragment angu-lar distributions have also been measured. An overview of the cross section results achieved with different detectors is presented, including a discussion of the237Np case where discrepancies showed up between different detector sys-tems. The results on the anisotropy of the fission fragments and its implication on the mechanism of neutron absorption, and in applications, are also shown.
1 Introduction
The fission measurements at n_TOF have been carried out with different detection systems: ionisation chambers,µMegas detectors, parallel plate avalanche counters (PPAC). Although the cross section was the main topic, other quantities as the promptγemission and the angular distribution of fission fragments have also been measured. The scope of this presentation is to illustrate some of the measurements done recently.
2 The n_TOF facility
In 2014 a new experiment station EAR2, with a vertical flight path 20 m long, was also made available for experiments with low mass samples requesting higher neutron flux [4].
Figure 1 shows the neutron spectrum in each area, integrated over the neutron beam area. In the case of EAR1 the spot size is defined with a cylindical collimator of diameter 2 cm for capture and 8 cm for fission.
Figure 1: Flux integrated over the neutron beam spot defined by a cap-ture and a fission collimator in EAR1 and by a small collimator in EAR2.
Figure 2: Measurements performed in the 2002-2016 period, including radiative capture and fission in both areas [5].
The energy spectrum spans 11 order of magnitude, reaching 1 GeV in EAR1 and thermal energy in both areas. In the case of EAR1 a borated water moderator has been used for the capture measurements to reduce the photon background produced by capture in the water. This wide energy range is very suitable for fission measurements.
3 Measurements
An overview of the measurements performed in the period 2002-2016 is given in figure 2 [5]. A significant fraction of the program was dedicated to fission of actinides. In the latter case several types of detectors have been used: fast ionisation chamber (FIC), parallel plate avalanche counters (PPAC), micromegas detectors (µMegas) and the STEFF ensemble. They included samples covering entirely the neutron beam spot, defined in EAR1 by the large fis-sion collimator (8 cm in diameter), and the small collimator (≈3 cm) in EAR2. The FIC was used in EAR1 until 2004 for cross section measurements [6]. ThenceforthµMegas has been used.
In the following section we show examples of measurements performed in the last past years.
4 Excerpt of fission measurements
4.1 Fission of Pu isotopes withµMegas
The fission cross sections of240Pu (T
1/2=6.6 ky) and242Pu (T1/2=375 ky) have been mea-sured. 235U and238U samples were used as references for the accurate determination of the neutron flux using ENDF/B-VII.1.
Figure 3:µMegas detector for fission (left hand side) and stack of couples of sample/detector (right hand side).
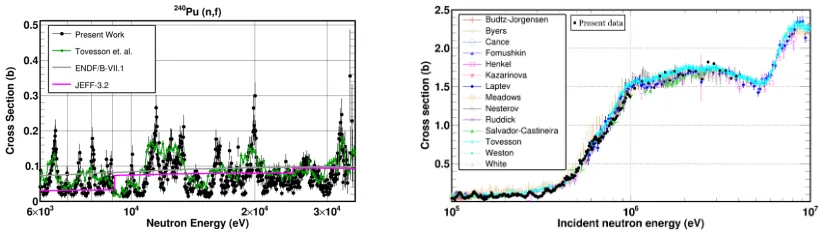
Figure 4: 242Pu(n,f) cross section in the resonance region (left hand side), and in threshold region (right hand side) [7]
In the resonance region (left hand side) the already reported resonances are found again, but shifted in energy and we recall that our energy determination is very accurate thanks to the long flight path. It is worth noticing that the evaluations stop the resolved resonance domain below 1.9 keV, although they could be extended at least up to 10 keV as the density of resonances is still low. In the threshold region up to the third chance opening (right hand side of the figure) the agreement with previous data and evaluations is good, although a slight overestimation shows up with respect to Tovesson’s data [9].
The240Pu measurement was one of the first experiments performed in EAR2. Figure 5 shows the results, in the 10 keV region (left hand side) and in the threshold region (right hand side). Compared to Tovesson’s data in the resonance region [9], the high energy resolution of the n_TOF facility is clearly visible. In the plateau above the threshold the data are consistent with Tovesson, the fluctuation is induced by the dead time correction which is significant in this domain due to the high neutron flux, and the sample mass.
4.2 γemission in fission with STEFF
The STEFF ensemble is made of arms equiped with Bragg chambers and fast detectors for measuring the time of flight of the fission fragments (figure 6), thereby allowing the applica-tion of the2v-2Emethod. STEFF was mounted in EAR2 with a large collimator to define a beam spot covering the 8 cm size of the sample made of a deposit of235U on a thin Al foil 0.7µm thick (figure 6) to allow the detection of the 2 fission fragments in 2 opposite arms. In coincidence with fission events in the Bragg chambers the NaI scintillators were recording the emittedγ’s [10].
Figure 6: Scheme of the STEFF ensemble (left hand side) showing the 2 horizontal arms terminated by Bragg chambers and the fast timing detectors for the time of flight measure-ment [10]. In green around the target, the NaI scintillators for detection of the photons emitted in fission. On the right hand side the235U target used in the experiment.
The recorded photon multiplicity and the sum energy distributions are shown figure 7. The left column displays the actually measured distributions. They are highly dependent on the detection efficiency which has to be corrected for. This is achieved by calculating the ma-trix response of the system by a Monte Carlo method. The mama-trix is inverted to get the emitted distributions which are displayed in the right column of figure 7. From those distributions the average multiplicity and energy sum can be obtained and displayed in table 1 in compari-son with previous measurements. Although previous measurements are done with thermal neutrons, STEFF data span the interval thermal-1eV. Theγenergy threshold is 160 keV for STEFF, higher than in previous measurements where it lies between 10 and 150 keV.
Figure 7: Distributions of multiplicity and total energy for γ emission in 235U(n,f). Left column: raw data (black) and result of a modelling (red). Right column: distributions after efficiency correction [10].
Table 1: Comparison of average mul-tiplicity and total energy with pre-vious experimental data. In STEFF (2017) the energy range of neutrons is thermal-1 eV.
Experiment <M> Etot(MeV) STEFF (2017) 6.3±0.2 9.0±0.1 DANCE (2015) 7.35±0.35 8.35±0.4 Oberstedt (2014) 8.19±0.11 6.92±0.09 Verbinski (1973) 6.70±0.30 6.51±0.30 Pleasonton (1972) 6.51±0.30 6.43±0.30 Peelle (1971) 7.45±0.35 7.18±0.26
4.3 The237Np(n,f) problem
The neutron-induced cross section of 237Np has already been measured at n_TOF with a PPAC system, over a broad energy range (0.7 eV to 1 GeV), giving values in average 7 % higher than the existing data and the evaluations (ENDF/B-VII.1 and JEFF3.1) [11]. Never-theless the insertion of this cross section in the simulation of a critial benchmark indicated that this higher cross section could not be ruled out [12].
Figure 8: Ensemble of PPAC detectors and samples tilted at 45◦in respect to the neutron beam.
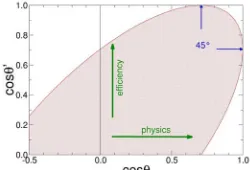
Figure 9: Mapping of the available angles cosθ relative to beam and cosθ0 to the normal to detectors.
The hatched area marks the geo-metrically available zone.
linear momentum above a few tens of MeV of incoming energy [14]. From the fission recon-struction the fission angle is extracted and the fission fragment angular distribution (FFAD) is obtained, in addition to the cross section. In a configuration where the detectors and samples are tilted by 45◦ relative to the beam, as sketched in figure 8, all fission angles can be
ac-cessible, and the detection efficiency is almost independent of the angular distribution. Most importantly this configuration makes possible a better control on the detection efficiency.
Any fission trajectory has an angleθrelative to the beam and an angleθ0relative to the normal to detectors and samples. The detection efficiency(cosθ0) depends only onθ0and
not on θ, whereas the angular distribution W(cosθ) depends only on θand not on θ0, so
that the number of detected fissions is: Nf = N W(cosθ)(cosθ0). The key point is that a
givenθcan be reached with a range ofθ0, having different azimuthal angleφ0, as illustrated in figure 9. The θ0 dependence of the counting just reflects the efficiency. The latter can
be obtained by pieces corresponding to differentθ. Knowing that the efficiency is 1 when the fragment trajectory is perpendicular to the detectors and samples, one gets the absolute detection efficiency as a function ofθ0.
Figure 10: Fit of the angle dependence of the efficiency for each sample. Three237Np samples are represented and one235U used as the cross section reference for determin-ing the neutron flux.
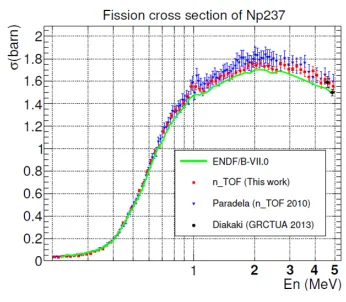
Figure 11: 237Np(n,f) cross section com-pared with the previous PPAC measure-ment [11], and ENDF/B-VII.0
The figure 10 shows fits of the efficiency dependence for the three237Np samples and the 235U sample used as reference. The dependences follow the expected shape, with a drop at
large angle due to the thicker dead layers (backing, electrodes) stopping the fission fragments. The three237Np samples are consistent with each other, and different from the235U sample, for which the integrated efficiency is lower. If this difference in efficiency is taken into ac-count the extracted237Np cross section is lowered as shown in figure 11 where it is compared to the older PPAC measurement and to ENDF/B-VII.0. The element dependence of the elec-troplating process is probably the reason of the efficiency difference, the uranium deposits having a rougher surface and being more loaded with oxygen atoms and water molecules, as diagnosed by Rutherford backscattering spectrometry (RBS). This elemental effect explains the higher cross section measured in [11], where the efficiency could not be extracted exper-imentally.
4.4 Fission angular distribution in232Th(n,f)
Figure 12: Fragment anisotropy for232Th(n,f) measured with the PPAC system (black solid points) compared to previous measurements. The blue line is a modelling from [15], and the turquoise one is the systematics of232Th(p,f) [16].
From the fission fragment angular distribution (FFAD) the anisotropy is defined as the ratio of the emission rate at 0◦ to that at 90◦. This anisotropy is plotted in figure 12 as a function of the energy of the incoming neutron. For the first time the anisotropy is measured between the fission threshold and 500 MeV. Below 10 MeV the agreement is very good with older data and at the third chance opening around 14 MeV the n_TOF data are more accurate due to the time of flight technique. Above 30 MeV the only existing data were obtained with a monoenergetic beam [17] and the anisotropy was found much higher than the n_TOF data. The FFAD is governed by the spin Jof the fissioning nucleus and its projectionKalong the fissioning axis [18]. When they are comparable the anisotropy is lower than 1 (sideward peaking), as seen in the 1.6 MeV region. If K J it is higher than 1 (backward-forward peaking). When the excitation at the saddle-point is more than a few MeV, many levels contribute to fission, so that K distributes statistically with an average: K0 =
p
Ie f fT/~2 where Ie f fis the moment of inertia and T the temperature. The lower K0 the higher the
anisotropy. The peak at every chance-fission opening is explained by the drop of K0 due to the temperature decrease after neutron emission. Similarly the lower anisotropy in case of proton-induced fission is explained by the lower barrier of the fissioning nucleus (higher fissility), so that the temperature at the saddle point is higher. The fading of the difference between proton- and neutron-induced at high energy is expected, as the incoming nucleons does not get absorbed anymore so that the fissioning nucleus is the same for both entrance channels. Conversely the difference below 30 MeV demonstrates that the incoming nucleus is essentially trapped.
A recent measurement up to 200 MeV [19] confirmed our results above 30 MeV, contra-dicting again [17], and in good agreement as well with modelling [15].
5 Conclusion
ele-mental composition of the sample on the detection efficiency in the case of the PPAC system. The fission fragment angular distribution gives important information on the fission mecha-nism. As neutrons in fission are essentally emitted by the fragments, this anisotropy induces also an anisotropy in neutron emission whose practical effects might not be negligible in some cases, such as small size critical benchmarks, and should be taken into account in simulations. The refurbishment of the spallation target, within the next two years, will provide an even higher flux in EAR2 with a better energy resolution. The ongoing developments in detectors electronics will also allow measurements to higher energies.
References
[1] C. Rubbia et al., Tech. rep., CERN (1998), CERN/LHC/98-002-EET [2] C. Borcea et al., Nucl. Instr. Meth. Res. A513, 524 (2003)
[3] n_TOF collaboration,CERN n_TOF facility: Performance report(2010), on-line access from http://cdsweb.cern.ch/collection/n_TOF%20Public%20Notes
[4] C. Weiß et al., Nucl. Instr. Meth. Res. A799, 90 (2015)
[5] F. Gunsing et al., The measurement programme at the neutron time-of-flight facility nTOF at CERN, inND2016 International Conference on Nuclear Data for Science and Technology 2016, Bruges, Belgium, 11-16 Sept 2016, edited by EPJ Web of Conferences (2017), Vol. 146, p. 11002, DOI: 10.1051/epjconf/201714611002
[6] F. Belloni et al., Eur. Phys. J. A47, 2 (2011), DOI: 10.1040/epja/i2011-11002-y [7] A. Tsinganis et al.,private communication
[8] A. Stamatopoulos et al., Measurement of the 240Pu(n,f) cross-section at the CERN n_TOF facility: First results from experimental area II (EAR-2), inND2016 Interna-tional Conference on Nuclear Data for Science and Technology 2016, Bruges, Belgium, 11-16 Sept 2016, edited by EPJ Web of Conferences (2017), Vol. 146, p. 04030, DOI: 10.1051/epjconf/2017146040030
[9] F. Tovesson et al., Phys. Rev. C79, 014613 (2009)
[10] J.A. Ryan, Ph.D. thesis, School of Physics and Astronomy, University of Manchester (2017)
[11] C. Paradela et al., Phys. Rev. C82, 034601 (2010) [12] L.S. Leong et al., Ann. Nucl. Energy54, 36 (2013)
[13] Diego Tarrío Vilas, Ph.D. thesis, PhD thesis, Universidade de Santiago de Compostela (2012)
[14] M. Fatyga et al., Phys. Rev. C32, 1496 (1985)
[15] I. Ryzhov et al., Nucl. Phys. A760, 19 (2005), EXFOR #22898232Th: .002,238U: .003 [16] A. Smirnov, I. Gorshkov, A. Prokofiev, V. Eismont,Total and differential cross sections
of 10 to 95 MeV proton-induced fission of actinide nuclei, in 21thInternational Sympo-sium on Nuclear Physics, Gaussig, Germany(1991), p. 214, EXFOR #O0606.013 [17] G.A. Tutin et al., Nucl. Instr. Meth. Res. A457, 646 (2001)
[18] R. Vandenbosch, J.R. Huizenga,Nuclear Fission(Academic Press, New York, 1973) [19] A.S. Vorobeyev et al.,Angular distributions and anisotropy of fission fragments from
![Figure 1:Flux integrated over theneutron beam spot defined by a cap-ture and a fission collimator in EAR1and by a small collimator in EAR2.Figure 2: Measurements performed in the 2002-2016period, including radiative capture and fission in bothareas [5].](https://thumb-us.123doks.com/thumbv2/123dok_us/8006366.1330397/3.482.62.417.127.253/integrated-theneutron-collimator-collimator-measurements-including-radiative-bothareas.webp)
![Figure 6: Scheme of the STEFF ensemble (left hand side) showing the 2 horizontal armsterminated by Bragg chambers and the fast timing detectors for the time of flight measure-ment [10]](https://thumb-us.123doks.com/thumbv2/123dok_us/8006366.1330397/5.482.63.475.258.430/figure-ensemble-horizontal-armsterminated-chambers-detectors-ight-measure.webp)