Volume 6, Issue 2 pp. 26-41
26
ECONOMIC GROWTH AND NONRENEWABLE RESOURCES: AN EMPIRICAL
INVESTIGATION
Amos James Ibrahim–Shwilima
Graduate School of Economics, Waseda University, Tokyo, Japan
Abstract
In this paper, we revisit the resource curse hypothesis by focusing on the period after 1990. The study uses both cross-sectional and panel data techniques on a sample of 103 countries for the period 1995–2010. We find no strong evidence of the resource curse, after controlling for other important determinants of economic growth. The results show that nonrenewable resources are positively associated with economic growth for the period under study. Additionally, we find that public institutions measured using an index of government effectiveness are of paramount importance to economic growth. This suggests that if a resource-rich economy needs a greater contribution from its resources, it should improve the quality of institutions.
Keywords: Growth, primary product exports, nonrenewable resources, institutions
1. INTRODUCTION
When discussing the resource curse, most economists tend to cite African and Latin American countries as examples, such as, among others, Nigeria, Angola, the Congo, Venezuela and Bolivia. The resource curse refers to the negative effects of resource dependence on economic growth. The work of Sachs and Warner (1995, 1997) made this phenomenon popular among resource economists. From 1970–1989, countries rich in natural resources tended to grow more slowly than countries without natural resources.
Sachs and Warner (1995, 1997) and their followers measure resource dependence as the share of primary product exports in gross domestic product (GDP). However, the measure of primary product exports excludes nonrenewable resources such as gold and diamonds, which are a significant omission for resource-rich countries; indeed, these precious stones represent the main exports of most Sub-Saharan African countries. Hence, in this study, we simultaneously use both measures (primary product exports and nonrenewable resource exports) to test the resource curse hypothesis.
As well as addressing the measurement issue, most researchers have extended the work of Sachs and Warner (1995, 1997) by either including more control variables or extending the sample period to earlier years. Our emphasis is on the economic structure of most countries after the 1990s.
The resource curse literature is based on the concept of the Dutch disease, which refers to a situation in which a discovery of natural resources shrinks the economy’s manufacturing sector and lowers its international competitiveness by raising the real exchange rate (Corden & Neary, 1982). The former is referred to as the resource movement effect that pulls resources from other sectors of the economy to the natural resource sector. This effect may not be prominent in developing countries because they have a shortage of all capital forms, both human and physical. If they want to extract their resources,
Corresponding author's
Email address:deuxamos2002@yahoo.com;aibrahim@fuji.waseda.jp
Asian Journal of Empirical Research
27
They need to import capital from abroad. Since the 1990s, most developing countries have reformed their economies, particularly the extractive sector, with the help of the World Bank (Onorato et al. 1998; World Bank, 1992,1996). This led to a flow of foreign investment in the extractive and other sectors of the economy (see Figures 1–4). For the period under study, the discovery of natural resources in developing countries was heavily associated with the flow of foreign capital rather than pulling capital from other sectors.
Apart from the Dutch disease channel, some literature associates slow growth in resource-rich countries with rent-seeking behavior (Leite & Weidmann, 1999; Mehlum et al., 2006). An economy where extraction is carried out by state-owned enterprises may suffer from rent-seeking behavior, while the introduction of private capital into the extractive sector may reduce or eliminate inefficiencies associated with rent-seeking. In fact, since the 1990s, multinational corporations have become key players in the extraction of developing countries’ natural resources. We consider that mining-sector reforms and the introduction of foreign capital make it worthwhile to revisit the resource curse phenomenon by focusing on the period after 1990.
In this paper, we first show that the share of nonrenewable resource exports in GDP have a positive and statistically significant effect on economic growth for the period after the 1990s, in sharp contrast to the literature analyzing the period before the 1990s. Second, we estimate the impact of institution quality on economic growth, distinguishing public institutions from private ones. We find public rather than private institutions to be of paramount importance to economic growth, unlike Kolstad (2009), who emphasizes the importance of the latter.
The rest of the paper is organized as follows. In Section 2, we review the literature. In Section 3, we explain the empirical approach and describe the data. In Section 4, we present and discuss the results. Section 5 presents a robustness check, and section 6 concludes the paper.
2. LITERATURE REVIEW
Sachs and Warner (1995, 1997) develop a useful empirical approach to address the impact of resource dependence on economic growth. Building on the Dutch disease literature, they devise the notion of the resource curse and conduct a cross-sectional empirical study for the period 1970–1989. Their findings show that resource-rich economies tend to grow more slowly than resource-poor economies.
How to measure resource dependence has been a controversial issue. Sachs and Warner (1995, 1997) use the share of primary-product exports in the GDP of 1971. Sachs and Warner (2001) also find that including or excluding agriculture in primary-product exports does not affect the results. Boschini et al. (2007), whose analysis covers the period 1975–1998, use various measures such as the share of mineral production in 1971 GNP, the value of gold, silver, and diamond production as a share of GDP, and the value of ore, metal and fuel exports as a share of 1975 GDP, to obtain results similar to Sachs and Warner's (1995, 1997). However, none of their measures comprise all nonrenewable resources of fuels, ores, metals, precious stones and nonmonetary gold.
Another important issue is the role played by institutions. Apart from the Dutch disease, institutional quality emerges as a main reason for natural resources’ negative effect on economic growth. Since Sachs and Warner (1995, 1997), empirical and theoretical studies have been conducted to explain the role of institutions. For instance, Robinson et al. (2006) and Mehlum et al. (2006) develop theoretical models to explain why institutions may be the cause of the resource curse. They argue that the resource curse is dominant in countries with weak institutions.
28
employment for supporters. This leads to misallocation of the resource rent, which adversely affects economic growth.
Mehlum et al. (2006), however, emphasize the role of private institutions because they protect the economy’s entrepreneurs. They argue that the rule of law shapes the behavior of entrepreneurs in a resource-rich economy. In their model, entrepreneurs choose to become either rent-seekers (“grabbers,” to use their term) or productive entrepreneurs. Weak institutions yield grabbers, whereas strong institutions foster productive entrepreneurs. They conclude that improving the quality of private institutions can eliminate the resource curse. Mehlum et al. (2006) also conduct an empirical study by extending Sachs and Warner's (1997) dataset to 1965–1990. They show that resource-rich countries can grow faster in the presence of good private institutions.
Most of the resource-rich developing countries, especially since the 1990s, have adopted policies intending to attract multinational corporations to the extractive sector and the general economy. Owing to such policy reforms, rent-seeking behavior seems to have gradually disappeared from these economies, improving the efficiency of resource use. Boschini et al. (2007) argue that institutions and the type of natural resources a country possesses are key determinants of whether it has a resource curse and show that exhaustible resources such as gold, diamonds and oil are likely to have a negative effect on economic growth in countries with weak institutions. Kolstad (2009), using Sachs and Warner's (1997) dataset, shows that only private institutions matter. In fact, most developing countries have been working to improve the quality of the rule of law, such as law enforcement and protection of private property rights, with the help of donors and international organizations since the 1990s. The initiatives aim to encourage private sector participation in the economy.1
3. EMPIRICAL APPROACH
3.1. Model
Following Sachs and Warner (1995, 1997), who develop the work of Barro and Sala-i-Martin (1995), we assume that the growth of economy j between periods t = 0and t = T (1995 and 2010, respectively) is a function of its initial income 𝑌0𝑗 and a vector of other factors, as follows:
1 𝑇 𝐿𝑜𝑔 [
𝑌𝑇𝑗 𝑌0𝑗
⁄ ]= 𝛽0+ 𝛽1𝐿𝑜𝑔𝑌0𝑗+ 𝛽′𝑋𝑗+ 𝑢𝑡,
where T is a time period, 𝑌𝑇𝑗is income at period T, 𝑋𝑗is a vector of other factors affecting growth in economy j, and 𝑢𝑡 is an idiosyncratic error term.
We investigate whether resource dependence has a significantly negative effect on economic growth for the period after the 1990s. We use two measures of resource dependence: the ratio of primary-product exports to 1996 GDP (prim96) and the ratio of nonrenewable resource exports to 1996 GDP (nonrenew96). The former follows the measure used by Sachs and Warner (1995, 1997). Primary product exports exclude exports of precious stones, nonmonetary gold, other metals and ore as reported by the United Nations Conference on Trade and Development (UNCTAD) (1997). Because many economies export precious stones such as diamonds, we use both measures simultaneously to determine the effect of resources on economic growth.
We are also interested in which type of institution has mattered most, private or public, since the 1990s. We use indicators of private and public institutions as regressors in the above regression equation.
29 3.2. Data
We have obtained a range of data for many economies from different sources. Data on the values of primary product exports and nonrenewable exports were obtained from the UNCTAD under the merchandise trade matrix category. The categories are detailed in Table 1.
Many organizations have developed indicators of countries’ institutional qualities. We use those reported by Kaufmann et al. (2009). Their advantages are twofold; they cover as many economies as we need, and they examine many factors, having developed several indicators of governance and institutional quality. Following previous researchers, we use the rule of law and government effectiveness as indicators of quality in private and public institutions, respectively. In Kaufmann et al. (2009), the rule of law is defined as “capturing perceptions of the extent to which agents have confidence in and abide by the rules of society, and in particular the quality of contract enforcement, property rights, the police, and the courts, as well as the likelihood of crime and violence.” Government effectiveness is defined as “capturing perceptions of the quality of public services, the quality of the civil service and the degree of its independence from political pressures, the quality of policy formulation and implementation, and the credibility of the government's commitment to such policies.”2
The choice of other control variables is based on the literature on economic growth, notably the work of Sala-i-Martin et al. (2004). They conduct a regression containing 67 variables to identify the determinants of long-run economic growth. Of these 67 variables, 18 have a strong effect on economic growth, with initial income and primary school enrollment being among the strongest. We use the initial values of most control variables in the sample period to eliminate or reduce the risk of reverse causality.
4. RESULTS AND DISCUSSION
We start our estimation using ordinary least squares (OLS) and following Sachs and Warner (1995). The results are reported in Table 2.
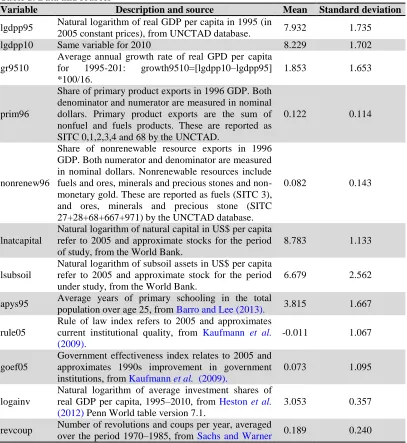
In Table 2, regressions 1 to 3 use the share of primary product exports in 1996 GDP as a measure of resource abundance. Holding all other variables constant, its increase is associated with a statistically insignificant decrease in growth. Indeed, as shown in regression 2, the coefficient is even more insignificant when we control for government effectiveness. Furthermore, regression 3, which controls for both institutional measures, the rule of law and government effectiveness, shows that only the latter is statistically significant. This suggests that having better public institutions (government effectiveness) was important for economic growth in 1995–2010.
Regarding the effects of institutions, our finding contrasts with that of Kolstad (2009), who finds that only private institutions (the rule of law) matter based on the sample period of 1970–1989. We like to argue as follows. In this period, many countries were closed and dominated by state enterprises, whereas in 1995–2010, more countries were open market economies, and most resource-rich countries negotiated contracts with foreign investors to provide assurance against government expropriation in the mining sectors. Such contract-based agreement with governments is a substitute for good quality in the rule of law. Following this thought, regression 3 shows that government effectiveness is of paramount importance to economic growth once the economy overcomes the negative effect of poor quality in the rule of law by enforceable agreement between governments and foreign investors.
Regressions 4 to 6 in Table 2 show the results obtained by changing the measure of resource dependence from primary product to nonrenewable resource exports. Similar to the previous results, government effectiveness has, on average, a positive effect on economic growth, even after controlling for the rule of law. More interesting is the effect of the share of nonrenewable resource
2
30
exports in GDP. The results show that a greater share of nonrenewable resource exports is associated with a statistically significant increase in economic growth; that is, for the period 1995–2010, countries with a higher export of nonrenewable resources grew faster.
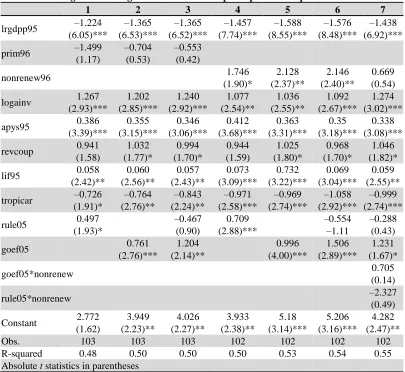
Of course, these results may not be free of criticism because the institutional variables are prone to the endogeneity problem. It is necessary to reconsider our OLS estimates by conducting IV estimation.Finding a desirable instrumental variable is always a challenge. Notably, Brunnschweiler and Bulte (2008) borrow latitude from La Porta et al. (1999) as an instrument for the institutions. Here, we use a similar variable because the dataset covers all countries in our sample3. The results, reported in Table 3, show that the IV estimation does not qualitatively change the results of the OLS estimation. That is, for the period under study, a higher share of nonrenewable resource exports in a country is associated with higher growth.
Our finding shows that the resource curse vanished after the 1990s, when most resource-rich developing countries implemented market-oriented economic reforms. The economic reforms are an important reason for the resource blessing observed here. The World Bank pioneered the economic reforms through its five specialized multilateral agencies, i.e. the International Center for the Settlement of Investment Disputes (ICSID), the Multilateral Investment Guarantee Agency (MIGA), the International Financial Corporation (IFC), the International Bank for Reconstruction and Development (IBRD) and the International Development Association (IDA). Each of these organizations played a significant role in supporting market-oriented reforms and their implementation.
Of interest is the role played by the IFC, MIGA and ICSID in supporting private capital, especially investors in the mineral sector. According to Onorato et al. (1998), the IFC “is a substantial financier of minerals projects in developing countries and acts as a catalyst for investment”. This implies that for the period under study, developing countries were able to solve the shortage of capital needed for extraction of their mineral resources. The authors note (p. 8) that “MIGA supports investment in mining and other projects by providing (a) guarantees (e.g., insurance) against the political (non-commercial) risks of transfer restriction, expropriation, breach of contract and war and civil disturbance; and (b) technical assistance to developing member countries to improve their ability to attract foreign investment”. In addition (p.7), the authors state, “ICSID provides facilities for the conciliation and arbitration of investment disputes between states who are parties to the Convention on Investment Disputes and nationals of other states”. This implies that the MIGA complements poor quality in the rule of law and that the ICSID acts as a tool to enforce contracts or agreements signed by government and foreign investors in the mining sector. Through this practice, developing economies were able to attract foreign capital to their extractive sector, which in turn facilitated the extraction of their mineral resources.
Another important reason is the economic development of China, which has stabilized the price of the main commodities, exported by resource-rich countries and increased the demand for those goods, as reported by Garnaut (2012) and Gonzalez-Vicente (2011), among others.
We also find that public institutions, measured by the index of government effectiveness, are of paramount importance to economic growth. The results in Table 2, regression 7, include an interaction term between nonrenewable resources and public institutions, which shows that the effect of public institutions does not depend on resource abundance. However, in Figure 5, we observe a negative relationship between the index of government effectiveness and the measure of resource dependence, and one can also notice that most resource-rich countries have poor quality public institutions.
3 Other potential instruments such as the fraction of the population speaking a Western language and settler
31
In light of the estimation results and observations, we can argue that resource-rich developing counties have much room to improve their public institutions, especially in relation to the mining contracts with multinational corporations. As discussed in the South African Resources Watch (2009), Gajigo et al. (2012), and Ibrahim-Shwilima and Konishi (2014), the tax concessions provided to firms in mining sectors have been too generous to allow the governments in resource-rich developing countries a fair share of the rents corporations capture and repatriate abroad. The resulting loss in tax revenue seems to cause a shortage in public funds for further economic growth in those countries.
4.1. Robustness check
Whereas the IV estimation results are reported in Tables 3 and 5, we conducted the Hausmantest to test the endogeneity of institutions because the resource curse literature always treats institutions as endogenous variables. The null hypothesis is that institutions are exogenous. The result shows that we cannot reject the null hypothesis, as it is standard in the resource curse literature. For example, Boschini et al. (2007) conduct a similar test and fail to reject the null hypothesis, though they report their IV results in addition.
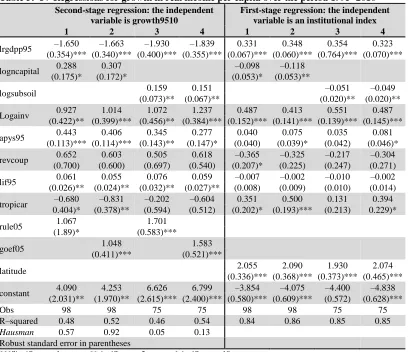
We also check the robustness of our results using an alternative measure of natural resources and a different estimation technique. As an alternative measure of natural resource abundance, we use the natural logarithm of total natural capital and subsoil assets in US$ per capita. The natural resource capital combines the estimates of subsoil assets, cropland, pastureland, timber, non-timber forest and protected areas, whereas the subsoil assets consist of the estimates of a country’s fuel and non-fuel mineral stocks (World Bank, 2006).
We use both OLS and IV estimations to reexamine our previous findings. Table 4 reports the OLS results, in which regressions 1 to 3 control the natural capital, and regressions 4 and 5 control the subsoil assets. Table 5 reports the IV estimation results, where we use latitude as an instrument for the institutions as in the previous IV estimation. In the first-stage regressions, both natural capital and subsoil assets have a significantly negative effect on the institutions. Of interest are the second-stage regressions; we find that the IV estimates strengthen our OLS estimates. In Table 5, we observe that the coefficient of subsoil asset is positive and statistically significant. This finding suggests that countries with high resource stocks of subsoil assets experienced a higher economic growth for the period under study.
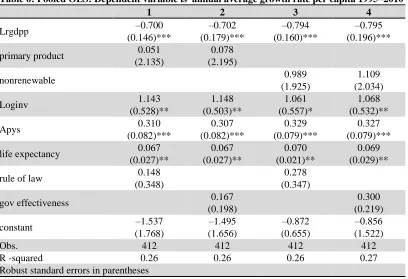
We also check the robustness of our results, following the estimation technique used by Boschini et al. (2012). They use the pooled OLS with time effects on panel data, which includes the lagged variables of dependent and independent variables. We choose to use a similar estimation technique with panel-corrected standard errors (Beck & Katz, 1995). As Boschini et al. (2012) mention, the use of pooled OLS addresses some important problems such as endogeneity and omitted variables. The inclusion of lagged dependent variables partially reduces the endogeneity problem, while the use of lagged values of growth accounts for the autoregressive property of growth, and time effects partially solve the problem of omitted variables.
The pooled OLS estimator with panel-corrected standard errors uses variations over both time and cross-sectional entities to estimate coefficients, permitting the error term in the model to be correlated (Cameron & Trivedi, 2010). Now, the regression equation makes growth in period t
depend on the same variables as above in t–1, includinglagged growth and time effects as additional independent variables, that is,
𝐺𝑟𝑜𝑤𝑡ℎ𝑗𝑡 = 𝛽1𝐿𝑜𝑔𝑌0,𝑡−1𝑗 + 𝛽′𝑋𝑗𝑡−1+ 𝑢𝑡.
32
this may be due to the lack of enough variations both within and between countries because few countries had good institutions turn bad in the period under study.
5. CONCLUSION
The prevailing economic structures of most resource-rich countries since the 1990s differ from those of the 1960s, 1970s and 1980s. We find that the share of nonrenewable resource exports was associated with positive economic growth for the period 1995–2010, in contrast to the existing empirical studies on the resource curse pioneered by Sachs and Warner (1995). We also find that public institutions—measured by an index of government effectiveness—were important for economic growth in this period, rather than private institutions, as emphasized in Kolstad (2009). Key factors underlying these differences are the market-oriented economic reforms in the 1990s and enforceable mining agreements between governments and multinational corporations in resource-rich developing countries. More studies covering the 1990s and later periods should be performed to provide sound and timely policy recommendations to policymakers.
Table 1: Data and sources
Variable Description and source Mean Standard deviation
lgdpp95 Natural logarithm of real GDP per capita in 1995 (in
2005 constant prices), from UNCTAD database. 7.932 1.735
lgdpp10 Same variable for 2010 8.229 1.702
gr9510
Average annual growth rate of real GPD per capita for 1995-201: growth9510=[lgdpp10–lgdpp95] *100/16.
1.853 1.653
prim96
Share of primary product exports in 1996 GDP. Both denominator and numerator are measured in nominal dollars. Primary product exports are the sum of nonfuel and fuels products. These are reported as SITC 0,1,2,3,4 and 68 by the UNCTAD.
0.122 0.114
nonrenew96
Share of nonrenewable resource exports in 1996 GDP. Both numerator and denominator are measured in nominal dollars. Nonrenewable resources include fuels and ores, minerals and precious stones and non-monetary gold. These are reported as fuels (SITC 3), and ores, minerals and precious stone (SITC 27+28+68+667+971) by the UNCTAD database.
0.082 0.143
lnatcapital
Natural logarithm of natural capital in US$ per capita refer to 2005 and approximate stocks for the period of study, from the World Bank.
8.783 1.133
lsubsoil
Natural logarithm of subsoil assets in US$ per capita refer to 2005 and approximate stock for the period under study, from the World Bank.
6.679 2.562
apys95 Average years of primary schooling in the total
population over age 25, from Barro and Lee (2013). 3.815 1.667
rule05
Rule of law index refers to 2005 and approximates current institutional quality, from Kaufmann et al. (2009).
-0.011 1.067
goef05
Government effectiveness index relates to 2005 and approximates 1990s improvement in government institutions, from Kaufmann et al. (2009).
0.073 1.095
logainv
Natural logarithm of average investment shares of real GDP per capita, 1995–2010, from Heston et al. (2012) Penn World table version 7.1.
3.053 0.357
revcoup Number of revolutions and coups per year, averaged
33 (1997).
lif95 Life expectancy at birth in 1995 from the World
Development Indicator. 65.539 11.157
tropicar Percentage of land area in geographical tropics from
Gallup et al. (2001). 0.517 0.474
latitude Absolute value of latitude of a country on a scale of
0–1. From La Porta et al. (1999). 0.385 0.267
Table 2: OLS regressions for growth in real income per capita for the period 1995–2010
1 2 3 4 5 6 7
lrgdpp95 –1.224 –1.365 –1.365 –1.457 –1.588 –1.576 –1.438 (6.05)*** (6.53)*** (6.52)*** (7.74)*** (8.55)*** (8.48)*** (6.92)***
prim96 –1.499 –0.704 –0.553 (1.17) (0.53) (0.42)
nonrenew96 1.746 2.128 2.146 0.669
(1.90)* (2.37)** (2.40)** (0.54)
logainv 1.267 1.202 1.240 1.077 1.036 1.092 1.274
(2.93)*** (2.85)*** (2.92)*** (2.54)** (2.55)** (2.67)*** (3.02)***
apys95 0.386 0.355 0.346 0.412 0.363 0.35 0.338
(3.39)*** (3.15)*** (3.06)*** (3.68)*** (3.31)*** (3.18)*** (3.08)***
revcoup 0.941 1.032 0.994 0.944 1.025 0.968 1.046
(1.58) (1.77)* (1.70)* (1.59) (1.80)* (1.70)* (1.82)*
lif95 0.058 0.060 0.057 0.073 0.732 0.069 0.059
(2.42)** (2.56)** (2.43)** (3.09)*** (3.22)*** (3.04)*** (2.55)**
tropicar –0.726 –0.764 –0.843 –0.971 –0.969 –1.058 –0.999 (1.91)* (2.76)** (2.24)** (2.58)*** (2.74)*** (2.92)*** (2.74)***
rule05 0.497 –0.467 0.709 –0.554 –0.288
(1.93)* (0.90) (2.88)*** –1.11 (0.43)
goef05 0.761 1.204 0.996 1.506 1.231
(2.76)*** (2.14)** (4.00)*** (2.89)*** (1.67)*
goef05*nonrenew 0.705
(0.14)
rule05*nonrenew –2.327
(0.49)
Constant 2.772 3.949 4.026 3.933 5.18 5.206 4.282
(1.62) (2.23)** (2.27)** (2.38)** (3.14)*** (3.16)*** (2.47)**
Obs. 103 103 103 102 102 102 102
R-squared 0.48 0.50 0.50 0.50 0.53 0.54 0.55
Absolute t statistics in parentheses
34
Table 3: IV Regressions for growth in real income per capita over the period 1995–2010 Second-stage regressions: independent
variable is growth9510
First-stage regressions: independent variable is an institutional index
1 2 3 4 1 2 3 4
lrgdpp95 –1.395 –1.414 –1.626 –1.626 0.367 0.390 0.321 0.331
(0.339)*** (0.337)*** (0.315)*** (0.295)*** (0.065)*** (0.054)*** (0.078)*** (0.079)***
prim96 –0.851 –0.486 –1.387 –1.819
(1.403) (1.469) (0.402)*** (0.352)***
nonrenew96 2.129 2.222 –0.657 –0.764
(1.173)* (1.071)** (0.558) (0.672)
logainv 1.111 1.167 0.913 1.007 0.550 0.489 0.535 0.466
(0.464)** (0.441)*** (0.405)** (0.371)*** (0.135)*** (0.116)*** (0.161)*** (0.155)***
apys95 0.368 0.348 0.386 0.354 0.039 0.063 0.052 0.083
(0.112)*** (0.113)*** (0.111)*** (0.111)*** (0.038) (0.033)* (0.039) (0.363)**
revcoup 1.130 1.077 1.156 1.065 –0.526 –0.467 –0.531 –0.464
(0.679)* (0.605)* (0.684)* (0.577)* (0.227)** (0.212)** (0.237)** (0.236)**
lif95 0.065 0.062 0.081 0.074 –0.018 –0.013 –0.015 –0.010
(0.030)** (0.029)** (0.030)*** (0.028)*** (0.008)* (0.008) (0.009) (0.010)
tropicar –0.607 –0.748 –0.780 –0.940 0.430 0.596 0.351 0.509
(0.409) (0.382)** (0.448)* (0.413)** (0.204)** (0.180)*** (0.208)* (196)***
rule05 0.865 1.119
(0.437)** (0.425)***
goef05 0.861 1.085
(0.426)** (0.394)***
latitude 1.937 1.947 2.025 2.089
(0.327)*** (0.340)*** (0.365)*** (0.397)***
constant 4.036 4.326 5.247 5.494 –4.298 –4.658 –4.167 –4.526
(2.192)* (2.210)** (1.963)** (1.883)*** (0.492)*** (0.483)*** (0.583)*** (0.596)***
Obs 103 103 102 102 103 103 102 102
R–squared 0.47 0.50 0.48 0.53 0.84 0.88 0.83 0.86
Hausman 0.43 0.82 0.36 0.82
Robust standard error in parentheses
***Significant at 1 percent, **significant at 5 percent, *significant at 10 percent
Note: The Hausman reports the p–values of the regression-based Hausman test
Table 4: OLS Regression for growth in real income per capita over the period 1995-2010, resource measured by per capita natural capital and subsoil assets
1 2 3 4 5
lrgdpp95 –1.536 –1.681 –1.671 –1.486 –1.563
(7.06)*** (7.81)*** (7.73)*** (6.26)*** (6.99)***
lnatcapital 0.246 0.314 0.315
(1.54) (2.01)** (2.01)**
lsubsoil 0.085 0.102
(1.34) (1.66)
logainv 1.007 1.005 1.042 1.474 1.452
(2.37)** (2.47)** (2.54)** (3.16)*** (3.27)***
apys95 0.457 0.404 0.394 0.425 0.362
(3.97)*** (3.58)*** (3.47)*** (3.47)*** (2.99)***
revcoup 0.567 0.615 0.589 0.338 0.452
(0.94) (1.06) (1.01) (0.54) (0.74)
lif95 0.059 0.056 0.054 0.065 0.058
(2.50)** (2.45)** (2.35)** (2.04)** (1.93)*
tropicar –0.793 –0.819 –0.881 –0.900 –0.928
35
rule05 0.817 –0.371 0.682
(3.17)*** (0.74) (2.29)**
goef05 1.086 1.421 0.91
(4.20)*** (2.71)*** (3.26)***
constant 3.444 4.357 4.331 3.115 4.234
(2.05)** (2.63)*** (2.61)** (1.55) (2.14)**
Obs. 98 98 98 75 75
R-squared 0.48 0.52 0.52 0.54 0.58
Absolute t statistics in parentheses
***Significant at 1 percent, **significant at 5 percent, *significant at 10 percent
Table 5: IV Regressions for growth in real income per capita over the period 1995–2010 Second-stage regression: the independent
variable is growth9510
First-stage regression: the independent variable is an institutional index
1 2 3 4 1 2 3 4
lrgdpp95 –1.650 –1.663 –1.930 –1.839 0.331 0.348 0.354 0.323
(0.354)*** (0.340)*** (0.400)*** (0.355)*** (0.067)*** (0.060)*** (0.764)*** (0.070)***
logncapital 0.288 0.307 –0.098 –0.118
(0.175)* (0.172)* (0.053)* (0.053)**
logsubsoil 0.159 0.151 –0.051 –0.049
(0.073)** (0.067)** (0.020)** (0.020)**
Logainv 0.927 1.014 1.072 1.237 0.487 0.413 0.551 0.487
(0.422)** (0.399)*** (0.456)** (0.384)*** (0.152)*** (0.141)*** (0.139)*** (0.145)***
apys95 0.443 0.406 0.345 0.277 0.040 0.075 0.035 0.081
(0.113)*** (0.114)*** (0.143)** (0.147)* (0.040) (0.039)* (0.042) (0.046)*
revcoup 0.652 0.603 0.505 0.618 –0.365 –0.325 –0.217 –0.304
(0.700) (0.600) (0.697) (0.540) (0.207)* (0.225) (0.247) (0.271)
lif95 0.061 0.055 0.076 0.059 –0.007 –0.002 –0.010 –0.002
(0.026)** (0.024)** (0.032)** (0.027)** (0.008) (0.009) (0.010) (0.014)
tropicar –0.680 –0.831 –0.202 –0.604 0.351 0.500 0.131 0.394
0.404)* (0.378)** (0.594) (0.512) (0.202)* (0.193)*** (0.213) 0.229)*
rule05 1.067 1.701
(1.89)* (0.583)***
goef05 1.048 1.583
(0.411)*** (0.521)***
latitude 2.055 2.090 1.930 2.074
(0.336)*** (0.368)*** (0.373)*** (0.465)***
constant 4.090 4.253 6.626 6.799 –3.854 –4.075 –4.400 –4.838
(2.031)** (1.970)** (2.615)*** (2.400)*** (0.580)*** (0.609)*** (0.572) (0.628)***
Obs 98 98 75 75 98 98 75 75
R–squared 0.48 0.52 0.46 0.54 0.84 0.86 0.85 0.85
Hausman 0.57 0.92 0.05 0.13
Robust standard error in parentheses
***Significant at 1 percent, **significant at 5 percent, *significant at 10 percent
36
Table 6: Pooled OLS: Dependent variable is annual average growth rate per capita 1995–2010
1 2 3 4
Lrgdpp –0.700 –0.702 –0.794 –0.795
(0.146)*** (0.179)*** (0.160)*** (0.196)***
primary product 0.051 0.078
(2.135) (2.195)
nonrenewable 0.989 1.109
(1.925) (2.034)
Loginv 1.143 1.148 1.061 1.068
(0.528)** (0.503)** (0.557)* (0.532)**
Apys 0.310 0.307 0.329 0.327
(0.082)*** (0.082)*** (0.079)*** (0.079)***
life expectancy 0.067 0.067 0.070 0.069
(0.027)** (0.027)** (0.021)** (0.029)**
rule of law 0.148 0.278
(0.348) (0.347)
gov effectiveness 0.167 0.300
(0.198) (0.219)
constant –1.537 –1.495 –0.872 –0.856
(1.768) (1.656) (0.655) (1.522)
Obs. 412 412 412 412
R -squared 0.26 0.26 0.26 0.27
Robust standard errors in parentheses
***Significant at 1 percent, **significant at 5 percent, *significant at 10 percent
Figure 1: Asian Economies
0.5
0.1
1.5
0.3 2.9
0.9
4.0
1.6
0.0 0.5 1.0 1.5 2.0 2.5 3.0 3.5 4.0 4.5
Eastern Asia Southern
Asia Eastern Asia South- WesternAsia
p
er
cent
age
of
G
D
P
Economies
37 Figure 2: Latin-American Economies
Figure 3: All Economies
Figure 4: African Economies Source: UNCTAD
Note: AFDI7089 and AFDI9009 are average flows of inward FDI as a percentage of GDP for the periods 1970– 1989 and 1990–2009, respectively.
2.7 0.8 0.7 21.5 2.4 2.4 0.0 5.0 10.0 15.0 20.0 25.0
Caribbean Central America South America
p er cent age of G D P Economies AFDI7089 AFDI9009 0.6 0.0 0.5 2.6 2.1 1.8 0.0 0.5 1.0 1.5 2.0 2.5 3.0 Developing
economies Transitioneconomies Developedeconomies
p er cent age of G D P Economies AFDI7089 AFDI9009 0.3 1.0 0.5 0.3 1.0 2.0 4.0 1.9 1.4 2.9 0.0 0.5 1.0 1.5 2.0 2.5 3.0 3.5 4.0 4.5 Eastern
Africa MiddleAfrica NorthernAfrica SouthernAfrica WesternAfrica
38
t-39
value= –2.66, and Adj. 𝑅2 = 0.07, and for the nonrenewable resources. 𝑦̂ = 0.24 − 1.94 × 𝑛𝑜𝑛𝑟𝑒𝑛𝑒𝑤96, with t-value=–1.98, and Adj. 𝑅2 =0.04.
Views and opinions expressed in this study are the views and opinions of the authors, Asian Journal of Empirical Research shall not be responsible or answerable for any loss, damage or liability etc. caused in relation to/arising out of the use of the content.
References
Arezki, R., & Van der Ploeg, R. (2007). Can the natural resource curse be turned into a blessing? The role of trade policies and institutions. IMF working paper 07/55.
Barro, R., & Lee, J. (2013). A new data set of educational attainment in the world, 1950–2010.
Journal of Development Economics, 104, 184–198.
Barro, R., & Sala-i-Martin, X. (1995). Economic growth. MacGraw-Hill, Inc: New York.
Beck, N., & Katz, N. J. (1995). What to do (and not to do) with time-series cross-section data. The American Political Science Review, 89(3), 634–647.
Boschini, A. D., Pettersson, J., & Roine, J. (2007). Resource curse or not: A question of appropriability. Scandinavian Journal of Economics, 109(3), 593–617.
Boschini, A., Pettersson, J., & Roine, J., (2012). The curse and its potential reversal. World Development, 43, 19–41.
Brunnschweiler, C. N., & Bulte, E. H. (2008). The resource curse revisited and revised: A tale of paradoxes and red herrings. Journal of Economics and Management, 55, 248–264.
Cameron, C. A., & Trivedi, K. P. (2010). Microeconometrics using Stata. revised edition, Stata press: United State of America.
Corden, W. M., & Neary, P. J. (1982). Booming sector and de-industrialization in a small open economy. The Economic Journal, 92(368), 825–848.
Gajigo, O., Mutambatsere, E., & Ndiaye, G. (2012).Gold mining in Africa: Maximizing economic returns for countries. Working Paper Series, number. 147. Tunis: African Development Bank. Gallup, J.L., Mellinger, A., & Sachs, J. D. (2001). Geography datasets. Center for International
Development at Harvard University.
Garnaut, R. (2012). The contemporary China resources boom. The Australian Journal of Agricultural and Resource Economics, 56, 222–243.
Gonzalez-Vicente, R. (2011). China’s engagement in South America and African’s extractive sectors: New perspectives for resource curse theories. The Pacific Review, 24(1), 65-87. Heston, A., Summers, R., & Aten, B. (2012).Penn world table version 7.1. Center for International
Comparison of Production, Income and Prices at the University of Pennsylvania.
Ibrahim-Shwilima, A. J., & Konishi, H. (2014). The impact of tax concessions on extraction of non-renewable resources: An application to gold mining in Tanzania. Journal of Natural Resources Policy Research, 6(4), 221–232.
Kaufmann, D., Kraay, A., & Mastruzzi, M. (2009). Governance matters VIII; Aggregate and individual governance indicators 1996–2008. The World Bank Policy Research Working Paper number 4978.
Kolstad, I. (2009). The resource curse: Which institutions matter?. Applied Economics Letters, 16(4), 439–442.
Kolstad, I., & Soreide, T. (2009). Corruption in natural resource management: Implications for policy makers, Resources Policy, 34, 214–226.
La Porta, R., Lopez-de-Silanes, F., Shleifer, A., & Vishny, R. (1999). The quality of government.
Journal of law, Economics and Organization, 15, 222–278.
Leite, C., & Weidmann, J. (1999). Does mother nature corrupt? Natural resources, corruption and economic growth. Interantional Monetary Fund, WP/99/85.
Mehlum, H., Moene, K., & Torvik, R. (2006). Institutions and the resource curse. The Economic Journal, 116(508), 1–20.
40
Petermann, A., Guzman, J. I., & Tilton, J. E. (2007). Mining and corruption. Resource Policy, 32, 91–103.
Robinson, J. A., Torvik, R., & Verdier, T. (2006). Political foundations of the resource curse.
Journal of Development Economics, 79, 449–468.
Sachs, J. D., & Warner, A. M. (1995). Natural resource abundance and economic growth. NBER working paper 5398.
Sachs, J. D., & Warner, A. M. (1997). Natural resource abundance and economic growth – revised version. working paper, Harvard University.
Sachs, J. D., & Warner, A. M. (2001). Natural resources and economic development: The curse of natural resources. European Economic Review, 45, 827–838.
Sala-i-Martin, X., & Subramanian, A. (2003). Addressing the natural resource curse: An illustration from Nigeria. NBER working paper 9804.
Sala-i-Martin, X., Doppelhofer, G., & Miller, I. R. (2004). Determinants of long-term growth: A Bayesian averaging of classical estimates (BACE) approach. American Economic Review, 94(4), 813–835.
South African Resources Watch (2009). Breaking the curse: How transparent taxation and fair taxes can turn Africa’s mineral wealth into development. Johannesburg: Open Society Institute of Southern Africa.
United Nations Conference on Trade and Development (1997). Handbook of International Trade and Development Statistics. New York and Geneva: United Nations.
World Bank (1992). Strategy for African Mining. WB Technical Paper No. 181, Mining Unit, Industry and Energy Division, Africa Technical Department Series.
World Bank (1996). A mining strategy for Latin America and the Caribbean. Industry and Mining Division, Industry and Energy Department, the World Bank Technical Paper No. 345.
World Bank (2006).Where is the wealth of nations: Measuring capital for the 21st century. The
41 Appendix 1: Countries in our sample
Algeria Mexico Finland
Benin Nicaragua France
Botswana Panama Germany
Burundi Trinidad and Tobago Greece
Cameroon US Hungary
Central Afr. Re Argentina Iceland
Congo Bolivia Ireland
Egypt Brazil Italy
Gabon Chile Luxembourg
Gambia Colombia Netherland
Ghana Ecuador Norway
Cote d'Ivoire Guyana Poland
Kenya Paraguay Portugal
Lesotho Peru Spain
Liberia Uruguay Sweden
Malawi Venezuela Switzerland
Mali Bangladesh Turkey
Mauritania China UK
Morocco India Australia
Mozambique Indonesia New Zealand
Niger Iran Papua N. Guinea
Rwanda Iraq
Senegal Israel
Sierra Leone Japan
South Africa Jordan
Swaziland Korea, Rep.
Tanzania Kuwait
Togo Malaysia
Tunisia Nepal
Uganda Pakistan
Zaire Philippines
Zambia Saudi Arabia
Zimbabwe Sri-Lanka
Canada Syria
Costa Rica Thailand
Dominican Republic United Arab Emirates
El Salvador Yemen
Guatemala Austria
Haiti Belgium
Honduras Cyprus