a
Corresponding author: [email protected]
On the effect of segregation on intense bimodal bed load
Štpán Zrostlíka and Václav Matoušek
Department of Hydraulics and Hydrology, Civil Engineering, Czech Technical University in Prague, 166 29 Prague 6, Czech Republic
Abstract. Open-channel two-phase flow above a granular mobile bed is studied experimentally and theoretically. In the two-phase flow, water serves as a carrying liquid for plastic grains transported as collisional contact load in the upper-stage plane bed regime. The investigation evaluates friction- and transport characteristics of the flow under the condition of intense collisional transport of grains and links them with the internal structure of the two-phase flow. The paper focusses on the effect of bimodal solids (mixed two fractions of grains of similar density and different size and shape) on the flow characteristics and internal structure. Hence, experimental results obtained for the bimodal mixture are compared with results for individual grain fractions. The experiments show that the bimodal character of the transported solids affects the layered internal structure of the flow as a result of fraction segregation due primarily to gravity (kinetic) sieving during transport. The segregation also affects the friction- and transport characteristics of intense bed load. In the paper, the effects are described and quantified.
1 Introduction
In natural hazard management of rivers and streams, sediment transport is one of the key elements to assess. It has direct consequences for morphology and stability of river channels and is responsible for infrastructural damages caused by extreme flood events [1].
Natural sediment forming a river bed and being transported during flood events is composed of grains of different sizes. The composition of bed material is described by the grain size distribution (GSD). Mobility of grains of different sizes is different in flood flow and the interaction of different grains with each other and with the flowing liquid is a complex process difficult to describe physically [2]. As a first step in investigating the complex process of size-affected granular interactions, some authors study transport of bimodal sediments (sediments composed of two grain fractions of two different sizes) [1,3]. Vertical sorting of the grain fractions is typical for transport of bimodal sediments. In river engineering, the vertical sorting is usually associated with armouring of a channel bed. The mechanisms governing erosion of finer grains from the bed and resulting armouring of the bed surface have been described by numerous authors, e.g. [2,4], and the phenomena are modelled in contemporary river morphology software tools, for instance HEC-RAS. The erosion/armouring phenomena preferably occur at bed shear conditions suitable for a development of bed forms (particularly dunes).
However, little attention has been paid to vertical sorting in the upper plane bed (UPB) regime typical for extreme flood events. In the UPB regime, there are no bed forms
and the stationary armor layer is replaced by a mobile transport layer dominated by interparticle collisions. The vertical sorting in the collision-dominated granular flows can be modelled using the kinetic theory of granular flows [5] but the modelling and its experimental verification has been done for dry granular flows only. Our previous work on aqueous monodisperse flows showed that the UPB flows stratified into layers, which affected velocity distribution, flow friction and sediment transport. In this work, we discuss how a bimodal character of sediment affects the flow stratification and the associated flow properties. The discussion is based on own experiments in a tilting flume.
2 Methods
2.1 Experimental work
Tests were carried out for different installed conditions of steady-state uniform flow in the upper plane bed regime. First, experiments were carried out with individual monodisperse sediment fractions separately and then bimodal sediment was tested composed of the previously tested sediment fractions. Both fractions were plastic grains of similar density and different size and shape. They also differed in colour to make visual observations of the individual fractions in the bimodal mixture more recognisable. Properties of the fractions and the bimodal sediment are summarized in Table 1. Plastic grains of the finer fraction (Hostaform, HSF3) are white, its shape is ellipsoidal, the equivalent sphere diameter de = 3.18 mm and the density s = 1359 kg.m-3. Plastic grains of the coarser fraction (Tiulit, TLT50) are black and of a cylindrical shape with the equivalent diameter
de = 5.41 mm and the density s = 1307 kg.m-3.
Bimodal sediment (HT = TLT50 + HSF30) was mixed of the same volumes of the individual fractions and so loaded to the flume recirculating system. In order to manage as uniform as possible distribution of the individual fractions along the system, the mixture of water and bimodal sediment was circulated at high velocity through the system before each test run. After grains of both fractions were sufficiently suspended and mixed, the discharge of mixture, Q, was set to a required value for the test. Uniform flow with flow depth, h, above deposit developed in the flume. Grains of both fractions were well mixed and proportionally represented in the deposit. Segregation of grains started to be visible at the top of the deposit in a few minutes.
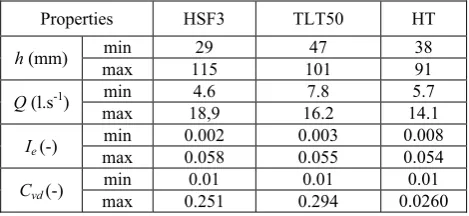
Table 1. Properties of sediments
Properties HSF3 TLT50 HT
de (mm) 3.18 5.41
vt (m.s-1) 0.131 0.149 0.140
s (kg . m-3) 1359 1307 1333
Percentage of
HSF3 in sample 100 0
approx 32
Table 2. Range of values of integral parameters of flow
Properties HSF3 TLT50 HT
h (mm) min 29 47 38
max 115 101 91
Q (l.s-1) min 4.6 7.8 5.7
max 18,9 16.2 14.1
Ie (-)
min 0.002 0.003 0.008
max 0.058 0.055 0.054
Cvd (-)
min 0.01 0.01 0.01
max 0.251 0.294 0.0260
Test runs were carried out within a broad range of flow conditions (see Table 2). As a proportion of the individual fractions in the bimodal sediment could vary for different flow conditions it was necessary to determine the proportion for each test by sampling the
sieving the transported bimodal sediment. The proportion influenced calculated representative grain size, density, and settling velocity of the bimodal sediment. Values of the density s and the terminal settling velocity vt were calculated as the normal arithmetic mean. The characteristic grain size was determined as the effective mean diameter, dm, from the GSD of sediment fraction,
/
' '
¦
¦
m i i i
d d p p where di is the diameter of sieve
opening and pi denotes the weight percentage of
particles passed.
2.2 Measuring instruments
Standard measuring instruments were used to measure integral parameters of the flow (depth, discharge, slope, delivered concentration) and they are described elsewhere [6-7]. We used three different measurement techniques to measure a vertical velocity profile of the longitudinal component of the velocity in the axis of the flume. The Prandtl probe (PT) was used primarily to validate velocity profiles obtained from the other methods. A sensitivity of PT is limited with a minimal value near 1 cm.s-1. Two others methods were acoustic: the ultrasonic velocity profiler (UVP) with a probe directed opposite to the flow and Acoustic Doppler Velocity Profiler (ADVP) with a probe oriented downwards. A disadvantage of the UVP method in this particular application is that particles are in sporadic contact with the measuring membrane of the probe
.
The great advantage of ADVP is that it is non-invasive and does not disturb flow in the transport layer. Also velocity measuring instruments are described in more details elsewhere [6-7, 9].An estimation of measuring errors of individual instruments is given in [6]. Processing of measured data is described in [6-7, 9].
2.3 Observation of development of flow
structure
We investigate a development of a layered structure of flow with bimodal contact-load sediment in the UPB regime. Our previous work on aqueous monodisperse flows showed that the UPB flows stratified into three layers [6-9]. The uppermost layer contained clear water and occasionally saltating particles. The bottom layer was formed by stationary bed deposit. The transport layer developed between the water layer and the deposit layer. A vast majority of sediment was transported in a collisional mode through the transport layer. The layer of smaller particles was observed at interface between deposit and transport layers during experiment with mixtures.
lower part of the transport layer. The interfacial layer itself could be split into two sublayers. The upper sublayer contained moving particles while the lower sublayer did not move. The interface between the deposit and the transport layer was always within the white layer of finer particles.
The observed pattern seems to support the picture of the process of two-size grain segregation as sensitive to the grain size ratio [1]. If the ratio is high, finer grains are smaller than voids among coarse particles and the fines naturally settle no matter what the nature of interaction is among the coarser grains. Otherwise, the finer grains are too big to settle naturally through the voids and they percolate down only through spaces which open and close due to collisions among the coarser grains in sheet flow. This results in vertical sorting in which the finer grains move down and the coarser grains migrate deeper into the transport layer as they are squeezed up by the finer ones. It seems that this mechanism is responsible for a development of the interfacial layer observed in our bimodal sediment flows.
Figure 1. Scheme of layered structure of flow in upper plane bed regime
Figure 2. Photograph of flow in upper plane bed regime shows distribution of grains of bimodal sediment (black – coarser grains, white – finer grains). Legend: white solid lines – boundaries of interfacial layer, black dashed line – top of stationary deposit, white dashed line – top of transport layer.
2.4 Description of velocity distribution
Our earlier work [6-9] also shows that a vertical distribution of local longitudinal velocities is influenced by the flow stratification. Basically, a velocity profile can
be considered as composed from a linear part in the transport layer and a logarithmic part in the layer with clear water (Figure 1).
The logarithmic part of a velocity profile can be described using the logarithmic law of the wall [6],
* 2.5ln
ini
s b
y y
u
B k u
§ · ¨ ¸
© ¹
(1)
where u is longitudinal velocity at vertical position y, ub*
is the bottom shear velocity, yini is position of origin of
logarithmic profile, ksis the boundary roughness and B is
an integration constant for open channel flow (B = 30). The velocity distribution is linear in the transport layer and it can be described by following equation [6],
n
tr tr
u y y
u y y
§ ' · ¨ ' ¸
© ¹
(2)
where ytr is vertical position, at which a profile smoothly
transforms its shape from linear to logarithmic, utr is
velocity at position ytr, y is initial position of linear
profile and n is an exponent (n=1).
Taking the above assumptions into account, an optimization procedure is carried out on measured velocity profiles with as a result values for five velocity-profile-associated parameters (ub*, yini, ks, ytr, y). The
key results for the bimodal sediments are discussed in chapter 4.
3 Evaluation of integral data
Integral quantities of sediment laden flows are mutually compared for flows of individual fractions (HSF3 and TLT50) and for the mixture of the two fractions (HT). In plots, they are related to the dimensionless form of the bed shear velocity u* defined as
* b e
u g R I (3)
in which Rbis hydraulic radius associated with bed, g is
gravitation acceleration and Ie is slope of energy grade
line of flow. The dimensionless form is called Shields parameter, . For the form of the parameter we use in our evaluations, see [6-9]. Fore individual grain fractions, the equivalent diameter of grain, de, is used to calculate the
Shields parameter. For bimodal sediments, the effective mean diameter, dm, is used.
3.1 Quantification of distribution of fractions in bimodal mixture
part and the sliding part has on bed friction and transport of sediment. Before we discuss this, it is important to determine how proportionally the two fractions are distributed in the flowing bimodal mixture.
Figure 3. Number of layers of finer grains at interface between deposit and transport layer. Legend: green circles – sliding layers, black crosses – stationary layers.
Figure 4 shows the results of mixture sampling at the flume outlet. At the highest Shields parameters, the proportion of the finer fraction (HSF3) is approximately constant (about 32 per cent by weight, meaning that 68 per cent of the total weight of the sampled sediment is due to the coarser grains). At the lowest Shields parameters, virtually no fines are transported and transport of the coarser fraction dominates.
Figure 4. Weight percentage of finer fraction (HSF3) in sample of transported bimodal sediment
Figure 5. Mean diameter of sample of transported bimodal sediment
In Figure 5, the same effect is expressed using the variation of the mean diameter of the transported bimodal sediment with the Shields number. The plot confirms that the proportion of the fractions in the mixture remains constant for Shields parameters bigger than say one.
3.2 Discharges of sediment and mixture
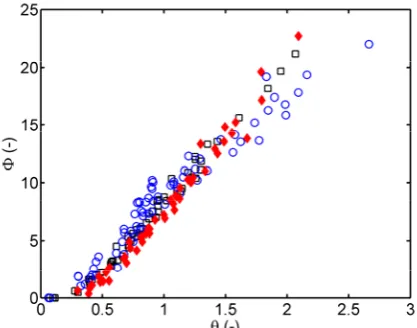
In our previous work, we used a modified Meyer-Peter and Müller (MPM) formula to compare measured discharges of sediment with predictions. The MPM formula relates the dimensionless discharge of sediment (called Einstein parameter) to the Shields parameter. In Figure 6, plots of the Einstein parameter, , for individual fractions and the bimodal sediment exhibit very similar values except for very high Shields parameters. At very high bed shear, where the transport is intense, the coarse TLT5 is more mobile than the finer HSF3. The bimodal sediment exhibits the same mobility as the coarse fraction alone.
Figure 6. Dimensionless discharge of sediment versus Shields parameter. Legend: blue cylinders HSF3, black squares -TLT50, red full diamonds – HT.
In order to relate the sediment discharge with the discharge of mixture (water+sediment), we employ the volumetric delivered concentration, Cvd, which is defined
as a ratio of the two discharges. Figure 7 relates Cvd with
grains in the transport layer actually stabilize the layer and prevent the plane bed from undulation (transition to wavy regime) which occurs earlier if the layer contains only finer grains.
Figure 7. Range of experimental values of delivered concentration and specific discharge of mixture in upper plane bed regime. Legend: blue cylinders HSF3, black squares -TLT50, red full diamonds – HT.
Also associated with the discharge of mixture is Froude number, Frb, defined as
b
b U Fr
g R (4)
in which U = mean velocity of mixture. In [6-7], we discussed its relationship with the Shields parameter which exhibit a special shape with a maximum value of
Frb reached at the Shields parameter value of about one
and with a drop in Frb values at higher Shields
parameters. We identified the left-hand side of the plot below the threshold 1 as the region of weak transport and the right-hand side above the threshold as the region of intense transport. Figure 8 shows this shape for flows of both individual fractions and reveals that for bimodal sediment the maximum reached but no drop is observed in the region of intense transport.
Figure 8. Froude number versus to Shields parameter. Legend: blue cylinders - HSF3, black squares - TLT50, red full diamonds – HT.
The absence of the Frb drop with the increasing at
intense transport of bimodal sediment may indicate lower bed resistance in bimodal flow than in flows of individual fractions. The drop is due primarily to the increase in the flow depth caused by increased resistance at more intense transport of sediment. If the drop is not there, than the increase of the flow depth is not there because the bed resistance is not high enough.
3.3 Bed resistance
The overall parameter expressing the bed resistance is the friction coefficient of the bed, . It is defined as
2
8 g R Ib e U
O (5)
and can be determined from our measured integral parameters of flow. Plotted in Figure 9 the coefficient is indeed smaller for bimodal flow than for flows of individual fractions at the condition of very intense transport associated with values of Shields parameter higher than the threshold value.
Figure 9. Darcy-Weisbach friction coefficient of bed versus Shields parameter. Legend: blue cylinders - HSF3, black squares - TLT50, red full diamonds – HT.
Figure 10 shows the same experimental results expressed as the bed roughness ks for the logarithmic law of the
wall. It demonstrates that the bed roughness considerably increases with the Shields parameter if exceeds the threshold value of one due to the influence of the intense transport of collisional contact load on the bed resistance. For some reasons, the increase is the modest for the bimodal flow.
We assume a link between the observed smaller resistance of the bed and the presence of the interfacial layer in bimodal flows. Camera records and measurements of velocity profiles must be employed to identify possible reasons for the smaller resistance, e.g. for smoothening of the bed surface in bimodal flows.
4
Evaluation of video records and
velocity distribution measurements
4.1 Video records
Each test run was recorded by a standard low-speed video camera located near a glass side wall of the flume. The record took about 10 second and contained frames capturing the entire depth and the width of about 15 centimeter of the flow (see Figure 2, which shows one of the recorded frames). Analyses of the records enable to identify positions of interfaces in the layered structure of the flow and observe a flow behavior in regions of particular interest in the flow.
Visual observations focused on the flow behavior at the interface between the transport layer and the bed deposit reveal some important differences between the bimodal flow and flows with individual fractions. One would think that the presence of the interfacial layer composed of the finer grains (HSF3) in the bimodal flow bears a close resemblance to the flow with the HSF3 sediment alone as this flow also exhibits an interfacial layer composed of HSF3 grains. Nevertheless, the observations suggest that the interfacial layer behaves quite differently in HSF3 flow and in bimodal flow. While in the bimodal flow the interfacial layer remains relatively thin and stable even at very high bed shear, it tends to be thicker and quite unstable in the HSF3 flow at high bed shear. The interfacial layer changes its thickness in time and exhibits temporal sliding interruptions causing intermittent motion of grains the layer and a variation in the position of the top of deposit.
4.2 Velocity distribution
Measured velocity profiles follow the hybrid linear-logarithmic shape quite well for both mono-disperse flows and bimodal flows. In our analysis of flow conditions at the interface with the deposit we focus on the linear part of a velocity profile.
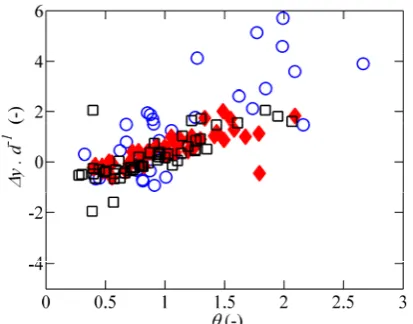
The initial position of the linear profile, y, above the visually observed position of the top of deposit is an appropriate indicator of conditions at the interface. Basically, a high value of y indicates a thick interfacial sliding layer with intermittent motion of grains. Figure 11 shows that y increases with Shields parameter and tends to become much thicker for HSF3 flows than for bimodal flows at high bed shear. This confirms our conclusion based on the visual observations that the interfacial layer is thicker, and hence more unstable, in the HSF3 flows than in the bimodal flows.
Figure 11. Relative initial position of linear profile versus Shields parameter. Legend: blue cylinders - HSF3, black squares - TLT50, red full diamonds – HT.
Another important characteristic of a linear profile is its gradient,
tr
tr u du
dy y 'y (6)
derived from Eq. (2). It gives the slope of the profile across a dominant part of the transport layer and provides information about a measure of bed friction and collisional interactions as quantified in the kinetic theory. A steep velocity gradient indicates low bed friction and intense collisional interactions. Figure 12 shows that the velocity gradient increases with Shields parameter and reaches a certain limiting value at exceeding the threshold value for intense transport. The limiting value is considerably smaller for the coarser TLT50 flow than for the finer HSF3 flow and for the bimodal flow.
concentration of the bimodal flow than of the HSF3 flow at the same value of Shields parameter.
Figure 12. Gradient of linear part of velocity profile versus Shields parameter. Legend: blue cylinders - HSF3, black squares - TLT50, red full diamonds – HT.
The finding that the gradient of the linear velocity profile increases with the Shields parameter offers a hypothesis explaining the thickening of the interfacial layer in bimodal flow at higher bed shear (Figure 3). In the transport layer, the bigger velocity gradient leads to more intense collisions among coarser grains (as the kinetic theory of granular flows suggests) and larger voids among the colliding grains through which the finer grains can fall more easily and finally produce a thicker interfacial layer. A measurement of local concentrations in the lower part of the transport layer would reveal whether more intense collisions lead to lower local concentrations (and hence larger voids). A development of an appropriate measuring technique is work currently in progress. However recent local concentration measurements in a transport layer above deposit in a pressurized pipe [10] support the above assumption.
5 Conclusions
A proportion of individual fractions in transported bimodal sediment is independent of Shields parameter except for Shields values near the lower boundary of the upper plane bed regime.
The interfacial layer develops at the top of deposit below bimodal flow due to vertical sorting, it thickens at more intense bed shear.
Bed friction is smaller in bimodal flow than in flows of the bimodal sediment fractions alone at high bed shear (value of Shields parameter above one). This effect is attributed to the development of the interfacial layer which seems to smoothen the bed in the bimodal flow. The gradient of a linear velocity profile increases with more intense bed shear. It offers a hypothesis explaining a thickening of the interfacial layer under more intense bed shear. The hypothesis is based on principles of the kinetic theory of granular flows and requires a further verification.
Acknowledgments
The research has been supported by the Czech Science Foundation through the grant project No. 16-21421S and by Faculty of Civil Engineering of the Czech Technical University in Prague through the student grant project No. SGS14/179/OHK1/3T/11.
References
1. C. Bel, K. Rorsman,P. Frey, THESIS, (Symposium on Two-phase Modelling for Sediment dynamics in Geophysical Flows), Chatou (France) (2013)
2. G. Parker, ASCE Manual 54 Chapter 3 Transport of gravel and sediment mixture
3. R. A. Kuhnle, J.K Horton, S. J. Bennett,
Sedimentology, 53, 631-654, (2006)
4. A. Bloom, J. S.Ribberink, ,G. Parker, J. Goephys. Res. ,
113, (2008)
5. M. Larcher, J. T. Jenkins, J. Fluid Mech., 782, 405-429, (2015)
6. V. Matoušek, V. Bareš. J. Krupika, T. Picek, Š. Zrostlík, J. Hydrol.Hydromech., 63(4), (2015) 7. V. Matoušek, V. Bareš. J. Krupika, T. Picek, Š.
Zrostlík, Can. J. Chem.Eng., 94(6), (2016)
8. Š. Zrostlík, V. Bareš, J. Krupika, T. Picek, V. Matoušek, EPJ Web of Conferences 92, 02120 (2015)
9. V. Bareš, Š. Zrostlík, T. Picek, J. Krupika, V. Matoušek , Flow Meas. Instrum., 51, 68-78, (2016) 10. V. Matoušek, J. Hydraul. Eng.-ASCE, 135(12),