MICROBIAL REMOVAL IN KABALE DISTRICT,
SOUTHWESTERN UGANDA
ALEX SATURDAY
I56EA/23068/2013
A Thesis Submitted in Partial Fulfillment of the Requirements For
the Award of the Degree of Master of Science (Integrated
Watershed Management) in the School of Pure and Applied
Sciences, Kenyatta University.
DEDICATION
This thesis is dedicated to God almighty, my father, Mr. Robert Musingize, my
mother Mrs. Winnie Kinaheirwe, my lovely friend Ms. Savious Owamani, and my
ACKNOWLEDGEMENT
My heartfelt thanks go to God, who by His grace has brought me this far through all
challenging and difficult times. I really thank him for giving me wisdom, knowledge and all the support I needed to complete this master’s course. I indeed wish to
express my deep and unrelenting gratitude to the German Academic Exchange
Services (DAAD) for the support. Thank you for believing in me and financing my master’s studies.
I am deeply indebted to my University supervisors Dr. George Lukoye Makokha and
Dr. Anthony Macharia for their insightful guidance and professional support, which
encouraged me to complete this work. Their constructive criticism, critical
comments and guidance, gave me the opportunity to explore various issues in this
thesis further. I have really learnt a lot from them. Special thanks to Prof. Chris
Shisanya for his insightful guidance which encouraged me to complete this work.
Special thanks to Prof. Joy Obando, the coordinator of IWM postgraduate
programme at Kenyatta University. She was always available to me when I needed
guidance.
I appreciate the support from National Water and Sewerage Corporation for allowing
me to analyse my water samples in their water laboratory. Mr. Steven Makya,
NWSC-Kabale area laboratory technician is thanked for being very resourceful
during the laboratory analysis of samples. I also appreciate the cooperation of the
respondents that made this study a success.
TABLE OF CONTENTS
DECLARATION ... ii
DEDICATION ... iii
ACKNOWLEDGEMENT ... iv
TABLE OF CONTENTS ... v
LIST OF FIGURES ... x
LIST OF TABLES ... xi
LIST OF PLATES ... xiii
LIST OF EQUATIONS ... xiv
LIST OF APPENDICES... xv
OPERATIONAL DEFINITION OF KEY TERMS AND CONCEPTS ... xvi
LIST OF ACRONYMS AND ABBREVIATIONS ... xviii
ABSTRACT ... xx
CHAPTER 1: INTRODUCTION ... 1
1.1 Background to the study ... 1
1.2 Statement of the problem ... 3
1.3 Justification of the study ... 4
1.4 Research questions ... 5
1.5 Research hypotheses ... 5
1.6 Objectives of the study ... 6
1.6.1 General objective ... 6
1.6.2 Specific objectives ... 6
1.7 Significance of the study ... 7
1.9 Conceptual framework ... 8
CHAPTER 2: LITERATURE REVIEW... 10
2.1 Introduction ... 10
2.2 Sources of drinking water ... 10
2.2.1 Piped water on premises ... 10
2.2.2 Other improved drinking water sources ... 11
2.2.3 Unimproved drinking water sources ... 11
2.3 Household water treatment and storage options ... 12
2.4 Examples of household water treatment technologies and storage options ... 13
2.4.1 Boling method ... 13
2.4.2 Chlorination ... 14
2.4.3 Biosand filtration ... 15
2.4.4 Solar disinfection (SODIS) ... 16
2.4.5 Household water storage options ... 17
2.5 Reasons for use of different household water treatment technologies ... 18
2.6 Bacterial parameters ... 19
2.6.1 Total coliforms ... 19
2.6.2 Escherichia coli ... 20
CHAPTER 3: MATERIAL AND METHODS ... 22
3.1 Study area ... 22
3.2 Research design ... 24
3.3 Sampling design ... 24
3.3.1 Sample size ... 24
3.4 Data collection methods ... 26
3.4.1 Field study survey ... 26
3.4.2 Water sampling ... 27
3.5 Pre-testing of the research instruments ... 27
3.6 Data management ... 28
3.7 Quality assurance and quality control ... 28
3.8 Data analysis ... 29
3.8.1 Laboratory analysis ... 29
3.8.2 Statistical analysis of data ... 30
3.9 Ethical considerations ... 31
CHAPTER 4: RESULTS AND DISCUSSION ... 32
4.1 Introduction ... 32
4.2 Socio-economic and demographic characteristics of respondents ... 32
4.2.1 Gender of respondents ... 32
4.2.2 Age of respondents ... 33
4.2.3 Occupation of respondents ... 34
4.2.4 Level of income... 35
4.2.5 Marital status of respondents ... 36
4.2.6 Education level of respondents ... 37
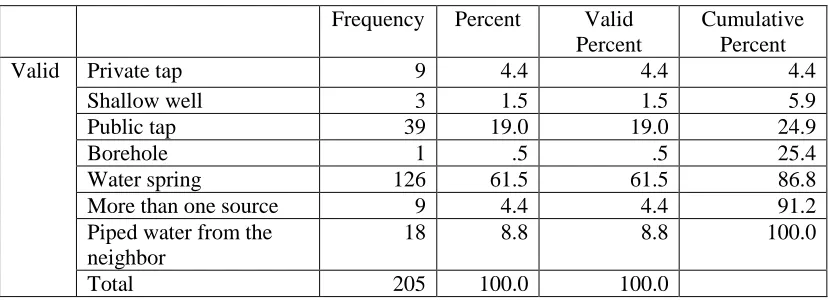
4.3 Sources of household drinking water ... 38
4.4 Household water treatment and storage options ... 43
4.4.1 Household water treatment ... 43
4.4.2 Household water storage practice ... 48
4.6 Bacteriological characteristics household drinking water samples before and after
treatment ... 54
4.6.1 Bacterial concentration before treatment ... 54
4.6.2 Bacterial concentration after treatment by different HWT... 56
4.6.1 Boiling method ... 56
4.6.2 Biosand filtration method ... 57
4.6.3 Let it stand and settle method ... 58
4.6.4 Aqua safe tablets ... 59
4.7 Testing hypothesis II ... 60
4.8 Effectiveness of HWT used under laboratory conditions ... 62
4.8.1 Bacteriological characteristics experiment test water samples before treatment ... 62
4.8.2 Bacteriological characteristics treated water samples by different HWT ... 63
4.8.2.1 Boiling method ... 63
4.8.2.2 Biosand filtration method ... 64
4.8.2.3 WaterGuard tablets ... 66
4.8.2.4 Aqua safe tablets ... 67
4.8.2.5 Let it stand and settle method ... 68
4.9 Classification of test water samples after treatment ... 69
4.10 Comparison between household and experiment test results ... 72
4.11 Testing hypothesis III ... 75
CHAPTER 5: SUMMARY OF FINDINGS, CONCLUSIONS AND RECOMMENDATIONS ... 79
5.1 Introduction ... 79
5.3 Conclusions ... 81
5.4 Recommendations ... 83
5.5 Areas for further research ... 84
REFERENCES ... 85
LIST OF FIGURES
Figure 1.1: Conceptual framework for effectiveness of HWT (Modified after
Valerie, 2010). ... 9
Figure 3.2: Map showing the study area (Kabale District) in southwestern Uganda 23 Figure 3.3: Multistage sampling design used in this study ... 26
Figure 4.4: Pie chart showing percentage of respondents ... 33
Figure 4.5: Pie chart showing age of respondents ... 34
Figure 4.6: Bar graph showing occupation of respondents ... 35
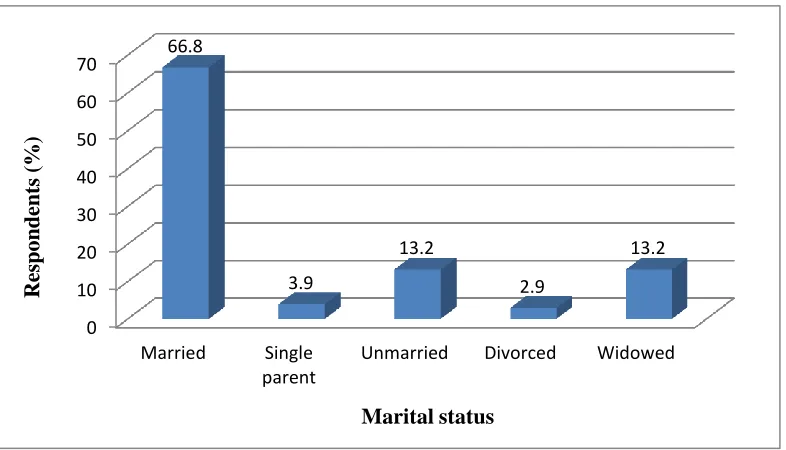
Figure 4.7: Bar graph showing marital status of respondents ... 36
Figure 4.8: Bar graph showing education level of respondents ... 38
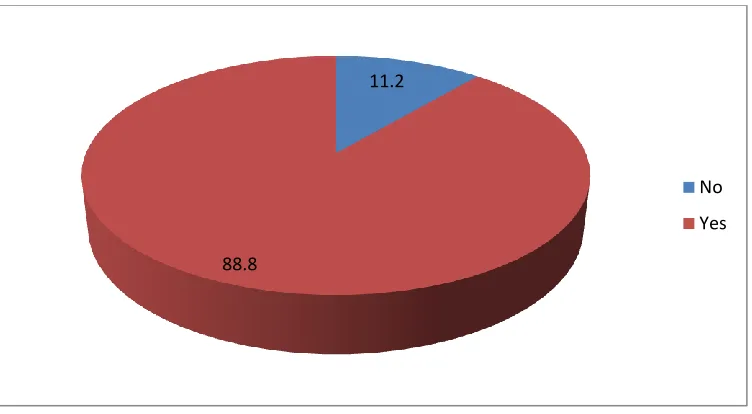
Figure 4.9: Pie chart showing percentage response of respondents on availability of water from source ... 42
Figure 4.10: Pie chart showing percentage response of respondents on household drinking water storage ... 49
Figure 4.11: Pie chart showing percentage of narrow and wide mouthed storage containers ... 51
Figure 4.12: Pie chart showing percentage of the observed characteristics of water storage containers ... 51
Figure 4.13: Concentration of bacteria in untreated household tested water samples55 Figure 4.14: Bar graph showing the percentage of test water samples under different risk level categories in household testing ... 71
LIST OF TABLES
Table 2.1: Maximum bacteriological limits for treated drinking water ... 21
Table 3.2: Number of households selected per stratum (sub-counties) ... 25
Table 4.3: Income distribution of households per month ... 36
Table 4.4: Sources of household drinking water ... 38
Table 4.5: Frequency of drinking water collection from the source ... 43
Table 4.6: Household water treatment technologies ... 44
Table 4.7: Reasons for use of different household water treatment technologies ... 46
Table 4.8:Reasons for not treating household drinking water ... 47
Table 4.9: Household drinking water storage options ... 49
Table 4.10: Reasons for not storing drinking water ... 50
Table 4.11: Style of drawing drinking water from storage container ... 52
Table 4.12: Cross tabulation showing the relationship between sources of water and household water treatment technologies. ... 53
Table 4.13: Chi-Square test results showing the relationship between drinking water sources and the type of household water treatment technologies ... 54
Table 4.14: Classification of total coliforms and Escherichia coli in household untreated water samples ... 56
Table 4.15: Paired samples statistics between bacteria counts in household samples before and after treatment ... 61
Table 4.16: Paired samples test between bacteria counts in household water samples before and after treatment ... 61
Table 4.17: Concentration of bacterial counts before treatment ... 62
Table 4.18: Classification of total coliforms and Escherichia coli in untreated experiment test water samples ... 62
Table 4.19: Total coliforms and Escherichia coli counts in test water samples after boiling ... 64
Table 4.21: Total coliform and Escherichia coli counts in tested water samples after application of WaterGuard tablets ... 67
Table 4.22: Total coliform and Escherichia coli counts in tested water samples after
application of aqua safe tablets ... 68
Table 4.23: Total coliforms and Escherichia coli counts in tested water samples after
treatment by let it stand and settle method ... 69
Table 4.24: Mean log10 bacteria reductions in household test water samples ... 74
Table 4.25: Mean log10 bacteria reductions in experiment test water samples ... 74
Table 4.26: ANOVA results showing the relationship between log10 reduction by
LIST OF PLATES
LIST OF EQUATIONS
Equation 3.1 ... 24
Equation 3.2 ... 24
Equation 3.3 ... 30
LIST OF APPENDICES
APPENDIX I: Semi-structured questionnaire ... 94 APPENDIX II: Concentration of bacteria in field tested water samples ... 100 APPENDIX III: Concentration of bacteria in experiment tested water samples .... 102
APPENDIX IV: Multiple comparisons of log10 total coliforms reduction by different
HWT ... 103
APPENDIX V: Multiple comparisons of log10Escherichia coli reduction by
OPERATIONAL DEFINITION OF KEY TERMS AND CONCEPTS Household water treatment technologies: Household water treatment technologies are methods employed for purposes of treating and storing drinking water at
household level. Sikod et al. (2015) defined household water treatment and storage
as methods employed for purposes of treating water in the home. Household water treatment technologies are also referred to as point-of-use water treatment technologies. The technologies encompass a range of options that enable people or communities to remove or inactivate pathogenic microbes in drinking water. In Kabale District, the technologies include; boiling, biosand filtration, let it stand and settle, application of WaterGuard and application of aqua safe tablets.
Improved drinking water source: WHO and UNICEF (2012) define improved drinking water as ones that are by nature of their construction or through active intervention protected from outside contamination, and in particular from contamination with faecal matter. Improved drinking water sources include; piped water on premises, yard or plot, standpipes, protected springs, protected boreholes and protected dug wells (WHO & UNICEF, 2011). Other improved drinking water sources are ones except piped drinking water source on the premises that are by nature of their construction protected from outside contamination especially feacal matter (WHO & UNICEF, 2011). In Kabale District, improved drinking water sources are piped water into the dwelling, stand pipes, protected springs and protected boreholes.
Safe drinking water: UNICEF and WHO (2012) defined safe drinking water as water with microbial, chemical and physical characteristics that meet WHO drinking water quality guidelines or national standards for drinking water quality. In this case, safe drinking water refers to that water with bacteriological characteristics that meet national and international drinking water quality standards. According to UNBS,
(2008), safe drinking water should have no detectable total coliforms or Escherichia
coli per 100 ml of a given drinking water sample.
Microbial removal: In this case, microbial removal refers to eliminating total coliforms from drinking water.
A household: A household is defined as persons who have eaten and slept under the same roof for at least five days of the week (Valerie, 2010).
Log10 reduction: This is a mathematical term that shows the relative number of live
microbes eliminated from a water sample after water treatment or disinfection.
LIST OF ACRONYMS AND ABBREVIATIONS
APHA American Public Health Association
AT After Treatment
B.Ca Bacteria Count After Treatment
B.Cb Bacteria Count Before Treatment
BC Bacterial Count
BT Before Treatment
CFU Colon Forming Units
DAAD German Academic Exchange Service
DWD Directorate of Water Development
E.C LR (%) Percentage Escherichia Coli Removal
E.C LR Escherichia Coli Log10 Reduction
E.Ca Escherichia Coli Concentration after Treatment
E.Cb Escherichia Coli Concentration before Treatment
GFS Gravity Flow Schemes
GoU Government of Uganda
HWT Household Water Treatment Technologies
IWRM Integrated Water Resources Management
KDLG Kabale District Local Government
MDG Millennium Development Goals
NaDCC Sodium dichloroisocyanurate
ND None Detected
NWSC National Water Sewerage Corporation
SDG Sustainable Development Goals
T/C LR Total Coliforms Log10 Reduction
T/C LR (%) Percentage Total Coliforms Removal
T/Ca Total Coliforms before Treatment
T/Cb Total Coliforms before Treatment
UBOS Uganda Bureau of Statistics
UNBS Uganda National Bureau of Standards
VATs Village Health Teams
ABSTRACT
Health problems associated with the consumption of untreated drinking water is one
of the greatest concernsin Kabale District inspite of government’s efforts to provide
safe drinking water to the people. Household water treatment and safe storage has been shown to be an effective means of reducing health problems associated with unsafe drinking water. The purpose of this study was to examine household water treatment technologies (HWT) and evaluate their ability to improve microbial quality of drinking water. The specific objectives of the study were to: (i) evaluate the different water sources, household water treatment technologies, and storage options of household drinking water, (ii) establish whether the sources of drinking water influence the type of water treatment technologies used at household level, (iii) determine whether there is significant difference between bacterial counts in household drinking water samples before and after treatment, and (iv) evaluate bacteriological effectiveness of household water treatment technologies used under
laboratory conditions. The study employed both analytical and descriptive research
designs utilizing mixed methodologies. A multistage sampling technique was used to select 205 respondents, who were used to obtain socio-economic data, using semi-structured questionnaires. Drinking and source water samples were collected from households and sources of drinking water reported with high pathogenic bacteria concentration respectively for Escherichia coli and total coliforms analyses. World Health Organization (WHO)drinking water quality guidelines were used to categorize drinking water in terms of risk level category. Statistical package of social sciences was used for data analysis. Chi square test was used to test whether sources of drinking water influenced the type of water treatment technologies used at household
level. A paired sample T-test was used to compare mean difference between bacteria
counts in household drinking water samples before and after treatment. A one way ANOVA was used to compare mean differences in bacteria reductions by different
HWT in experiment test water samples. Descriptive statistics were used to analyze
data. Majority respondents (61.5%) were using springs as their sources of drinking water. Of 46 household treated water samples, 17.4% and 45.7% of water samples
fell in no risk category (0 CFU/100 ml) for total coliforms and Escherichia coli
respectively. Of 20 experiment treated water samples, 40% and 73% of samples fell
in no risk category (0 CFU/100 ml) for total coliforms and Escherichia coli,
respectively. Treatment by application of WaterGuard tablets achieved highest total
coliforms removal with 99.5% (1.9 log10), whereas WaterGuard tablets, biosand
filtration method, and aqua safe tablets achieved complete removal of Escherichia
coli (100%) under laboratory conditions. Chi square test yielded no significant relation between drinking water sources and the type of HWT used at household
level (P <0.05). The paired samples T-test showed a significant difference between
CHAPTER 1: INTRODUCTION
1.1 Background to the study
Lack of access to safe drinking water contributes significantly to the global human
health burden and death resulting from infectious waterborne diseases. Lothrop et al.
(2015) noted that increased contaminant guideline exceedances in water supplies
exposes people especially in rural areas to a risk of long-term negative health
outcomes, adding to their rural health disparities. Globally, unsafe drinking water is a
leading cause of preventable diseases, especially among children in developing
countries where there is inadequate sanitation. Current figures indicate that more
than 700 million people globally lack access to improved water sources (WHO &
UNICEF, 2014).
Sobsey et al. (2008) revealed that household water treatment technologies have
emerged as means to empower the local people and communities without access to
safe drinking water at home. Such technologies include; filtration, boiling, solar
disinfection and chemical disinfection among others. UNICEF and WHO (2011)
reported that household water treatment and safe storage is one option for improving
drinking water quality within the home, more especially where water handling and
storage is necessary and recontamination is a real risk between point of collection
and point of use. Access to a distant water source only, unreliable piped supplies,
reliance on surface waters (ponds, lakes, streams and rivers) and unprotected springs,
boreholes and dug wells are crucial factors that make household water treatment
According to WHO (2010), Sub-Saharan Africa is most remarkably and
disproportionately affected by lack of access to safe drinking water. Approximately
327 million people without access to safe drinking water live in Sub-Saharan Africa
(WHO & UNICEF, 2010, 2014). The SDG 6, target 3 aims at reducing water
scarcity by protecting water sources (Costanza & Kubiszewski, 2014).
Paradoxically, people still drink unsafe water inspite of improved access to safe
drinking water.
Drinking water can be contaminated at the source, in the distribution system, during
collection, transportation and storage. Even if SDG 6 is achieved, millions of
households in developing countries will still remain at risk of preventable waterborne
diseases until household water treatment interventions are promoted on a large scale.
Waterborne diseases include diarrhea and cholera. Indirect health effects such as
neurological syndromes, reactive arthritis, malnutrition, and arrested growth and
development, are also attributed to consumption of unsafe drinking water (Sobsey et
al., 2008).
Access to safe drinking water sources in Uganda significantly increased from 54% in
2001 to 76% in 2015 because of high level investment in water sector by the
government and other development partners. However, the burden of waterborne
diseases, child mortality and morbidity remain a significant challenge (WHO &
UNICEF, 2015). UBOS (2012) reported that 23%, and 14% of 1,096 children under
the age five countrywide and in southwestern part of the country, respectively had
that child mortality rate was 90 deaths per 1,000 live births. Most of these deaths
were caused by diarrheal disease as a result of unsafe drinking water.
In Kabale District, 81% of households have access to safe drinking water sources
(DWD, 2010). In addition, 82% and 73% of households in rural and urban areas
respectively have access to safe drinking water sources (DWD, 2010). Due to
recontamination of drinking water during distribution, transportation, and storage,
there is the likelihood of increasing population without access to safe drinking water
than the reported. It is therefore necessary to establish drinking water sources, HWT
used, reasons for use of different HWT, and microbial removal efficiency of HWT
used in Kabale District.
1.2 Statement of the problem
In Kabale District, water is used for numerous activities such as livestock watering,
cooking, bathing and drinking. Human beings defecate and urinate near these water
sources as well (Personal Observation). Consequently, this water may be
contaminated with pathogenic bacteria, for example, Escherichia coli, Salmonella
typhi, Shigella spp., and Yersinia enterocolitica that cause waterborne diseases such
as diarrhea, cholera, typhoid and among others. Health problems associated with
drinking untreated water is one of the most significant concerns in Kabale District.
The Ugandan government had since 1990s made efforts to provide safe drinking
water to the people through national water and sewerage corporation (NWSC), and
water related illnesses remains high. In southwestern Uganda, UBOS (2012)
revealed that 18.8% of children had diarrhea cases before 2012 demographic health
survey. Such findings raise suspicion of possible contamination of drinking water at
household level. This study therefore, seeks to inform the safety of HWT for
bacterial removal from drinking water in Kabale District, southwestern Uganda.
1.3 Justification of the study
Generally, there is inadequate data on household water treatment technologies under
laboratory conditions to provide a solid scientific base to speed-up and scale-up their
implementation in Kabale District. Safe drinking water can leave water treatment
plants to supply points. However, sub-standard water distribution systems, illegal
connections to the distribution system, pressure changes due to power outages, and
other disruptions often lead to the introduction of faecal contamination. Thus, microbiologically contaminated water is delivered to consumers’ taps or collection
points (Clasen et al., 2008; Sobsey et al., 2008). Waterborne disease outbreaks in
Kabale District are relatively common, yet access to safe drinking water is
significantly high. Thus, establishing microbial quality of water from the sources and
from households is strongly encouraged. Methods of water collection and storage
may affect the quality of drinking water. Therefore, examining different water
storage options used at household level is justifiable. Numerous research studies on
household water treatment have been undertaken outside Uganda and have shown a
significant improvement on microbial quality of drinking water and reduction in
be an effective means of improving household drinking water quality and reducing
diseases associated with unsafe drinking water (Sobsey 2002). Additionally, a
systematic review by different researchers in 2005 concluded that diarrhoea can be
reduced by 39% through household water treatment and safe storage (Fewtrell et al.,
2005). According to “The networks,” (2011), Ugandan government acknowledged
her early stage in use of household water treatment technologies and stressed the
need for immediate research into the new development. Evaluating the existing
water treatment technologies for microbial removal from drinking water at
household level is crucial.
1.4 Research questions
i. What are the water sources, household water treatment technologies, and
storage options of household drinking water in Kabale District?
ii. Does the source of drinking water influences the type of water treatment
technology used at household level?
iii. Is there any significant difference between bacterial counts in household
drinking water samples before and after treatment?
iv. What is the bacteriological effectiveness of household water treatment
technologies used under laboratory?
1.5 Research hypotheses
This present study tested the following hypotheses:
i. The source of drinking water does not influence the type of water treatment
ii. There is no significant difference between bacteria counts in household
drinking water samples before and after treatment.
iii. There are no significant differences between mean bacteria reductions by
different HWT under laboratory conditions.
1.6 Objectives of the study 1.6.1 General objective
To examine household water treatment technologies in use and evaluate their ability
to improve the microbial quality of drinking water at household level in Kabale
District, southwestern Uganda.
1.6.2 Specific objectives
This study was addressed by the following specific objectives:
i. To evaluate the different water sources, household water treatment
technologies, and storage options of household drinking water.
ii. To establish whether the sources of drinking water influencethe type of water
treatment technologies used at household level.
iii. To determine whether there is significant difference between bacterial counts
in household drinking water samples before and after treatment.
iv. To evaluate bacteriological effectiveness of household water treatment
1.7 Significance of the study
Results of this study will serve to enlighten water users’ safety about waterborne
diseases. The study results will provide information that aid in formulating policies
on safe drinking water in Kabale District. The results of this study will assist the
relevant authorities in designing appropriate mitigation measures to ensure that
domestic water supplies are protected. Water quality data will enable policy makers
to decide and implement best practices that protect human beings from dangers
resulting from drinking contaminated water. The study has added on to the existing
literature in IWRM and with reliable performance data under laboratory conditions.
This will speed-up and scale-up the implementation of household water treatment
technologies in Kabale District.
1.8 Scope and limitation of the study
The study was conducted in Kabale District, southwestern Uganda. The study
identified and described the different sources of drinking water and household water
treatment and storage option. The study established the reasons for use of different
household water treatment technologies and evaluated bacteriological effectiveness
of household water treatment technologies used in Kabale District. During field
study visits, household heads or a household member above 18 years of age were
interviewed. Household water samples were collected from households when
reported available. Experimentation was done with water samples collected from
water sources with reported high total coliforms and Escherichia coli concertation
respondents as most of them had other commitments. In Rwamucucu and Nyamweru
sub counties, most of the people were always busy with their farm activities until late
evening. This made us walk long distances in search for other respondents to
interview.
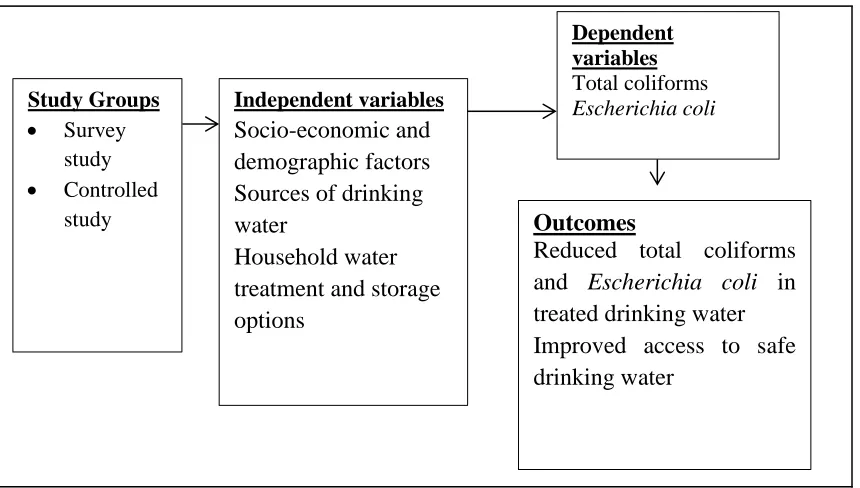
1.9 Conceptual framework
The conceptual framework (Figure 1.1) was used to assess the effectiveness of
household water treatment technologies for microbial removal. Total coliforms and
Escherichia coli in tested water samples from selected households were used as
dependent variables. A number of household factors in the area of study determined
the level of total coliforms and Escherichia coli in both treated water and untreated
source water samples. These factors included; socio-economic and demographic
factors, sources of drinking water, HWT used, water handling practices among
others. These factors were used as independent variables. Socio-economic and
demographic factors included; age, gender, household size and, level of education
and level of income. Sources of drinking water included; public stand taps, water
springs, shallow wells, boreholes, rainfall, piped water in dwelling, streams and
rivers. HWT included; application of WaterGuard tablets, application of aqua safe
tablets, boiling, filtration and let it stand and settle method. Water storage options
were plastic jerry cans, clay pots and plastic buckets. Water handling practices were
water collection, transportation, storage and all those activities that may involve
hands into direct contact with drinking water. Reduced total coliforms and
Independent variables Socio-economic and demographic factors Sources of drinking water
Household water treatment and storage options
Outcomes
Reduced total coliforms and Escherichia coli in treated drinking water Improved access to safe drinking water
Dependent variables
Total coliforms Escherichia coli
Study Groups Survey
study Controlled
study
CHAPTER 2: LITERATURE REVIEW
2.1 Introduction
This chapter highlights the various studies related to the current research, gaps
emanating from these works, and how the present study contributes to fill some gaps
identified. Literature review for this study is done thematically under the following
sections; sources of drinking water, household water treatment and storage options,
reasons for use of different HWT and indicator organisms for microbial drinking
water contamination.
2.2 Sources of drinking water
According to WHO (2004), water is considered safe to drink as long as it does not
cause any significant health risks over life time consumption. According to WHO
and UNICEF (2008), drinking water sources are classified into three main
categories; piped water on premises, other improved drinking water sources, and
unimproved drinking water sources. Components of each category are as described
in the subsequent sections.
2.2.1 Piped water on premises
Piped water connection on user’s premises, yard or plot is the ideal service, since it
provides the most convenient supply and has positive health impacts (WHO &
UNICEF, 2011). Globally good progress has been made in the use of piped drinking
1.1 billion people in urban and rural areas respectively have access to piped drinking
water connection on their premises.
2.2.2 Other improved drinking water sources
The other improved water sources are protected shared community sources such as
public taps, rainwater harvesting, protected dug wells, protected springs and boreholes (Bain et al., 2014; UNICEF & WHO, 2011). Since 1990, use of other
improved drinking water sources has substantially increased. In Southern Asia, the
population using other improved drinking water sources increased from 54% to 65 %
between 1990 and 2008 (UNICEF & WHO, 2011). In Sub-Saharan Africa, use of
other improved water sources increased from 33% to 42% between 1990 and 2008
(UNICEF & WHO, 2008, 2011). The study did not establish the characteristics of
other improved drinking water sources and the possible sources of contamination.
The current study intends to fill these gaps with information.
2.2.3 Unimproved drinking water sources
Unprotected springs, unprotected dug wells, tanker trucks, and surface waters such
as rivers, dams, lakes, pond and streams are considered “unprotected” drinking
water sources (Bartram et al., 2014; UNICEF & WHO, 2008). WHO and UNICEF
(2008) further revealed that 13% of the world’s population without access to safe
drinking water sources gets drinking water from unimproved sources. Sub-Saharan
Africa has the largest population using unimproved water sources, though its figures
dropped from 51% in 1990 to 42% in 2006 (WHO & UNICEF, 2008). The study did
possible sources of contamination. This research study seeks to fill these gaps with
information.
2.3 Household water treatment and storage options
Household water treatment technologies have been proved to be a sustainable
solution for developing countries facing challenges in providing safe drinking water
to their people (Clasen et al., 2007; Fewtrell et al., 2005). Sobsey (2002) found out
that simple and relatively inexpensive HWT have the potential to substantially
improve the quality of drinking water by reducing microbial counts and the risks of
illness and death. Clasen et al. (2006) reported 60 to 90% reduction in the incidences
of diarrheal diseases when an appropriate implementation of HWT was considered in
communities which had no access to safe drinking water supplies.
In countries like Pakistan, Bangladesh, Nepal, India, Guinea Bissau, Mauritania,
Sierra Leone and Egypt, household water treatment is largely limited to richer
quintiles, whereas in Indonesia, Lao peoples Republic, Bosnia, it is lower in richer
quintiles (UNICEF & WHO, 2011). Rosa and Clasen, (2010) reported that use of
HWT is most common among countries within the Western Pacific WHO region
with 66.8% and least common in the Eastern Mediterranean and Africa with 13.6%
and 18.2% respectively.
In a study by Proto et al. (2014) on one-year surveillance of the chemical and
microbial quality of drinking water shuttledfrom the main land (Naples, Campania,
water quality standards. However, during summer when the demand for drinking
water increasedEolianIslands population increased too, the quality of the distributed
water decreased most likely due to either use of vessels that were not specifically
built for drinking water supply or could have used older drinking water supply
containers. Such results suggest an implementation of water treatment at household
level to manage the potential risk of waterborne diseases more effectively.
2.4 Examples of household water treatment technologies and storage options Several studies have revealed that HWT such as boiling, filtration, chlorine addition,
and solar disinfection are effective in microbial removal (Rosa & Clasen, 2010;
UNICEF & WHO, 2011). Straining water through a cloth or letting it stand and
settle, are not considered appropriate methods of HWT (UNICEF & WHO, 2011).
However, these methods are used in some parts of the developing world.
2.4.1 Boling method
Boiling method is the oldest method used to remove pathogenic bacteria from
drinking water at household level. WHO (2004) recommends bringing water to a
rolling boil point temperature (100oC) to ensure any pathogenic bacteria in water are
killed. Agrawal and Bhalwar (2009) found out that heating water to as little as 55oC
for several hours has proved to dramatically reduce non-spore forming bacterial
pathogens in drinking water. The overall use of boiling method in Western Pacific
region is 58.7%, least in the Eastern Mediterranean region (4.0%), and Africa
(4.5%), where Uganda takes a lead in use of the method with 39.8% followed by
technologies such as chlorine is 5.6%, filtration is 4.3%, and solar disinfection is
0.2% (Rosa & Clasen, 2010). Brown and Sobsey, (2012) found out that boiling
reduces the level of Escherichia coli by 98.5%. In addition, of all tested water
samples, 44% never had any Escherichia coli at all. The study did not establish the
reasons for use of boiling method of water treatment at household level, neither the
effectiveness of other popular household water treatment technologies such as
filtration, chlorination, and solar disinfection.
2.4.2 Chlorination
Chlorination is widely used means of water purification and very effective against
most bacteria and some viruses (WHO, 2006). Examples of chemical products used
for chlorination in the study area are; WaterGuard and aqua safe tablets. The
effectiveness of chlorination depends on the correct dose of chlorine solution being
added to the volume of water to be treated. After chlorine is added to water, it then is
mixed and allowed to stand for 30 minutes before water is safe for consumption.
However, chlorination is not effective in highly turbid water (Nath etal., 2006).
A study by Boisson et al. (2013) reported that use of chlorine in treating water at
household level significantly reduce faecal contamination and improves microbial
quality of drinking water. However, the extent to which the population continues to
regularly use chlorine to treat drinking water is not clear. A study by Levy et al. (2014) noted inconsistency of chlorination on microbial removal in a controlled
setting and in household setting. According to Halder et al. (2014), chlorine was
of all surveyed individuals in the department of Yoro in rural Honduras. The study
did not quantify the percentage of total coliforms eliminated as a result of
disinfection by chorine.
2.4.3 Biosand filtration
Biosand filters were introduced by a Canadian researcher with an important design
change that allowed the technology to operate with only intermittent water flow (Clasen, 2009). Passion to use biosand filters by several NGOs such as Samaritan’s
Purse has led to it being distributed in over 24 developing countries around the
globe. This growth and popularity is attributed to the fact that a biosand filter can be
made out of local available materials and the containers are typically made of either
concrete or plastic (Clasen, 2009).
Fiore et al. (2010) conducted a study on the performance of biosand filters in rural
communities of southern coastal Nicaragua. The study found out that 45 of 199
households visited had discontinued the use of biosand filter method. The study did
not establish the reasons for discontinued use of the method, causes of an increase in
number of CFU in treated stored water based on scientific evidence, did not compare
the effectiveness of biosand filter method with the other popular HWT.
A study by Mwabi et al. (2012) in rural communities of Southern Africa reported
that biosand filters have the capacity to produce 0.81– 6.84 liters per hour, an
indicator that it can produce approximately 25 liters per day, the recommended
bacteria by 99% – 100% when using biosand filter. However, the study did not
consider effectiveness of popular household water treatment technologies in southern
Africa such as boiling, solar disinfection, let it stand and settle method among others. Furthermore, the study didn’t establish the proportion of the people using household
water treatment technologies in Southern Africa.
In a study conducted by Tellen et al. ( 2010), 154 households water samples were
tested. The median CFU/100 ml of Escherichia coli from water source, filter spout
and storage vessel were 313, 72, and 144, respectively. In addition, Tellen et al. (
2010) reported 98% and 99% reductions in total coliform, fecal coliform and fecal
Streptococci for traditional biosand filtration and improved biosand filtration,
respectively. This study did not establish the reasons for the discontinued use of the
of biosand filtration method, possible factors for increase in CFU in treated stored
water based on scientific evidence.
2.4.4 Solar disinfection (SODIS)
Solar disinfection is a simple method used to improve the quality of household
drinking water by using sunlight to inactivate pathogens. The method involves filling
transparent plastic bottles with water and exposing them to full sunlight. Exposure
times vary from 6 to 48 hours depending on the intensity of sunlight. Use of solar
disinfection can inactivate 97% of bacteria and 99% of virus (UNICEF, 2008).
Improving microbial quality of drinking water using solar radiation is well known to
inactivate bacteria and its effectiveness depends on local conditions (Dessie et al.,
satisfactory bacterial inactivation (log10 reduction values >6 units for 11 of 13
experiments. Rainfall and cloudy conditions were the factors responsible for
incomplete inactivation of bacteria that was observed (Nalwanga et al., 2014).
2.4.5 Household water storage options
Regardless of whether the collected or treated household water is initially of
acceptable microbiological quality, it often becomes contaminated with pathogens of
fecal origin during transportation and storage due to unhygienic storage and handling
practices (WHO, 2014). Use of narrow-mouthed water storage vessels with hard
cover or lid together with good hygiene practices reduce recontamination of
drinking water by hands especially after boiling (WHO & UNICEF, 2011). Storing
household drinking water in a covered container was associated with production of
safer drinking water than storage in an uncovered container (Brown & Sobsey,
2012).
A research study by Adade et al. (2014) revealed that bacteria count in water stored
in earthen pots water exceeded the World Health Organisation and Ghana Standard
Board specified drinking water quality limits. Total coliforms ranged from 9 to 5.84
X 102 CFU/100 ml with a mean of 2.47 x 10² CFU/100 ml. Earthen pot stored
drinking water from the various communities was contaminated due to unhygienic
handling practices such as dipping of hands and utensils into the storage earthen pot.
However, the study neither established the level of bacteria before it was stored nor
established the reasons for using earthen pots than other water storage options. The
2.5 Reasons for use of different household water treatment technologies
Several studies have reported various reasons for use of different water treatment
technologies at household level. According to UNICEF and WHO (2011), the
proportion of people using appropriate household water treatment technologies
globally is relatively high (50%) especially where drinking water is piped into the
dwelling. This indicates that users do not trust the quality of their tap water. In
contrast, about 23% of people using water sources such as dug wells and unprotected
springs do not use appropriate household water treatment technologies (UNICEF &
WHO, 2011). Perhaps the justification behind this could be a combination of
economic, social, educational and geographical reasons.
A research study by Green (2008), reports that both rural and urban households
expressed their preference to traditional HWT since they are long lasting and
durable. Time factor was ignored by many respondents though a few of them
revealed their preference to some methods that required short time to treat drinking
water. Urban respondents reported that technologies that require long treatment time
are difficult and limit their use. Cost factor also influenced the decision to use
different household water treatment technologies though it did not have significant
impact in the rural areas. The study did not establish the proportion of people using
different household water treatment technologies. The study intends to fill the
identified gaps with information.
A research study by Kakulu (2012) reported that 25% respondents were ignorant
The study further noted that 20% and 19% of respondents attributed the use of
boiling method to cost-effectiveness and microbial removal effectiveness
respectively. Further, four out of five (80%) households reported that chlorine was
effective in disinfecting drinking water, whereas six out of nineteen (33.3%)
respondents favored a cloth to strain drinking water.The study did not determine the
average level of colony forming units as per WHO guidelines for drinking water
quality. This study intends to fill this gap with information.
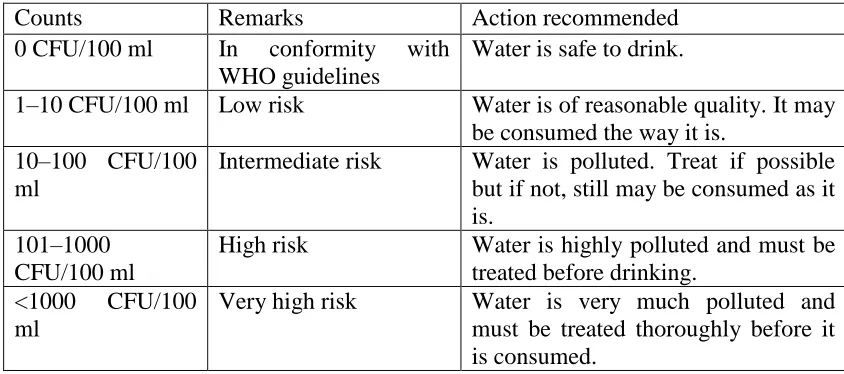
2.6 Bacterial parameters
This section outlines the parameters used to determine household water treatment
efficiency, ease of analysis, some implications and responses related to finding a
positive sample. Table 2.1 shows detectable levels of indicator organisms based on
WHO and UNBS drinking water quality guidelines.
2.6.1 Total coliforms
Total coliforms are Gramma-negative, non-spore forming rod-shed bacteria capable
of growing in the presence of bile salts, or other surface-active agents with similar
growth-inhibiting properties, oxidase-negative, fermenting lactose at 34 – 37oC with
the production of acid, gas and aldehyde within 24 − 48 hours (Payment et al., 2003).
Due to the fact that some total coliforms of non-feacal origin can be present in
natural water, their presence in untreated water can be tolerated. However, when
used as an indicator organism for treatment efficiency, their presence should not be
detected in treated drinking water. Their detection in treated water provokes an
Total coliforms provide basic information on the quality of drinking water though
not an index of feacal pollution. They are preferred indicator organisms because they
are easy to detect and enumerate in a water sample by simple, inexpensive cultural
methods that require basic routine bacteriological laboratory facilities with
well-trained laboratory technicians. The presence of total coliforms in drinking water
sources may be as a result of surface water infiltration or seepage from a septic
system (Anwar, Lateef & Siddiqi, 2010).
2.6.2 Escherichia coli
Escherichia coli are taxonomically well defined member of Enterobacteriaceae and
are characterized by possession of β-glucuronidase and β-galactosidase. They grow
at 44 to 45oC on a complex media, ferments lactose and mannitol with the production
of an acid and produces indole from tryptophan. However, some strains can grow at
37oC but not 44 − 45oC and some do not produce a gas. They are abundant in human
and animal faeces, very common in sewage, treated effluents and natural waters
subject to recent feacal contamination. They are widely preferred index for feacal
contamination and are the widely most used indicator of water treatment
effectiveness. Their presence in treated water indicates inefficient removal of
pathogens.
Verhille (2013) described Escherichia coli as the bestupto-date microbial indicator
available to determine the health risks associated with the consumption of poor
quality water. A research study by Odonkor and Ampofo, (2013) reported that two
pollution in drinking water. Some faecal coliforms are non faecal in origin unlike
Escherichia coli. The study further reported that Escherichia coli provide the best
bacterial indication of faecal contamination in drinking water.
WHO drinking water quality guideline for Escherichia coli is 0 detectable per 100
ml (Table 2.1). This implies that in order to comply with the guideline, for every 100
ml of drinking water tested, no Escherichia coli should be detected in the water
sample.
Table 2.1: Maximum bacteriological limits for treated drinking water
Counts Remarks Action recommended
0 CFU/100 ml In conformity with
WHO guidelines
Water is safe to drink.
1–10 CFU/100 ml Low risk Water is of reasonable quality. It may
be consumed the way it is. 10–100 CFU/100
ml
Intermediate risk Water is polluted. Treat if possible
but if not, still may be consumed as it is.
101–1000 CFU/100 ml
High risk Water is highly polluted and must be
treated before drinking.
<1000 CFU/100
ml
Very high risk Water is very much polluted and
must be treated thoroughly before it is consumed.
CHAPTER 3: MATERIAL AND METHODS
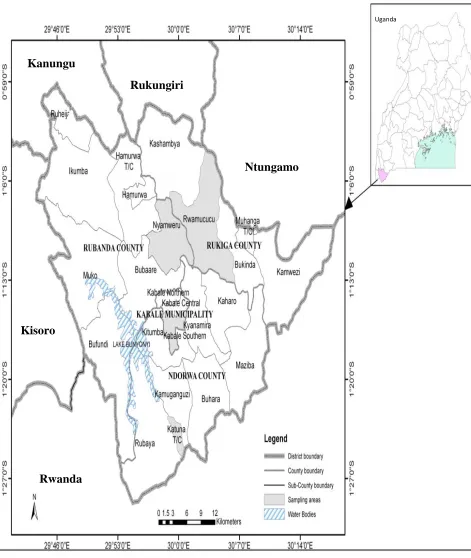
3.1 Study area
This study was carried out in Kabale District located in Southwestern Uganda.
Geographically, it lies between 29° 45' 0" E and 30° 15' 0"E and latitudes 0° 1' 0" S
and 1° 29 0" S (Figure 3.2). It covers a total area of about 1,864 Square kilometers
(KDLG, 2012). It borders with the Districts of Kisoro to the West, Rukungiri to the
North, Ntungamo to the East and the Republic of Rwanda to the South (KDLG,
2012).
Kabale District has 119,631 households with a population of 534,160 people
(UBOS, 2014). Approximately 81% of households have access to safe drinking
water sources (DWD, 2010). The main water supply technologies are public stand
pipes and protected spring technologies however, in some parts of the district, rain
water harvesting is practiced (DWD, 2010). Inspite of this relatively high
accessibility to safe water sources, the proportion of people with waterborne diseases
Figure 3.2: Map showing the study area (Kabale District) in southwestern Uganda
Ntungamo Rukungiri
Kanungu
Kisoro
Rwanda
3.2Research design
The study employed analytical and descriptive research designs utilizing mixed
methodologies in which both quantitative and qualitative approaches were used in
data collection and analysis.
3.3 Sampling design 3.3.1 Sample size
The sample size was calculated using simple random sampling formula in order to
get a representative number of households to use in the study. The formula
developed by Israel (1992) was used to quantify the minimum sample size because it
is most appropriate when using simple random sampling design, and yields a good
sample size necessary for impact evaluations.
𝒏 =
𝑵𝟏+𝑵(𝒆)𝟐
3.1
Where:
n = required sample size, N = Population size (119,631) and e = level of
precision (7% equivalent to its standard value 0.07). Substituting in equation 3.1 gives the following sample size;
𝒏 =
𝟏𝟏𝟗,𝟔𝟑𝟏𝟏+𝟏𝟏𝟗,𝟔𝟑𝟏 (𝟎.𝟎𝟕)𝟐
=
204 3.2
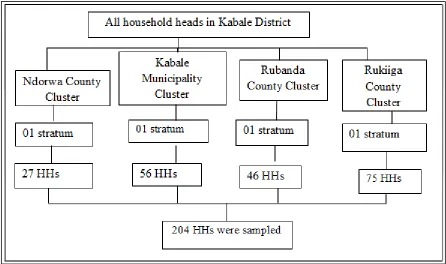
3.3.2 Sampling procedure
The study employed probability sampling with multistage sampling technique
were targeted during the study. In this case, the sample population was divided into
four clusters based on county and municipal political boundaries. At the second level
of sampling, each cluster formed was disaggregated into small groups (sub-counties)
called strata. Four strata each one from the disaggregated clusters were randomly
selected. The up-to-date number of households from each selected stratum (Table
3.2) obtained from respective sub-county chiefs was used to determine the
proportionate number of households selected using a simple formula illustrated in
equation 3.3. Households from each selected stratum were picked randomly during
field study visits.
𝑷𝒔𝒔 = 𝑯𝑯𝑨
𝑻𝑯𝑯𝑨× 𝑺𝒔 3.3
Where:
PSS = Proportionate sample size, HHA = Number of households per selected
sampling area, THHA = Total households in selected sampling areas, SS = Sample
size required.
Table 3.2: Number of households selected per stratum (sub-counties)
Selected strata Total no. of households per selected stratum
Sample size per selected stratum
Percentage of selected household samples
Valid Kabale Municipality South 4,478 56 27.3
Katuna 2,157 27 13.2
Nyamweru 3,685 46 22.5
Rwamucucu 5,959 75 36.8
Figure 3.3: Multistage sampling design used in this study
3.4 Data collection methods 3.4.1 Field study survey
The purpose of the field survey was to establish the socio-economic and
demographic characteristics of households, identify sources of drinking water,
HWTS and to establish the reasons for use of different HWT. Semi-structured
questionnaires (Appendix I) were used to collect socio-economic and demographic
data, data on drinking water sources, HWTS and the reasons for use of different
HWT. The questionnaire was divided into three sections. Section A assessed the
socio-economic and demographic characteristics of respondents, section B assessed
3.4.2 Water sampling
For each household visited, both treated and untreated water samples (if the
household head reports them available) were collected aseptically in sterilized 500
ml bottles during unannounced visits. For purposes of quality, field samples were
collected in duplicates. The bottle corks were shielded with aluminum foil in order
to avoid any form of hand contamination and adhere to aseptic techniques. The
researcher assigned identification numbers to each water sample and recorded the
time of sampling, type of the sample (whether treated or untreated) and the
technology used to treat it. The number of days the treated water had stayed up to
sampling time was recorded. All water samples were stored at 4oC before analysis.
Experiment test water samples were collected from four unprotected water springs
namely; Sapato, Hamwaro, Mukakyenkye and Kirigime water springs reported with
high bacterial contaminants during our field study visits. Thereafter, each sample
unit was treated by all the five treatment technologies under study that were
identified during the field study survey. These include; biosand filters, aqua safe
tablets, boing method, WaterGuard tablets and let it stand and settle method. All the
water samples were tested for both total coliforms and Escherichia coli before and
after treatment in accordance with standard methods for the examination of water
and wastewater (APHA, 1981).
3.5 Pre-testing of the research instruments
Research instruments for this study were tested in the northern Kabale municipality
the intended data. Errors identified were noted and corrected before the actual field
study.
3.6 Data management
Filled questionnaires were checked for completeness at the end of each data
collection day within the field to identify any missing data before leaving the field.
Water samples were diligently labeled in the field and transported at room
temperature to the laboratory for safe storage and analysis. Water samples were
stored at room temperature for about 2 to 3 hours before they were analyzed.
3.7 Quality assurance and quality control
When assessing effectiveness of HWT for microbial removal, quality control and
quality assurance are absolutely important. Standard methods and procedures were
employed with all relevant parameters such as detection limits, repeatability and
storage conditions of samples. Upon collection, samples were immediately placed
on ice in coolers and then transported to the laboratory at 4°C. Upon arrival at the
laboratory, samples were refrigerated at 4°C, and analyzed within six hours of
collection. Previous studies indicate that such a holding time has little effect on
measured total coliforms and Escherichia coli concentrations at temperatures less
than 10°C, although analysis should always be conducted as rapidly as possible
(Pope et al., 2003). All the bacterial analyses were carried out at NWSC-Kabale area
3.8 Data analysis
3.8.1 Laboratory analysis
Membrane filtration method was used in analysis of water samples in accordance
with standard methods for the examination of water and wastewater. 100 ml of water
were aseptically drawn from each unit of the samples and filtered through a 0.45 μm
millipore filter membrane. The membrane was aseptically removed from the
filtration unit by using sterile forceps and placed on the medium in the petri-dish in a
rolling motion to avoid entrapment of air. Total coliforms and Escherichia coli
counts were determined by incubating the membrane filter on Hichrome media at
37oC and 44oC for 24 hours, respectively. In order to ascertain the number of total
coliforms and Escherichia coli contained in each incubated sample, colony forming
units (CFU) developed on the membrane filter after incubation were counted.
Effectiveness of HWT was determined by testing the bacteriological quality
household water samples (before and after treatment) and extended laboratory testing
for bacterial reduction in source water by HWT identified during unannounced field
study visits. Reduction of total coliforms and Escherichia coli indicator organisms in
water samples before and after treatment was key performance outcome measured.
Enumeration of total coliforms and Escherichia coli before and after treatment was
done following standard methods for the examination of water and wastewater
(APHA, 1981, 1995; Rice, Bridgewater, & APHA, 2012; WE Federation, 2005).
converted to percentage reduction. The formula for calculating bacteria removal
efficiency is shown in equations 3.4 − 3.5 (Martin, 2010).
𝑳 𝑹 = 𝒍𝒐𝒈𝟏𝟎(𝑩. 𝑪𝒃 ) − 𝒍𝒐𝒈𝟏𝟎(𝑩. 𝑪𝒂 ) 3.3
𝑷𝑹 =𝑩.𝑪𝒃 −𝑩.𝑪𝒂
𝑩.𝑪𝒃 × 𝟏𝟎𝟎% 3.4
Where:
LR = log reduction, PR = percentage reduction, B.Cb = bacteria count before
treatment, B.Ca = bacteria count after treatment.
3.8.2 Statistical analysis of data
Descriptive statistics were used to analyse socio-economic, demographic and
laboratory data. Pie charts, bar graphs, and line graphs, were used to explain the
bacterial characteristics of water samples before and after treatment in relation to
WHO standards for drinking water quality, establish the different sources of water,
HWTS, and the reasons for use of different household water treatment technologies
in Kabale District, southwestern Uganda.
Chi square test was used to test the association between socio-economic and
demographic factors and the type of water treatment technologies used at household
level. A Paired samples T-test was used to compare mean difference between
bacteria counts in household drinking water samples before and after treatment. One
way ANOVA was used to compare mean differences between bacteria reductions by
confidence level. If the probability (p) value was less than 0.05, the test was
significant but p-value greater than 0.05 showed no significant difference between
the variables compared. The statistical tests were performed in SPSS version 17.0.
3.9 Ethical considerations
Before the actual study, the researcher requested for permission from respective
sub-county administrators two weeks prior to the actual field study. Informed consent
from the respondents was obtained during the field study and participation was
voluntarily. The identity and information given by the respondents was confidential.
Only questionnaire numbers helped to link respondents’ answers to water testing
CHAPTER 4: RESULTS AND DISCUSSION
4.1 Introduction
This chapter presents the results and cover discussion of findings from the field
survey and laboratory analyses conducted in Kabale District southwestern Uganda.
Results on sources of drinking water, household water treatment and storage options
used and the reasons for use of different household water treatment technologies are
discussed in this chapter. Bacteriological quality of treated drinking water is
evaluated to determine the effectiveness of water treatment technologies at
household level.
4.2 Socio-economic and demographic characteristics of respondents
Socio-economic and demographic characteristics evaluated in this study include;
gender, age, occupation, level of income, marital status, level of education and
household size. These characteristics were selected because they influence the use of
different household water treatment technologies.
4.2.1 Gender of respondents
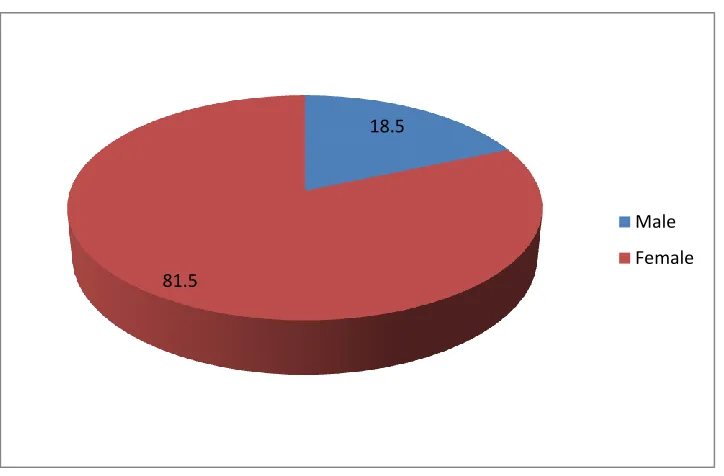
Out of 205 household heads that were randomly sampled, 81.5 % were female
respondents and 18.5% were male respondents (Figure 4.4). Gathering household
information from both sexes on the same issues provided gender perspectives and
helped in assessing the reliability of the responses from the field study survey.
Women in rural areas were more involved in regular farm activities than men thus,
treatment. Schmidt and Cairncross (2009) reported that household water treatment
contributes less to economic and educational activities of women since it does not
affect water supply. Instead, household water treatment increase work load of
household members, especially women, although probably not to a very substantial
extent.
Figure 4.4: Pie chart showing percentage of respondents
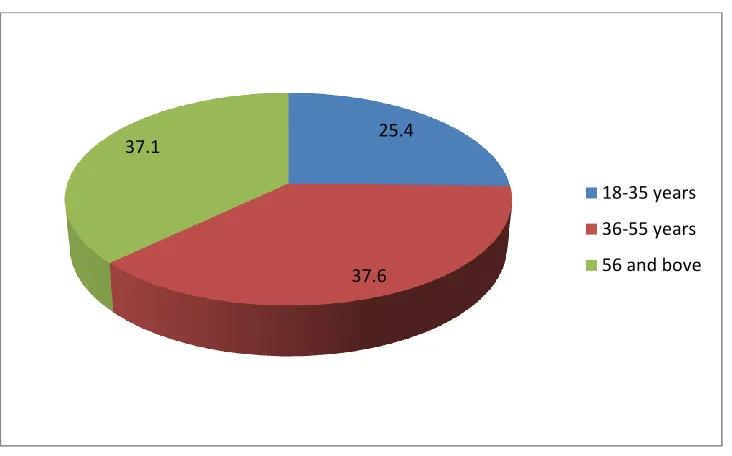
4.2.2 Age of respondents
As shown in figure 4.5, respondents were grouped into three categories based on
their age. Majority of respondents (74.7%) were above 36 years of age. This was
because the study basically targeted household heads. Only 25.4% of respondents were in the youth age bracket (18−35). Elderly people tend not to labour so much in
implementing household water treatment which is at times rigorous, labour intensive
and sometimes have cost implications. They tend to be conservative, sticking to their 18.5
81.5
Male
traditional and inappropriate methods of household water treatment. Most young
people are passionate in combatting diseases so as to live longer. They know about
diseases that spread as a result of drinking contaminated water and are more
interested in household water treatment. The study revealed that all the respondents between 18−35 years of age reported they were practicing household water
treatment. Wright and Gundry (2009) reported that younger household heads are
more open to newer HWT such as chlorination than older household heads who tend
to rely more on traditional HWT.
Figure 4.5: Pie chart showing age of respondents
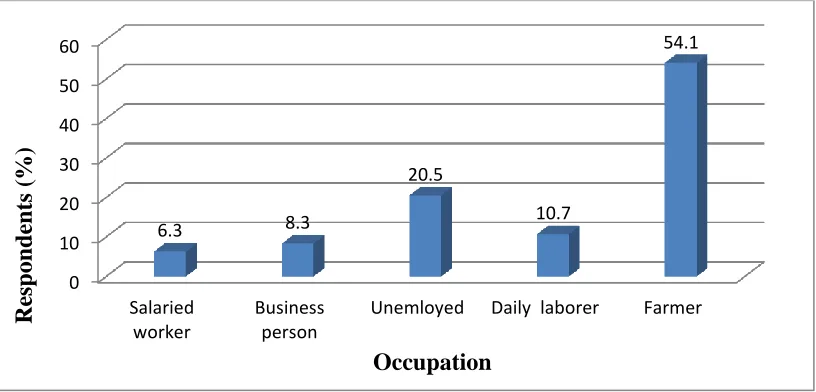
4.2.3 Occupation of respondents
As shown in figure 4.6, majority of respondents were farmers (54.1%) followed by
daily labourers (10.7%), business people (8.3%) and salaried workers (6.3%). It was
further noted that 20% did not identify their sources of income. Majority 25.4
37.6 37.1
18-35 years
36-55 years