Microarray Image Segmentation using Enhanced Hough
Transform
1
K. Venkatasubramanian ,
2Dr. S.K.Srivatsa,
3Dr. C. Parthasarathy
1Research Scholar, SCSVMV University, Kanchipuram, 1Associate Professor, Ramachandra College of
Engineering, Eluru
2Retd. Prof. Department of CSE, Anna University, Chennai - 602 025., 3Assistant Professor, Dept. of IT, SCSVMV
University, Kanchipuram.
Abstract--Microarray is most effective tool among accessible for analysts to contemplate quality articulation profiles in the life sciences. Microarrays allow to Monitoring of articulations for many genes at the same time. Image investigation is a urgent assignment for microarray tests that can impact progressive examination like recognizable proof of differentially communicated genes. Over microarray examination, quality articulation levels can be accomplish and the organic data of an ailment can be characterize. The quality articulation information imbued in the microarray is acquire utilizing Image preparing strategies. The most difficult undertaking in microarray Image investigation is spot division.
A handy solution to this issue is to outfit a calculation than can be utilized to find any spot inside the microarray Image. Upgraded Hough Transformation (EHT) is a dynamic component extraction system utilized as a part of Image investigation, PC vision, and advanced Image preparing. EHT calculation is tried on the DNA microarray Images to extend the precision and the versatility of the spots confinement, tending to and division process. The objective of the tried system is to discover youthful occasions of spots inside a specific class of circles by applying a surveying strategy on the DNA microarray Images for spots confinement, describing and tending to the pixels of each spot into frontal area pixels and foundation together. The proposed strategy is praiseworthy to the K-implies technique and the Support vector machine (SVM)
I. INTRODUCTION
Microarray innovation permits synchronous estimation of thousands of qualities in a solitary test. This gives a valuable device to assessing the outflow
of qualities and extraction of the portrayal and chromosomal auxiliary data about these qualities. Microarrays are varieties of glass magnifying lens slides, in which a huge number of discrete DNA successions are printed by a mechanical cluster, subsequently, shaping round spots of known distance across. Each spot in the microarray picture contains the hybridization level of a solitary quality [1]. Wherever, the measure of the fluorescence hybridization is influenced by things that occur amid the assembling of DNA microarray pictures [2], the productivity of the exploratory arrangement of the microarray pictures specifically influences the accuracy of the microarray information investigation [3].
Microarray Images taking care of reliably experience three phases: (I) gridding to distinguish the circumstance of the spot point of convergence of the Image and perceives their headings, (ii) division, which areas, each microarray spot into nearer view and establishment pixels, and (iii) control extraction to figure the frontal territory fluorescence power and establishment powers [4].
One basic task related with the examination of DNA microarray Images is the spots, tending to and gridding, can be isolated into three essential classes: (I) manual, (ii) semi-robotized, and (iii) modernized. Various papers have been circulated showing unmistakable methods of tending to [5]. Most of these techniques in perspective of the figuring of vertical and level Image constrain profile, as displayed in the going with papers [6, 7, 8, 9].
region pixels and establishment. Since it broadly impacts the exactness of littler scale show data, the division has been a most objective and testing one. The microarray Image division systems can be arranged into four classes (I) Fixed and flexible circle, considers the spots with circle shape [10] , which is used as a piece of ScanAlyze and GenePix, (ii) Histogram-based procedure, it uses a circle target cloak to cover all the frontal territory pixels, and procedures a breaking point using the Mann-Whitney test [11, 12], (iii) Adaptive shape strategy, performs Image division in light of spatial closeness among pixels [13, 14], (iv) Clustering methodology, as a most typical technique, has the favored angle that they are not limited to a particular shape and size for the spots [15]. Since division is used for parceling the Image into the areas of nearer view and establishment, the amount of bundle centers k is set to two. As the basic bundle centers, the pixels with slightest and most outrageous forces are picked. All data shows are then designated the nearest cluster centers as demonstrated by a partition measure (e.g., Euclidean detachment). Starting there, new bundle centers are set to the mean of the pixel regards in each gathering. Finally, the count is iteratively reiterated until the point that the gathering centers stay unaltered [16, 17]. Bit thickness estimation KDE can be associated with find their surveyed densities in the wake of using Gaussian mix model to set up the front line and establishment. By then, a cut-off point for segmenting a spot into two packs is managed by the correspondence of two evaluated densities. The purposes of intrigue are given in Algorithm 6.3 [18].
In the present paper an uncommon DNA microarray Image division structure is introduced, the proposed technique in light of the EHT computation for spots restriction, tending to and division at the same time. Whatever is left of the paper is dealt with as takes after. In the second territory, the proposed strategies are elucidated in detail. Test comes to fruition and the examinations with the division eventual outcomes of K-means and SVM are discussed in the third section. Finally, the conclusion is analyzed in the fourth region.
1.1 Microarray images database
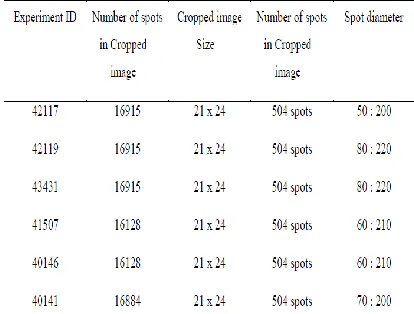
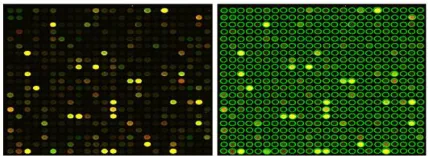
Genuine microarray Images from all inclusive microarray Images database UNC [20] are utilized to assess the proposed method. Pixel by pixel data has been extricated utilizing the explanation record of the UNC Images, reenacting the settled circle division. A paired guide is created for the each spot, describing the pixels inside the hover as flag pixels and the pixel outside of the hover as foundation as appeared in Fig.3. This double guide is utilized to assess the productivity of the proposed strategy. The properties of the Images, we utilized are appeared in table 1.
Table 1. The properties of the cropped microarray images
Fig. 2.examples of cDNA microarray image.
Fig. 3.Spots binary map.
1.2 DNA Microarray Image Filtering.
smoothing procedure, which can protect Image points of interest well while taking out commotion. Different reasons why we pick the middle channel are that it is basic and its computation many-sided quality is generally low.
The fundamental thought of the middle channel is to gone through the flag section by passage, supplanting every passage with the middle of neighbouring sections. The example of neighbours is known as the "window", which slides, passage by section, over the whole flag.
The middle is figured by first arranging all the pixel esteems from the window in numerical request, and afterward supplanting the pixel being considered with the center (middle) pixel esteem. Assuming f(x, y)i s the dim level of(x,y), at that point the yield of the middle channel is portrayed as takes after :
H = MedW{f(x,y)}
Where W is the filtering window.
Median filter with window size 3 × 3 is applied on the gray scale microarray image (Fig.4) in order to extract the gradient information of the cropped image and identify the location of all spots on the microarray image, as in Fig. 5.
Fig.4.cDNA microarray gray scale image.
Fig.5: DNA microarray filtered image.
1.3 Edge Detection
Canny edge detection technique [21] is applied in the filtered image (Fig.5) in order to extract the edge of each spot in the image as in Fig.6.
Fig.6. Canny edge detection results.
II. ENHANCED HOUGH TRANSFORMATION (EHT).
Enhanced Hough Transformation is perceived as a powerful bend discovery system. This technique can distinguish objects, even commotion presence. Duda and Hart created the primary draw of Circular Hough change in 1972 [25]. EHT is one of the adjusted variants of Hough change; it expects to locate the roundabout examples inside a Image. The fundamental thought of EHT is to change an arrangement of highlight focuses in the Image space into an arrangement of amassed votes in a parameter space. At that point, for each component point, votes are amassed in a gatherer exhibit of all parameter mixes. The cluster components that contain the most elevated number of votes demonstrate the nearness of the shape. The circle design is portrayed by condition 1. There are numerous adjustments on the EHT either to expand the location rate or decrease its computational intricacy [26,27,28].
2.1 EHT Algorithm
Think about a point (xi, yi) in the Image. The general condition of a circle is:
(x - u)2 + (y - v)2 - r2 = 0... (1)
Where u and v are the directions of the inside and r is the span of the circle.
sweep as the main obscure parameter. Accordingly, the parametric conditions of a hover in polar directions are:
x = u + r cosɵ... (2) furthermore,
y = v + r sinɵ...(3) Settling for the parameters of the circle we get the conditions
u = x - r cosɵ... (4) furthermore,
v = y - r sinɵ... (5) Presently, given the inclination edge Q at an edge point (x,y), we can figure cosɵ and sinɵ. Note that these amounts may as of now be accessible as a side-effect of edge recognition. We can take out the span from the combine of conditions above to yield
v = u tanɵ - x tanɵ + y... (6)
2.2 Circle Proper :
First quantize the parameter space for the parameters u and v.
Then appoint the aggregator exhibit A(u,v) to zero.
Then figure the inclination greatness G(x,y) and point ɵ(x,y).
For each edge point in G(x,y), augment all focuses in the aggregator exhibit A(u,v) along the line condition 6 .
The circles fixates on the Image relate to the Local maxima in the collector exhibit.
In this work, the EHT is utilized with shifting span from 6 to 10 pixels to distinguish the spots in DNA microarray Image. Fig.7. Demonstrates an irregular picked microarray Image in the wake of applying EHT calculation, in which each spot has a green hover around it, from that point forward, each spot can be extricated as individual Image as appeared in fig. 8.
Fig.7. The result of applying CHT on the cDNA microarray image.
Fig.8. Example of the extracted spots and their corresponding binary map.
III. EXPERIMENTAL RESULTS
Java is utilized to make and apply the proposed method and ran them on the Intel-based Pc with Windows 7 os. The microarray Images utilized as a part of the examinations portrayed in table 1 and every one of the pieces were put away in TIFF documents.
For the greater part of the spots, the foundation is isolated from the closer view superbly. The aftereffect of the division edge is near the genuine spot as appeared in Fig.8. The haphazardly picked unique Image and its relating division result from the UNC database are appeared in Fig.9.
Fig.9. Randomly chosen original images in the left side and its corresponding segmentation result on the right side from the UNC database
Fig.10.Comparison the results of three segmentation methods CHT, K-means, and SVM .
IV COMPARISON OF GENE EXPRESSION
In this part, we think about the consequences of the proposed technique with the aftereffects of k-implies strategy and SVM utilizing Gene articulation level [30].
For the two channels, green and red, the articulation esteems are characterized, by Green power and Red force as the accompanying:
For the green channel
Green force = (mean estimation of the closer view – mean estimation of the foundation)... (7)
For the red channel
Red force = (mean estimation of the frontal area – mean estimation of the foundation) ...(8)
Quality articulation level = log2 (Red force/Green power)... (9)
Fig.11. Gene expression level after using the different segmentation methods (CHT – K-means – SVM)
From Fig.11 we can see that, the estimation of quality articulation level of EHT variable from - 0.4795 to 0.3177 for SVM changing from - 0.9476 to 0.6354, and for K-implies shifts from - 1 to 0.9531, this demonstrates the EHT has the best outcome contrasting and alternate techniques.
V. CONCLUSION
This paper exhibits another technique for DNA microarray Image investigation utilizing roundabout Hough changes. This new technique lessens the handling time of spots, tending to and restriction and builds the effectiveness of spot division. The numerical and visual outcomes demonstrate that, the proposed method is a viable in spot tending to, confinement and division.
REFERENCES