Scholarship@Western
Scholarship@Western
Electronic Thesis and Dissertation Repository
7-20-2017 12:00 AM
The Effects of Moderate Intensity Strength Training Coupled with
The Effects of Moderate Intensity Strength Training Coupled with
Blood Flow Restriction: A 12 Week Intervention
Blood Flow Restriction: A 12 Week Intervention
Kelly Barrett
The University of Western Ontario
Supervisor Dr. Greg Marsh
The University of Western Ontario Graduate Program in Kinesiology
A thesis submitted in partial fulfillment of the requirements for the degree in Master of Science © Kelly Barrett 2017
Follow this and additional works at: https://ir.lib.uwo.ca/etd
Part of the Exercise Physiology Commons, Exercise Science Commons, and the Sports Sciences Commons
Recommended Citation Recommended Citation
Barrett, Kelly, "The Effects of Moderate Intensity Strength Training Coupled with Blood Flow Restriction: A 12 Week Intervention" (2017). Electronic Thesis and Dissertation Repository. 4702.
https://ir.lib.uwo.ca/etd/4702
This Dissertation/Thesis is brought to you for free and open access by Scholarship@Western. It has been accepted for inclusion in Electronic Thesis and Dissertation Repository by an authorized administrator of
i
ABSTRACT
Blood flow restriction training (BFRT) has been suggested to increase muscle size and
strength in trained and untrained individuals when using light load intensities (30 percent) one
repetition maximum (1-RM). However, there is little data to support its use when working with
moderate load intensities, specifically, above 50 percent of an individual’s 1-RM. The purpose of
this study was to evaluate the effects of moderate load intensity BFRT on muscle size and strength
of the elbow flexors after a 12 week strength training intervention. Nine, previously strength
trained, participants performed an elbow flexion exercise at 70 percent of their individualized
1-RM, twice per week, while blood flow of the brachial artery was reduced by 50 percent in the
dominant (right) arm. Elbow flexor muscle mass, and maximal isometric voluntary contractions
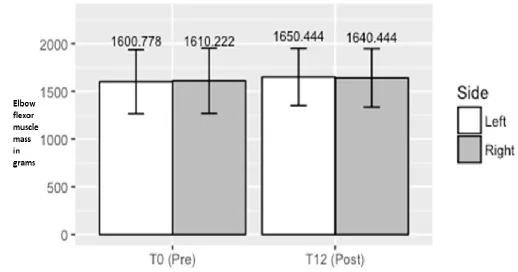
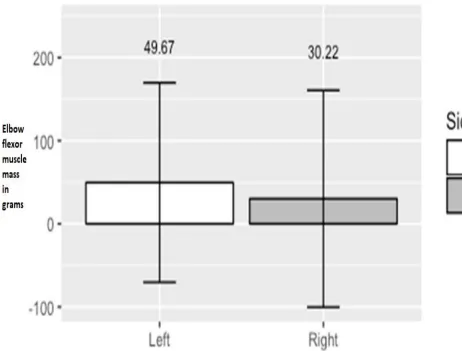
were assessed before and after training. Elbow flexor muscle mass did not significantly increase
after the 12 week training period in either arm, (BFRT arm = 1.85%, non-BFRT arm 3.01%), (p =
0.249). There were no significant differences in isometric arm strength between pre and post
training, BFRT arm: (pre: 88.5 + 16.6, vs. post: 87.2 + 16 Nm), non-BFRT arm: (pre: 87.8 + 18.8,
vs. post: 85.6 + 20.2 Nm), (p = 0.407). Therefore, we conclude that unlike low load intensity BFRT,
performing BFRT at higher load intensities does not augment muscle growth or muscular strength
in trained, young, men when compared to normal strength training alone.
Keywords: Elbow flexor, Blood flow restriction training, 1-repetition maximum, Isometric
ii
ACKNOWLEDGEMENTS
This thesis is dedicated to my close family, father Pat, mother Gloria and sisters Chelsea
and Paige who have always supported me throughout my life. Thank you for providing me with
helpful encouragement and motivation in my educational as well as life pursuits. I would also
like to thank my girlfriend, Reilly Evoy, for her constant support throughout the entire Master’s
process.
I would like to thank my advisor, Dr. Greg Marsh, for his guidance, support and
assistance throughout the entire Master’s program. Thank you for allowing me to have the
freedom to choose my own research topic, it made a world of difference.
Dr. Charles Rice and Dr. Kowalchuck, I cannot thank you enough for your support and
allowing me to use your lab as if I was one of your own students. With the ability to use your lab
and equipment I was able to collect valuable data. I would also like to thank Chris Stolworthy
for his help collecting data in the Neuromuscular Physiology Lab. As well, David Copithorne
and Lorenzo Love thank you for your advice and feedback. Lauren Crutchlow, thank you for
taking time out of your busy schedule to perform all the DXA scans.
I would like to acknowledge my good friends Spencer Thompson and Dr. Sonja Reichert.
Spencer, thank you for your constant feedback, support and editing throughout the writing
process. Sonja, thank you for listening to my ideas and helping me better understand the Master’s
writing process. I could not have done this without the help from all of my family and friends,
iii
TABLE OF CONTENTS
Page
ABSTRACT ... i
ACKNOWLEDGEMENTS ... iii
TABLE OF CONTENTS ... iii
LIST OF TABLES ... vi
LIST OF FIGURES ... vii
LIST OF APPENDICES ... viii
LIST OF ABBREVIATIONS ... ix
Chapter 1 INTRODUCTION ... 1
1.2 Purpose ... 4
1.3 Objectives ... 4
1.4 Hypotheses ... 4
Chapter 2 LITERATURE REVIEW ... 5
2.1 Cross- Bridge Theory ... 5
2.1.1 Cross Bridge Cycle ... 5
2.2 Muscle Fiber Types ... 5
2.3 Skeletal Muscle Hypertrophy ... 6
2.3.1 Muscle Hypertrophy and Progressive Overload ... 7
2.3.2 Muscle Hypertrophy, and Muscle Fiber Type ... 7
2.3.3 Muscle Hypertrophy and Strength Training ... 8
2.4 Isometric Strength Compared to Dynamic Strength Training ... 9
2.5 Blood Flow Restriction Training ... 9
2.5.1 Blood Flow Restriction Training in Rehabilitation ... 10
2.5.2 Low Load Intensity Blood Flow Restriction Training: Biceps Brachii Muscle ... 10
Hypertrophy ... 10
2.5.3 Blood Flow Restriction Training and Muscle Failure... 11
2.5.4 Blood Flow Restriction Training within the Athletic Population ... 12
iv
2.6.1 Lactate, GH and Metabolic Products ... 12
2.6.2 Fiber Type Recruitment with BFRT ... 13
2.6.3 mTOR Pathway ... 14
2.6.4 Nitric Oxide Synthase (NOS-1) ... 14
2.6.5 Myostatin Gene Expression ... 15
2.6.6 Muscle Cell Swelling ... 15
2.7 Blood Flow Restriction and Cuff Pressure on the Quadriceps ... 15
2.8 Blood Flow restriction, Cuff Width and Pressure on the Bicep Brachii ... 16
2.9 Exercise Intensity and Occlusion Pressure ... 17
2.10 Blood Flow Restriction Continuous vs. Intermittent Cuff Inflation ... 17
2.10.1 Blood Flow Restriction Continuous vs. Intermittent on Muscle Activation ... 18
2.11 Blood Flow Restriction Training at Moderate to High-Load Intensities ... 18
Chapter 3 METHODS ... 21
3.1 Population and Study Design: ... 21
3.2 Eligibility ... 21
3.3 Outcome Measures ... 21
3.4 Anthropometry ... 22
3.5 Dual-Energy X-ray Absorptiometry: Muscle and Fat Mass Image Analysis ... 22
3.6 Strength Training: Seated Dumbbell Biceps Curl ... 26
3.7 Cybex Isokinetic Dynamometer: Isometric Strength Testing ... 28
3.8 Doppler Ultrasound Pilot Test for Pneumatic Cuff Pressure ... 30
3.9 Statistical Analysis ... 30
Chapter 4 RESULTS ... 31
4.1 Dual-Energy X-ray Absorptiometry Image Analysis: Elbow Flexor Muscle Mass ... 31
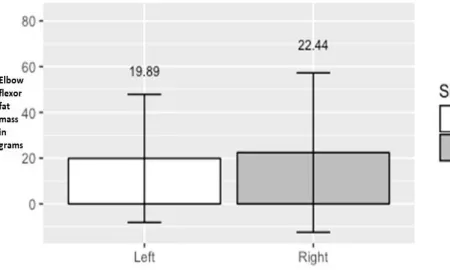
4.2 Dual-Energy X-ray Absorptiometry Image Analysis: Elbow Flexor Fat Mass ... 31
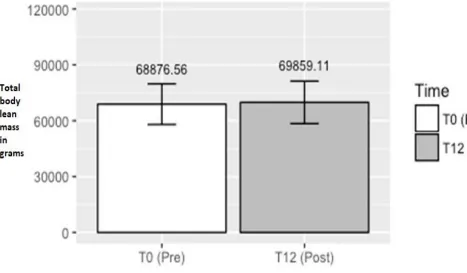
4.3 Dual-Energy X-ray Absorptiometry Image Analysis: Total Body Lean Mass ... 32
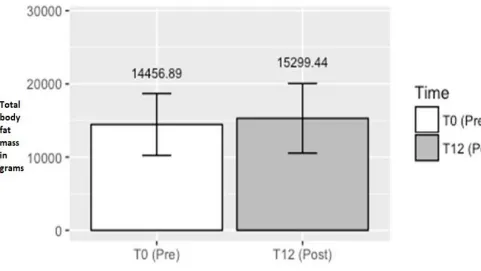
4.4 Dual-Energy X-ray Absorptiometry Image Analysis: Total Body Fat Mass ... 32
4.5 Isometric Strength ... 38
4.6 Doppler Ultrasound Pilot Test ... 39
Chapter 5 DISCUSSION ... 41
5.1 Overview ... 41
v
5.3 Strength Testing ... 44
5.4 Muscle Imaging ... 45
5.5 Occlusion Pressure ... 46
5.6 Conclusions ... 47
Chapter 6 LIMITATIONS ... 49
Chapter 7 FUTURE INVESTIGATIONS ... 50
REFERENCES ... 51
APPENDIX A ... 59
APPENDIX B ... 59
APPENDIX C ... 61
APPENDIX D ... 62
vi
LIST OF TABLES
Table Description page
4.1 Subject Characteristics 31
4.2 Total Body Lean Mass, Total Body Fat Mass, 38 BMI and Total Body Weight
4.3 Maximal Isometric Strength Testing 39
vii
LIST OF FIGURES
Figure Description Page
3.1 Sample DXA Image of the Sectioned Elbow Flexors 24
3.2 Sample DXA Image of the Full Body 25
3.3 Sample Seated Dumbbell Biceps Curl 27
3.4 Sample Isometric Maximal Voluntary Contraction 29
4.1 Sectioned Left and Right Elbow Flexors Muscle Mass 33 of Participant’s at Pre and Post Training Time Points
4.2 Differences in Elbow Flexor Mass from Pre to Post 34 Intervention
4.3 Differences in Elbow Flexor Fat Mass from Pre to Post 35 Intervention
4.4 Differences in Total Body Lean Mass from Pre to Post 36 Intervention
viii
LIST OF APPENDICES
Appendix Description Page
A DXA Screening Questionnaire 60
B Ethics Approval Form 61
C Isometric Strength Data Collection Sheet 62
ix
LIST OF ABBREVIATIONS
I: Type One Muscle Fiber
IIA: Type Two Muscle Fiber (oxidative)
IIB: Type Two Muscle Fiber (less oxidative than IIA)
IIX: Type Two Muscle Fiber (Mixed between IIA and IIB)
1-RM: One Repetition Maximum
ADP: Adenosine Di-Phosphate
ATPase: Enzyme decomposition of Adenosine Tri-Phosphate to Adenosine Di-Phosphate
ATP: Adenosine Tri-Phosphate
BFRT: Blood Flow Restriction Training
Ca2+: One molecule of Calcium
DB: Dumbbell
DXA: Dual Energy X-ray Absorptiometry
FG: Fast Glycolytic
FT: Fast Twitch Muscle Fiber
FOG: Fast Oxidative Glycolytic H+:
Hydrogen Ions iEMG: Integrated
Electromyography IGF-1: Insulin
Like Growth Factor 1
MVC: Maximal Voluntary Contraction
MPS: Muscle Protein Synthesis
MRI: Magnetic Resonance Imaging
MU: Motor Unit
NO: Nitric Oxide
NOS-1: Nitric Oxide Synthase
Pi: Inorganic Phosphate
RPE: Rate of Perceived Exertion
SM: Skeletal Muscle
SO: Slow Oxidative
Chapter 1
INTRODUCTION
The human body is made up of numerous adaptable systems that work in unison in order to sustain homeostasis. One major system is the musculoskeletal system. The musculoskeletal system consists of approximately 680 muscles. There are three types of human muscle which include; skeletal, cardiac and smooth muscle. All three types aid in different and vital roles within the human body. Skeletal muscle is responsible for the support as well as the movement of the body and is an essential component to survival. A sarcomere is a basic unit of skeletal muscle. Inside each sarcomere are contractile protein units, actin and myosin. The inclusion of the contractile proteins as well as myofibrils constitutes a sarcomere (Kraemer, Ratamess, & French, 2011). Within a sarcomere, intramuscular proteins can undergo numerous cascading reactions that lead to muscular contractions and hypertrophy. A muscle contraction allows each muscle to act as a mechanical mover. It is through the lengthening and or shortening of the protein units that permits muscle to function as a mechanical mover. It does this by pulling on tendons that are attached to bones. The torque created from a muscle contraction can then amount to movement around the joint (Alexander, 1991).
A muscle fiber is a single cylindrical cell and each individual muscle is made up of thousands of muscle fibers bundled together. Each muscle is wrapped in a protective connective tissue known as fascia, which serves as a compartmentalization tool (Structure of Skeletal Muscle, 2008). The fascia protects the soft and fragile muscle cell and also provides a protected pathway for blood vessels and nerves to run through. Muscle requires a constant supply of blood in order to survive. Blood vessels, in close proximity to the muscle, provide an avenue for nutrient transport as well as waste removal. Muscle is a post-mitotic tissue, meaning, it does not undergo cell replacement throughout life and because of this, there must be a symbiotic relationship between muscle protein synthesis (MPS) and degradation (Schoenfeld, 2010). Furthermore, muscle is constantly interchanging between hypertrophy (synthesis) and atrophy (degradation). Muscle hypertrophy occurs when MPS exceeds protein breakdown (Schoenfeld, 2010). The majority of exercise induced hypertrophy, resulting from strength training, is subsequent from an increase of sarcomeres that are added in parallel. A serial increase in sarcomeres can also result but this type of hypertrophy is less common (Schoenfeld, 2010). Other proposed mechanisms such as cell swelling, sarcoplasmic hypertrophy, and hormone release will be later discussed (section 2.3 and 2.6.1). In order to prevent muscle atrophy, it is common for individuals of all ages and sexes to engage in a strength training program that promotes muscle hypertrophy (Yasuda, Loenneke, Thiebaud, & Abe, 2015).
However, not all contractions involve the shortening or lengthening of a muscle. An isometric contraction is when the muscle does not change in length. To further explain, an isometric contraction is static, meaning the joint angle remains the same throughout the entire exercise (Haff et al., 2005). Maximal isometric strength is a product of the muscles length, where the muscle’s contractile proteins, actin and myosin, are overlapped at an optimal ratio (Haff et al., 2005). Isometric strength training can be added to a dynamic strength training program (Haff et al., 2005).
It is suggested that muscle tension is a primary proposed mechanism for muscle hypertrophy (Abe, Loenneke, & Fahs, 2012). The inducement of muscle tension can be accomplished through varying intensities i.e. loads, of different repetition ranges. Repetition ranges can be classified into three broad categories when strength training: low: one to five, moderate: six to 12 and high: 15 or more repetitions (Schoenfeld, 2010). For the purpose of this research paper, repetition ranges can be further classified by one repetition maximum (1-RM) intensity. Low intensity is categorized between zero to 50 percent, moderate intensity between 50 to 70 percent and high intensity is above 80 percent of an individual’s 1-RM. Research suggests that exercise induced muscle hypertrophy occurs most effectively when the exercise intensity is greater than or equal to 70 percent of an individual’s 1-RM. (Schoenfeld, 2010). It has been shown in previous literature that training within the moderate repetition range can promote muscle hypertrophy (Burgomaster et al., 2003; Dankel, Buckner, et al., 2016; Dankel, Jessee, Abe, & Loenneke, 2016; Laurentino et al., 2008; Schoenfeld, 2013; Scott, Loenneke, Slattery, & Dascombe, 2015). The moderate repetition range has been shown to evoke greater hypertrophy when compared to both low and high repetitions. The hypertrophy detected could be attributed to muscle tension, however, metabolite accumulation, hormone release, neural activation and cell swelling are also proposed mechanisms (Loenneke, Wilson, & Wilson, 2010). Repetitions performed at a lower intensity, less than 60 percent of an individual’s 1- RM, does not seem to generate enough muscle tension to produce gains of the same magnitude (Abe et al., 2012).
Furthermore, specific training exercises can be performed for specific body parts. An example is the dumbbell biceps curl. To perform an elbow flexion exercise, the weights are placed in both hands which are held at the individual’s side with arms straightened. In order to execute the exercise movement, the weights are raised upwards towards the shoulder while the forearm rotates around the elbow joint. Once the dumbbells are past 90degrees, in comparison to the floor, a supination of the forearm is performed. The transition of the palms from neutral i.e. starting position, to supine, is referred to as the concentric action of an elbow flexion. Once the weight has reached the shoulder, the weight is then lowered back to the starting position. The downward movement of the elbow flexion is referred to as the eccentric action. Typically, when elbow flexion exercises are performed at an intensity greater than or equal to 70 percent of an individual’s 1-RM, hypertrophy can occur (Gentil, Soares, & Bottaro, 2015).
avenue for increasing hypertrophy and strength while using a lighter load intensity. Blood flow restriction training (BFRT) was developed to adhere to populations that fit the criteria of needing resistance exercise but cannot attain adequate load or muscle tension.
During the 1990’s, Yoshiaki Sato developed Kaatsu training which was later termed BFRT (Weatherholt, Beekley, Greer, Urtel, & Mikesky, 2013; Flesche, 2014). This form of training is a technique that has been used for more than 20 years. When training with BFRT, the application of a pneumatic cuff is applied to the most proximal end of the muscle being trained (Laurentino et al., 2008; Loenneke, Abe, et al., 2012; Yasuda, Loenneke, Thiebaud, & Abe, 2012; Weatherholt et al., 2013; Dankel, Jessee, et al., 2016). Blood flow restriction training is only used for the extremities of the body. To elaborate, the cuff is wrapped around the entire circumferences of the leg or arm where it is inflated to a pre- determined pressure(Jessee et al., 2016; Dankel et al., 2017). Once the cuff is inflated the exercise can begin. The purpose of cuff inflation during exercise is to allow arterial blood inflow to the working muscle while reducing venous outflow. Exercise with an inflated cuff also allows for the recruitment of additional motor units, which contain fast –twitch (FT) muscle fibers, that would not normally be recruited according to Henneman’s size principle, while working at a reduced exercise intensity (O’halloran, 2014). Inflation pressures can range from 50 to upwards of 200 mmHg when working with BFRT. The cuff typically remains inflated until the required amount of sets and or repetitions are completed (Dankel, Jessee, et al., 2016). However, intermittent cuff inflation where deflation occurs between sets has been used (Laurentino et al., 2008; Teixeira et al., 2017).
Within the literature, the quadriceps muscle is the most common muscle investigated when training with BFRT. The biceps brachii has also been studied but to a lesser extent (Dankel, Jessee, et al., 2016). Training with a reduced load intensity, 20 to 40 percent of an individual’s 1-RM, in combination with BFRT has been shown to increase muscle mass and muscle strength to a similar extent as heavy load training i.e. equal to or greater than 70 percent of an individual’s 1-RM (Dankel, Jessee, et al., 2016; Poveda, Arenas, Ibáñez, García, & Márquez, 2017). Moreover, BFRT has been shown to be effective in increasing strength in the upper extremities, Dankel and colleagues (2016) as well as the lower extremities (Loenneke et al., 2012). However, the majority of BFRT studies have used loads lighter than 50 percent of an individual’s 1-RM, to train acutely or chronically. There are limited studies in the current literature that have attempted to use a heavier load intensity i.e. greater than 65 percent 1-RM, in combination with BFRT (Laurentino et al., 2008; Cook, Kilduff, & Beaven, 2014; Dankel et al., 2017; Teixeira et al., 2017). The gap in the literature provides a unique opportunity to combine BFRT with a chronic moderate intensity strength training program to investigate the effects on muscle hypertrophy and strength.
1.2 Purpose
The purpose of the study was to develop and evaluate the effects of moderate load intensity blood flow restriction training on muscle size and strength of the elbow flexors after a 12 week strength training intervention. Participants will perform an elbow flexion exercise twice per week with the dominant arm occluded at the most proximal end. All participants in the study were right handed, therefore the right arm was trained with blood flow restriction for the duration of the training intervention.
1.3 Objectives
1.To implement a 12 week intervention that combines the use of blood flow restriction training at moderate load intensities, 70 percent one repetition maximum, while performing an elbow flexion exercise.
2.To measure maximal voluntary isometric contractions of the elbow flexors using a Cybex dynamometer at two different time points, pre and post training.
3.To determine anthropometric changes in the composition of the elbow flexors as well as the whole body while using a dual-energy X-ray absorptiometry scan.
1.4 Hypotheses
The following hypotheses were tested:
1.The blood flow restriction trained arm of the participants will have greater muscle hypertrophy than the non-BFRT arm after the 12 week strength training program.
Chapter 2
LITERATURE REVIEW
2.1 Cross- Bridge Theory
Each muscle fiber contains contractile filaments, actin and myosin. In the early 1950’s, an in depth analysis of A-Band dimensions revealed that myosin filaments were not significantly shortened under a plethora of contractile conditions and thus could not account for muscle contraction or the changed length of muscle tissue (Huxley, 1953). However, it has since been proposed that muscle contraction occurs not by shortening of the myosin filaments but due to a relative slide of two sets of filaments, actin and myosin (Huxley & Hanson, 1954). In 1954, Huxley proposed how this relative sliding motion occurred and provided a framework for the now known cross-bridge theory. In the cross-bridge model, contraction and force production of the muscle are achieved by the extension of cross-bridges from the thick myosin filaments which interact intermittently with the thin, actin filaments. The interaction between the two produces a shortening action of the muscle. The regulation of SM force is governed exclusively by the two proteins (Herzog et al., 2015).
2.1.1 Cross Bridge Cycle
Each cycle of attachment and detachment of a cross-bridge is associated with the hydrolysis of one molecule of adenosine triphosphate (ATP) (Herzog, Powers, Johnston, & Duvall, 2015). ATP is responsible for the initiation of the binding process of the contractile proteins (Fitts, 2007). It is the release of inorganic phosphate (Pi) from ATP hydrolysis that cultivates the cross
bridge between actin and myosin. After ATP has been hydrolyzed, the two proteins are transformed into a strongly bound high force state that can undergo a power stroke. The power stroke is the action of the muscle shortening. Fitts (2007) stated that ADP is released after the power stroke has occurred thus allowing the cross bridge complex to return to its original unbound state. When repeated muscle contraction occurs, the up-regulation of lowbound to high-bound states is accelerated by both cytoplasmic Ca2+ and by the number of highbound cross bridges
formed (Fitts, 2007). In regards to ST, moderate to vigorous exercise can induce high rates of ATP hydrolysis within the working muscle which can cause increases in intracellular H+, P
i, and ADP.
The intracellular concentration changes are directly proportional to the exercise intensity used and the muscle fiber type present (Herzog et al., 2015).
2.2 Muscle Fiber Types
on their function and metabolic properties. Fast- twitch glycolytic (FT), fast- twitch oxidative glycolytic (FOG) and slow- twitch oxidative (SO). Each of these three muscle fibers are found within the human body. FT fibers and are classified based on their high amounts of ATP (ATPase) activity. During short intense bouts of exercise, FT muscle fibers hydrolyze and utilize ATP as well as other metabolites in an accelerated manner. FT fiber fuel utilization, in the form of ATP, is also up-regulated in response to contractions that involve maximal shortening velocities (Fitts, & Widrick, 1996). In SO, a contrast appears due to the substantially lower amount activity of ATP hydrolysis, ATPase activity and overall consumption of energy intracellularly when in use (Fitts, & Widrick, 1996).
Research counducted by Bottinelli et al. (1994) revealed a fourth fiber type in adult human SM. The researchers proposed that muscle could be classified into four distinct fiber type categories. The classifications outlined are as followed: I, IIA, IIB, and now IIX. Each fiber type represented includes: I (type I, slow twitch oxidative, SO), IIA (FT oxidative, FOG), IIB (FT glycolytic, FG) and IIX (mixed-FT). In support of Bottinelli’s findings, a review conducted by Schiaffino & Reggiani (2011) stated that they had also discovered a third FT fiber type composition different from IIA and IIB. Type IIX fibers have characteristics similar to those of IIA and IIB fibers, and their resistance to fatigue is intermediate between that of IIA and IIB. Human SM contains a different ratio of each of the four major fiber types which could be due to the functionality of specific muscles. For example in the posterior compartment of the leg where the soleus is located, the majority of muscle fibers are SO. The soleus muscle is typically used over longer durations and at lower exercise intensities, such as when walking. Whereas, the biceps brachii, located on the anterior portion of the proximal arm, contains a mix of type I and type IIA, IIB and IIX fibers, which may be used for faster and shorter exercise movements such as an elbow flexion (Evangelidis et al., 2016). Muscle fibers have different responses to exercise and differ in hypertrophy and strength categories, metabolic demand, fuel usage and metabolic accumulation.
2.3 Skeletal Muscle Hypertrophy
muscle growth. An expansion of the extracellular matrix has been suggested as an avenue to support contractile protein enlargement, thus supporting hypertrophy (Schoenfeld, 2010). Hypertrophy that occurs in series is suggested, however, it is less common. “In-series hypertrophy has been shown to occur when muscle is forced to adapt to a new functional length” (Schoenfeld, 2010). Another possible mechanism for muscle hypertrophy is sarcoplasmic hypertrophy. During sarcoplasmic hypertrophy, it is suggested that growth occurs from an increase in various non- contractile elements and fluids. Because muscle tissue is post mitotic, satellite cells are thought to facilitate hypertrophy in several ways (Schoenfeld, 2010). Through the donation of extra nuclei to muscle fibers, the up-regulation of mRNA production or the expression of myogenic regulatory factors, are proposed mechanisms in which satellite cells promote hypertrophy.
2.3.1 Muscle Hypertrophy and Progressive Overload
As an individual becomes more strength trained, there is a point in time when it is harder to achieve muscular hypertrophy. When this happens, a very common training principle called progressive overload is added to a strength training program. Progressive overload is the addition of extra volume (reps x sets x weight lifted) to the workout in order to provide an augmented stimulus to the muscle. With this principle, it is possible to create additional hypertrophy after an extended amount of time. However, the amount of progressive overload needed to achieve hypertrophy is individualized and not well understood within the literature.
Hypertrophy can occur from repetitive muscular contractions which involve eccentric, concentric or isometric movements. Possible avenues for augmenting hypertrophy take into consideration the enlargement of contractile proteins, a change in the extracellular matrix, satellite cells, myogenic pathways, cell swelling, hypoxia, mechanical tension, muscle damage, metabolic stress and exercise training variables to create additional muscle growth (Schoenfeld, 2010).
Progressive overload can cause increased perturbations in myofibers as well as the expansion of the extracellular matrix. An overload stimulus can provide a cascade effect of myogenic events that can lead to an increase in the size as well as the amount of myofibrillar contractile proteins. From an additional muscle stimulus, the up-regulations of mTOR and MAPK pathways can occur (Schoenfeld, 2010).
2.3.2 Muscle Hypertrophy, and Muscle Fiber Type
significant hypertrophy when compared FT muscle fibers. As muscle fiber CSA increases from I to IIA, IIX and IIB, endurance capacity decreases. Moreover, performing ST within the eight to 12 repetition range, fiber types IIA, IIX and IIB can experience muscular hypertrophy. The size differentiation as well as the hypertrophic effects observed between type I, and IIA, IIX and IIB is not well understood. Wessel et al. (2010) proposed that in SO fibers, the rate of protein degradation and protein synthesis is much greater than in the other muscle fiber types. It is suggested that SO fibers have an increasingly greater rate of MPS in order to maintain equilibrium. In turn, greater protein degradation in SO fibers could be an important factor limiting the size and hypertrophic effects observed while under mechanical tension. Furthermore, insulin like growth factor 1 (IGF-1) concentrations are differentially regulated in both high and low oxidative fibers. IGF-1 stimulates muscle hypertrophy in all four fiber types. However, when training in the moderate repetition range, mechanical loads induce changes in intracellular Ca2+ concentrations and increase expression of growth factors, mainly growth hormone (GH), which could contribute to an increased hypertrophic effect observed in the muscle fibers IIA, IIX and IIB when compared to type I (van Wessel et al., 2010). Specifically, when completing a strength training program, IIA, IIX and IIB fibers have been shown to increase their CSA greater than type I fibers. Another possible explanation for the hypertrophy observed is Henneman’s size principle. If exercise intensity or duration increases, additional muscle fibers are recruited to maintain force output. The order of activation follows the order of, small SO fibers activated first, followed by the activation of larger FT fibers. During moderate repetition range exercises, FT muscles fibers are activated which has been suggested to induce hypertrophy (Schoenfeld, 2010).
2.3.3 Muscle Hypertrophy and Strength Training
In the pursuit of exercise-induced muscle hypertrophy, it has been suggested that one must work with an external load that is approximately 70 percent of an individual’s 1-RM. To elaborate, it has been almost extensively recommended within the literature that strength training must be executed with a moderate to high load intensity to produce hypertrophy (Ozaki, Loenneke, Buckner, & Abe, 2016).
In ST, methods and modalities are often classified according to the type of training exercise performed (Wernbom, Augustsson, & Thomeé, 2007). Training exercises, as previously mentioned can be organized by using an intensity that is measured from calculating an individual’s 1-RM. Fluent throughout the literature, using a repetition range between eight to 12 has been shown to produce beneficial hypertrophy when compared to lower repetition ranges, one to six and repetitions above 15.
were recreationally trained prior to the 12 week training program. McCall et al. (1996) used a three set, 10 repetition training protocol while targeting the biceps brachii. Magnetic resonance imaging (MRI) scans revealed an increase in the biceps brachii muscle CSA (from 11.8 + 2.7 to 13.3 + 2.6 cm2, p < 0.05) after the training program. It was concluded that participants increased hypertrophy in the biceps brachii while training within the moderate repetition range (McCall, Byrnes, Dickinson, Pattany, & Fleck, 1996). The study also found a 25 percent increase in 1-RM preacher curl strength following the training protocol.
2.4 Isometric Strength Compared to Dynamic Strength Training
Maximum strength and power are major factors influencing performance in a variety of sports and activities. A 2010 study investigated the relationship between isometric and dynamic strength in recreationally trained men (Mcguigan, Newton, Winchester, & Nelson, 2010). Each participant was tested for peak force, rate of force development, vertical jump performance and 1-RM strength. Peak force was tested using an isometric mid-thigh pull exercise. A 1-1-RM for the squat and bench press were determined as a measure of dynamic strength. Correlations between exercise variables were calculated using Pearson product moment correlation coefficient. The researchers found that peak isometric force was highly correlated between 1-RM squat (r = 0.97, p < 0.05) and 1-RM bench press (r = 0.99, p < 0.05). It was suggested that isometric peak force testing provides an efficient method for assessing strength in recreationally trained individuals while providing non time intensive data collection (Mcguigan et al., 2010).
Similar results were reported in a study investigating the relationship of maximum strength in weight lifting performance. A 2005 study assessed the relationship of maximum dynamic strength and isometric contractions (Stone et al., 2005). Pearson’s product moment correlation coefficient was used to determine the correlation between dynamic strength during a 1-RM squat and 1-RM snatch when compared to an isometric mid-thigh pull. Researchers found a strong correlation (r = 0.84) between isometric and dynamic strength. It was suggested that when collecting isometric data, maximum strength is strongly related to weightlifting performance which is independent of body mass and height differences (Stone et al., 2005).
2.5 Blood Flow Restriction Training
2.5.1 Blood Flow Restriction Training in Rehabilitation
A 2017 meta-analysis examined BFRT in clinical MSK rehabilitation and found positive results for increasing strength (Hughes, Paton, Rosenblatt, Gissane, & Patterson, 2017). The rehab categories inluded were reconstruction (n=3), knee osteoarthritis (n=3), older adults at risk of sarcopenia (n=13), and patients with sporadic inclusion body myositis (n=1). The analysis revealed that low load BFRT had a moderate effect on increasing strength (p < 0.001). Due to limited data for muscle hypertrophy with BFRT in the aforementioned rehab categories, the focus of the meta-analysis remained only on muscular strength (Hughes et al., 2017).
A study involving rehabilitation patients used BFRT to investigate the size of thigh muscles in patients who underwent reconstructive ACL surgery. Between day three and 14 postoperation, BFRT was used on the quadriceps. Results showed thatwithout a BFRT stimulus, the CSA of the knee extensors and flexors decreased by (20.7 + 2.2%) whereas the BFRT leg decreased less, by (9.4 + 1.6%), (Takarada, Takazawa, & Ishii, 2000). Thus implementing BFRT with low-load, suggested an attenuation of muscle atrophy post-operation of more than 100 percent.
2.5.2 Low Load Intensity Blood Flow Restriction Training: Biceps Brachii Muscle Hypertrophy
extremity strength could be made (Lowery et al., 2014). According to Dankel et al. (2016) results from the meta-analysis are difficult to compare due to unstandardized protocols varying in intensity, volume, duration and frequency for the upper body exercise performed. The sets taken to volitional fatigue were not volume matched and thus limited the ability to compare low-load BFRT to moderate load training (Burgomaster et al., 2003; Moore et al., 2004; Dankel et al., 2016).
2.5.3 Blood Flow Restriction Training and Muscle Failure
Within the current literature, training to volitional muscle failure results in similar MPS responses when compared to low-load BFRT which is independent of load intensity. However, the time it takes to reach muscular fatigue can be manipulated through BFRT. A study looked to determine if knee wraps, in replacement of a pneumatic cuff, could provide a stimulus to decrease time to training failure during a 30 percent 1-RM leg extension exercise (Loenneke, Balapur, Thrower, Barnes, & Pujol, 2012). This study used 20, healthy, individuals in a randomized crossover study. Participants were assigned to a BFRT group or to a control group. It was concluded that the knee wraps provided an avenue for the BFRT group to reach muscular failure quicker than the control group. The number of repetitions until failure was significantly lower (p < 0.001) with BFRT than without (BFRT: 26 + 1.31 vs. control: 36 + 2.54). There were no reported differences between the control and BFRT groups for rate of perceived exertion (RPE). Metabolic stress was measured via whole blood lactate and was greater immediately after muscular failure in the control group when compared to the BFRT group. However, after three minutes post exercise, lactate levels were greater in the BFRT group. Displaying elevated lactate levels three minutes post exercise are similar to the findings conducted by Takarada & Nakamura (2000) in which lactate was also observed to be greater under BFRT exercise conditions. An increase in metabolic pooling post BFRT exercise could be an avenue for muscular hypertrophy (Takarada et al., 2000; Suga et al., 2012).
2.5.4 Blood Flow Restriction Training within the Athletic Population
Blood flow restriction training can further promote muscle hypertrophy in the athletic population. A study looked at the hormonal and inflammatory responses to low load BFRT in a trained male population that performed a leg extension exercise (Takarada, et al., 2000). Blood samples were measured before and after the pneumatic cuff was released from the working muscle to assess metabolite concentrations. Concentrations of GH, norepinephrine, and lactate were considerably elevated under the exercise with BFRT when compared to the exercise without BFRT (Takarada, et al., 2000). The increase in GH concentration is similar to the GH response found when working with moderate load training (Takarada et al., 2000). Training within the moderate repetition range while using short rest periods has also been proposed to increase GH release post exercise. (Takarada, et al., 2000).
2.6 Blood Flow Restriction Hypertrophy: Proposed Mechanisms
As outlined above, BFRT at low-loads can augment muscle hypertrophy and strength in the lower and upper extremities. However, the underlying mechanisms of BFRT are equivocal. A 2010 paper investigated the underlying proposed mechanisms in which BFRT produces its hypertrophic and strength gaining effects. The primary mechanisms include: metabolic accumulation such as lactate, GH release, FT muscle fiber recruitment, MPS through mTOR and MAPK pathways, nitric oxide synthase-1 (NOS-1), myostatin and cell swelling (Loenneke et al., 2010).
2.6.1 Lactate, GH and Metabolic Products
Blood flow restriction has been shown to increase whole blood lactate, plasma lactate and muscle cell lactate after a single bout (Takarada et al., 2000; Loenneke et al., 2012). It has been suggested that an increase in lactate levels is beneficial to GH secretion due to the fact that GH release can be augmented by an acidic intramuscular environment (Loenneke et al., 2010). The accumulation of metabolites may increase cell swelling, increase intramuscular anabolic/ anitcatabolic signalling, and increase muscle fiber recruitment. An increase in the three previously mentioned categories can be beneficial for hypertrophy (Scott et al., 2015).
In contrast, changes in blood lactate are not always a savvy predicative measure of changes in GH secretion. A 2006 study showed that BFRT resulted in a greater GH response than low-load training but no significant changes in blood lactate levels were determined between groups (Reeves et al., 2006). Early evidence has been collected that GH as well as IGF1, play vital roles in growth, development as well as maintenance of muscle (Takarada et al., 2000). Takarada et al. (2000) stated that, although relatively controversial within the literature, current results suggest the intramuscular conditions observed during BFRT could evoke positive effects in potentiating muscle hypertrophy in humans.
A 2003 study investigated the effect of low-load training with and without BFRT on resting metabolites in the biceps brachii (Burgomaster et al., 2003). The study also investigated elbow flexor strength. Eight, healthy, male participants, who took part in aerobic training two to three times per week but had no formal ST experience, completed an eight week intervention. One arm occluded using blood flow restriction while the other arm was not occluded and served as the control. Both arms were volume matched Subjects performed a unilateral biceps exercise using a load equivalent to 50 percent 1-RM. Each workout consisted of three to six sets of eight to 10 repetitions. A final set was performed to volitional muscle failure. Muscle biopsies were obtained before and 72 hour after the final training bout. It was concluded that concentrations of intramuscular glycogen were increased in both groups, however, the BFRT arm potentiated greater metabolic changes; (BFRT arm: 501 + 12; control arm: 452 + 20 mmol.kg-1 dry weight), (p ≤ 0.05). Additionally, resting ATP concentration were lower (p ≤ 0.05) in both arms following the training protocol: (BFRT: 18.2 + 0.6, control arm: 20.5 + 0.5 mmol.kg-1 dry weight), however, the decrease in ATP concentration was larger in the BFRT arm (p ≤ 0.05). Maximal isokinetic and isotonic elbow strength increased after the training and were similar between arms (p < 0.05) (Burgomaster et al., 2003).
2.6.2 Fiber Type Recruitment with BFRT
hypoxic intramuscular environment, in which FT fibers are recruited despite the lower load intensity (Takarada et al., 2000). Increasing training load intensity has been shown to produce greater EMG activity and is associated with an increase in blood lactate concentration, indicating greater muscle metabolic demand. As previously mentioned a rise in blood lactate and H+ ion concentration may also increase GH release enhancing muscle hypertrophy in FT muscle fibers.
2.6.3 mTOR Pathway
Increased rates of MPS help to fuel muscle hypertrophy responses within the human body. The literature suggests that training in the moderate repetition range can have many benefits in regards to up-regulating the mTOR pathway. Less known, are the effects of low and moderate to high load BFRT on the underlying cellular mechanisms of the mTOR pathway. Fujita et al. (2008) investigated whether an acute bout of low-load BFRT would enhance mTOR signalling and stimulate MPS. After the exercise, stable isotope techniques were used to determine phosphorylation status of signalling proteins. Ribosomal S6 kinase 1 (S6K1) phosphorylation, a downstream target of mTOR, increased concurrently with a 46 percent increase in MPS (p < 0.05), (Fujita et al., 2007). These findings suggest that under low-load BFRT conditions, the mTOR pathway is up-regulated which could enhance muscle hypertrophy.
2.6.4 Nitric Oxide Synthase (NOS-1)
2.6.5 Myostatin Gene Expression
Myostatin, also known as growth differentiation factor 8 (GDF-8), is a protein produced and released by myocytes which regulates muscle growth. Myostatin is a negative regulator of muscle growth, and a mutation of this gene can result in overgrowth due to increased cell proliferation. The suggested function of decreasing myostatin is to up-regulate satellite cell activity which has been shown in a study conducted by McCroskery et al. (2003). A 2012 study examined whether muscle hypertrophy and strength responses were changed after a low-load BFRT exercise or high load exercise without BFRT. Both groups were examined for changes in messenger RNA expression of the selected genes involved in myostatin signalling (Laurentino et al., 2012). Researchers found that myostatin mRNA expression was significantly decreased in both high load training and BFRT groups (40 %, p < 0.0004, and 45 %, p < 0.0001, respectively). It was also concluded that BFRT produced similar muscle (CSA), and strength gains when compared to high-load training alone.
2.6.6 Muscle Cell Swelling
In the literature there are situations in which the benefits of BFRT are observed without a large accumulation of metabolites and/or large increases in FT fiber type recruitment (Loenneke, Fahs, Rossow, Abe, & Bemben, 2012). Cell swelling is proposed to be the possible mechanism for the observed muscle hypertrophy. Loenneke and colleagues (2012) suggested that BFRT may be able to induce cell swelling through blood pooling, accumulation of metabolites and/or reactive hyperemia following the removal of the cuff. “Cell swelling is able to inhibit catabolism, shifting the protein balance towards anabolism” (Loenneke, Fahs, et al., 2012). To elaborate, blood pooling caused by BFRT, may be able to shift intracellular and extracellular water balances. An increased pressure gradient which is observed during BFRT would create a greater influx of water into the cell to drive the possible anabolic processes (Leonneke, Fahs, et al., 2012). It is proposed that an increase in cell water volume can create a cascade effect for intracellular signalling wherein G-protein activation, by a currently unidentified tyrosine kinase, can lead to the activation of the mTOR and MAPK pathways.
2.7 Blood Flow Restriction and Cuff Pressure on the Quadriceps
vs. wide: 144 (17) mmHg; (p < 0.001). It was concluded that wider pneumatic cuffs reduce arterial blood flow at a lower pressure than a narrower cuff. (Loenneke, Fahs, et al., 2012). This study provided evidence for both wide and narrow cuffs and the pressures needed to achieve 100 percent reduction in blood flow for the lower extremities. However, the cuff pressures calculated in this study could differ when considering occlusion of the upper body due to differences in arm circumference and arm composition.
2.8 Blood Flow restriction, Cuff Width and Pressure on the Bicep Brachii
A recent study by Laurentino et al. (2016) investigated the influence of different cuff widths on muscle size and strength of the biceps brachii (Laurentino et al., 2016). Eleven, physically active, male participants had their arms randomly divided into two separate conditions. The two groups included, a low-load BFRT with a narrow (5cm) cuff and low-load BFRT group with a wide (10cm) cuff. Muscle mass was measured with MRI. Strength was assessed during a unilateral elbow flexion exercise. In both groups the cuff was inflated up to the point at which the auscultatory pulse was no longer present (Laurentino et al., 2016). Cuff pressure in the narrow (5cm) group was 185 + 31 mmHg. Cuff pressure in the wider (10cm) group was 137 + 11 mmHg. All participants underwent a 12 week training program while performing the exercise at 20 percent of their 1-RM. The blood pressure cuff remained inflated during the entire exercise for both groups and was only deflated after exercise protocol was finished. Total training volume and RPE were measured at the end of each training bout. Post training results showed that elbow flexion 1- RM and CSA significantly increased in both conditions (BFRT + narrow = 13.5% and 9% vs BFRT + wide = 11.9% and 11.2%, respectively). There were no significant differences in the training volume and RPE between conditions (p > 0.05).
2.9 Exercise Intensity and Occlusion Pressure
In 2015, a study investigated the effect of exercise intensity and occlusion pressure after a 12 week intervention (Lixandrão et al., 2015). Specifically, different occlusion pressures were coupled with different exercise intensities to observe changes in muscle size and strength. Twenty-six participants had each leg allocated to two of five protocols. BFRT protocols were performed at either 20 or 40 percent 1-RM with 40 or 80 percent occlusion pressure. The groups were divided as follows; BFRT 20/40, 20/80, 40/40 and 40/80. A fifth and final group was a conventional strength training group which performed exercises at 80 percent 1-RM without BFRT. Maximum dynamic strength and quadriceps CSA were assessed at baseline and after 12 weeks. It was found that, increasing occlusion pressure was effective only at very low exercise intensities for increase hypertrophy. No additional increase in hypertrophy was observed at the higher exercise intensities including the strength training group. Furthermore, exercise intensity played a role in CSA when comparing groups with similar occlusion pressure. Muscle strength was similarly increased across all BFRT groups (12.10 %) but to a lesser extent than training at 80 percent 1-RM with BFRT (21.60 %). It was concluded that BFRT protocols can benefit from higher occlusion pressure i.e. 80 percent, when exercising at very low intensities. The incremental increase of occlusion pressure coupled with heavier weights suggested no added benefit.
As presented, increasing cuff width and pressure does not seem to augment muscle hypertrophy and strength for the upper and lower body extremities while under BFRT conditions. However, cuff pressure can affect study outcomes such as total exercise volume, time until muscular fatigue as well as RPE. During each of the prior three studies, BFRT was applied continuously throughout the exercise and only deflated immediately after the exercise was completed. To build upon this knowledge, studies have investigated whether continuous or intermittent cuff inflation effects muscle hypertrophy and strength.
2.10 Blood Flow Restriction Continuous vs. Intermittent Cuff Inflation
2.10.1 Blood Flow Restriction Continuous vs. Intermittent on Muscle Activation
In 2000, strength training was combined with BFRT to investigate the effects on
muscular activation. Changes in iEMG and plasma lactate concentration were measured during or after an elbow flexion exercise. The cuff was inflated prior to exercise and remained inflated until exercise completion. One set of exercise was performed during the study (Takarada, Takazawa, Sato, Takebayashi, Tanaka, & Ishii, 2000). The mean iEMG and plasma lactate concentration were elevated with an increase in occlusion pressure at low intensity exercise whereas, these variables were unchanged with an increase in pressure at the high load intensity.
Tomohiro and colleagues (2013) explored the effects of continuous and intermittent
BFRT on muscle activation during a unilateral arm curl exercise performed at 20 percent 1-RM (Tomohiro, Yasuda, Loenneke, Ogasawara, & Abe, 2013) . Eight, physically active, participants that had not participated in regular strength training for a minimum of one year prior to the study, performed three different exercise protocols. Within each protocol participants performed multiple sets of unilateral elbow flexion. Each exercise was volume matched. EMG were recorded from the biceps brachii muscle and integrated iEMG were analyzed. During the unilateral elbow flexion exercise, iEMG increased progressively in both the continuous as well as intermittent BFRT groups. Both conditions were greater in muscle activation (p < 0.05) than the control group, without BFRT, at the third and fourth set of exercise. However, there were no differences (p > 0.05) in iEMG between continuous and intermittent BFRT exercise (2.45 and 2.40 times, respectively). Therefore it was suggested that the magnitude of increased muscle activation may be similar between continuous and intermittent BFRT exercise when performed at a high level of cuff pressure. Both BFRT groups had inflation pressures of approximately 160 mmHg suggesting complete occlusion was obtained. This study also provided an important reduction within the literature for examining multiple sets of BFRT under continuous versus intermittent occlusion regarding the upper body musculature which had not been previously studied.
2.11 Blood Flow Restriction Training at Moderate to High-Load Intensities
not significantly increase muscle strength when compared to the control leg; pre 12- RM- (occluded 80.6 + 17.0 vs. control 79.3 + 16.1 kg) compare to post (occluded 108.4 + 17.6 vs. control 108.6 + 18.9 kg). 12- RM and six -RM groups were not significantly different for both muscle hypertrophy and strength between time points. However, muscle hypertrophy and strength, when comparing the same leg, significantly increased after the intervention, muscle CSA (p = 0.005) and strength (p < 0.001) for both groups.
A second study examined the effect of moderate load exercise, 70 percent 1-RM, with and without BFRT on strength, power, repeated sprint ability, as well as acute and chronic salivary hormonal parameters (Cook et al., 2014). Twenty semi-professional, male rugby players underwent a three week training program. Participants were randomized into a BFRT group, in which an occlusion cuff was pressurized to 180 mmHg and worn bi-laterally on the proximal quadriceps only during the exercise, and a control group that trained without occlusion. Five sets of five repetitions of bench press, squat and pull-ups were completed during each training session. The sessions were performed three times per week. It was concluded that greater improvements were observed (BFRT vs control) in bench press (5.4 ± 2.6 vs 3.3 ± 1.4 kg), squat (7.8 ± 2.1 vs 4.3 ± 1.4 kg), maximum sprint time (-0.03 ± 0.03 vs -0.01 ± 0.02 s), and leg power (168 ± 105 vs 68 ± 50 W). Greater exercise-induced salivary testosterone and cortisol responses were observed in the BFRT group. However, the acute cortisol increases were attenuated across the training block (Cook et al., 2014). It is suggested that the intermittent application of the pneumatic cuff to the lower extremities enhanced upper body strength, as seen in the bench press. The phenomena is suggestive of a systemic mechanism that is not limited to localized hypoxia or metabolic accumulation. In a previous study conducted by (Madarame et al., 2008), they demonstrated a cross transfer effect similar to that found by Cook et al. (2014). However, Fahs et al. (2015) has refuted the idea of a systemic hormonal effect during BFRT.
In 2017, a study investigated whether applying BFRT can augment muscle activation when combining it with traditional moderate load intensity training (Dankel et al., 2017). Ten resistant trained, individuals completed two sets of elbow flexion exercise to volitional fatigue at 70 percent 1-RM. The study design outlined that the control arm rested for three minutes between sets while the experimental arm had a cuff inflated to 180 mmHg and applied for three minutes while still resting. During the second set, the experimental group remained under BFRT conditions while the control arm did not. The BFRT arm completed significantly fewer reps in the second set in comparison with the first set (set 1: 9, set 2: 4), (p < 0.001), whereas no differences were observed in the control arm (set 1: 8, set 2: 7), (P = 0.057). Surface EMG indicated no differences in muscle activation between the BFRT arm and the control arm. However, only two sets of biceps curls were performed and only one set of biceps curls were performed with the pneumatic cuff inflated.
It was concluded that BFRT did not augment additional muscle activation when training at 70 percent 1-RM. No measurements of muscle growth were recorded during the study.
conditions, participants completed three sets of eight repetitions while performing a unilateral knee flexion with 70 percent 1-RM. It was concluded that lactate increased in all three protocols but was greater in the BFRT group that had cuff inflation applied during the rest intervals. There was a decrease in EMG amplitude when observing the second and third sets when compared with the first set wherein the difference in EMG was not significant between the experimental protocols. No measurements for muscle hypertrophy and/or strength were recorded during this study.
Chapter 3
METHODS
3.1 Population and Study Design:
A prospective pre-post one way group study design of nine (n = 9) healthy, highly trained male participants aged 21 to 35 years old were recruited from the Western University population or from local fitness clubs in London, Ontario, Canada was conducted.
3.2 Eligibility
Participants Inclusion:
1. Eligibility was determined by a minimum strength training frequency of two times per week for the previous one year.
2. Participants must have performed at least one exercise per week that directly targeted the elbow flexors.
Participants Exclusion:
1. Participants were excluded if they had a metabolic or bone disorder, 2. had a previous injury to the biceps brachii or surrounding musculature, 3. had a neuromuscular degenerative disorder,
4. or used pharmaceutical supplementation such as anabolic steroids.
5. All participants were instructed to refrain from consuming alcohol 24 hours prior to all visits.
6. Participants were also instructed to not perform any upper body exercises targeting the biceps brachii 24 hours before pre and post testing.
3.3 Outcome Measures
Prior to enrolment in the study, participants were asked to read and sign a letter of information outlining the study details. Participants were also asked to fill out a DXA scan questionnaire to determine if they were eligible to participate (see appendix A). The study protocol was approved by Western University’s Ethics Board for Health Science Research involving human subjects (see appendix B). This study conformed to the Declaration of Helsinki.
ensure all testing protocols were standardized. Both the left and right elbow flexors were tested for isometric strength. Individual’s arms were randomized for order of testing at pre and post time points. Participants then performed three separate isometric holds that targeted the elbow flexors. Each contraction lasted three seconds in duration. Participants rested for three minutes between each MVC. After MVC data was collected, participants underwent a single DXA scan. Participants began the strength training program within five days of completing all baseline tests. All participants in the study were right handed, therefore the right arm trained with blood flow restriction for the duration of the training intervention. Furthermore, participants
completed three sets of 10 repetitions while performing a seated dumbbell biceps curls at approximately 70 percent 1-RM twice per week for the first six weeks of training. During each training session the dominant arm was occluded, at the most proximal end, with the cuff at an inflated pressure of 60 mmHg. The cuff remained inflated during the entire exercise. Blood flow was not manipulated in the non-dominant training arm, however biceps curls were still performed and volume matched to the BFRT arm. At week six of the intervention, participants total workout volume increased by one set for the reaming six weeks of training. After 12 weeks, participants underwent post isometric strength testing as well as completed a second DXA scan. Participants were all tested and scanned within five days of completing the 12 week intervention.
3.4 Anthropometry
Body mass and height were measured using a professional scale 550KL (Health O Meter, Balance Beam Scale) and rounded to the nearest 0.1 pound and nearest 0.1 centimeter for all measurements. Total body weight was converted from pounds to kilograms by dividing the total body weight by 2.2. Both height and weight were measured without foot wear and participants emptied pockets entirely before stepping onto the scale.
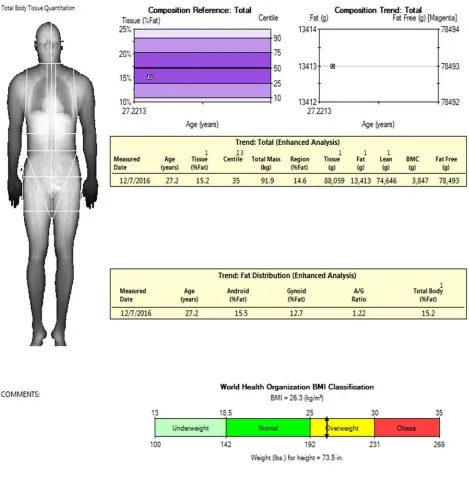
3.5 Dual-Energy X-ray Absorptiometry: Muscle and Fat Mass Image Analysis
Participants underwent two DXA scans, pre and post training. A manual calibration test was completed prior to each participant scan. If multiple scans were performed on the same day, only one calibration test was completed. Participants removed footwear, headwear and emptied pockets before being placed on the scan table. During scan preparation, participants were placed horizontal lying supine with palms placed directly to the side of the body in a prone position. After aligning the body to fit within the boundaries of the scanning table, the participants were instructed to remain motionless until the scan was completed. All DXA scans were conducted by a trained DXA specialist. The same DXA specialist was used for pre and post intervention scans. Each DXA scan lasted no longer than 12 minutes in duration.
measured in cm2 (see figure 3.1) using Lunar iDXA software. The customized area within the outlined box was then used to determine the anthropometric composition of the elbow flexors. Each participant’s proximal upper arm area was standardized by using a cm2 measurement
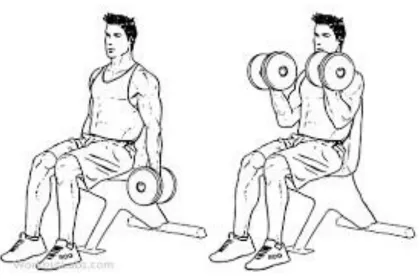
3.6 Strength Training: Seated Dumbbell Biceps Curl
Participants individual 70 percent 1-RM biceps curls were calculated by performing a unilateral 1-RM test, three to five days prior to starting the training protocol. 1 –RM test results were then multiplied by 0.7 to determine the participants 70 percent 1-RM. Participants
performed a warm up prior to 1-RM testing consisting of three sets. The first warm up set was performed with 20 percent 1-RM for 10 repetitions. A second set was performed with 50 percent 1-RM for six repetitions. And lastly, a third warm up set was performed at roughly 70 percent 1RM for four repetitions. All warm up weights were approximated and divided by 60 seconds of rest. During the 1- RM test, it was deemed a successful biceps curl if a full range of motion (ROM) was completed (see figure 3.3). The curl must have travelled a full ROM of 170 to 180 degrees. All 1- RM testing was supervised by a certified personal trainer.
In the subsequent intervention workouts, participants then engaged in three sets of 10 repetitions of a seated dumbbell biceps curls for weeks one to six. At week six, participants performed four sets of 10 repetitions for the remaining six weeks. The elbow flexion exercise was performed twice per week at the start of the participant’s workout. The introduction of an additional set was to provide a progressive overload stimulus to the muscle. Additionally, a new 70 percent 1-RM was obtained via the identical one repetition maximum testing used in pre intervention testing. Each training session was separated by a minimum of 48 hours.
During the training program, participants were instructed to aim for 10 repetitions per set. However, if muscular failure occurred in the BFRT arm before ten repetitions was reached, the exercise was terminated for both arms to control for total workout volume. If participants were unable to reach a minimum of eight repetitions for a single set, the weight was decreased by two and a half percent. In the following sets, the lower calculated weight was then used. Participants with the ability to perform more than 10 repetitions per set increased the elbow flexion weight by two and a half percent for each successive set. After each set, a timer was activated to monitor the rest periods. A rest period of 90 seconds was completed between each set. During the rest period, participants were instructed to remain seated but not obligated to hold onto the weights. After each set, the cuff pressure was checked manually to maintain a consistent 60 mmHg throughout the entire exercise. After all sets were completed, the cuff was then deflated and normal blood flow resumed in the participants BFRT arm. Additional workouts of the participants were not recorded. Participants were not permitted to use the cuff more than twice per week or use knee wraps or tourniquets to perform additional BFRT sessions on the lower or upper extremities.
3.7 Cybex Isokinetic Dynamometer: Isometric Strength Testing
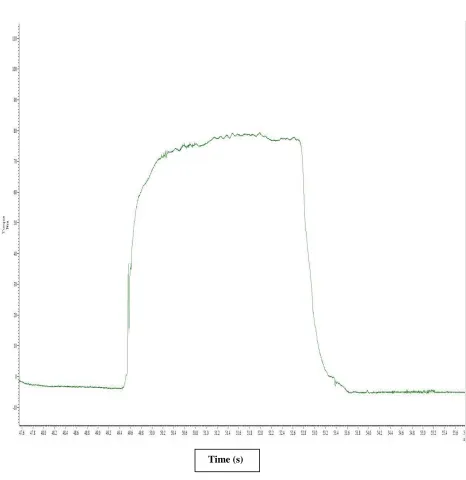
The Cybex Isokinetic dynamometer was used to determine the isometric MVC of the left and right elbow flexors. Participants were individually fitted in the Cybex chair to maintain consistent pre and post measurements. Arm length, drum height, and elbow angle were all individually fitted for each participant. The backrest of the chair was set to 90 degrees and this, however, remained consistent for each participant. The lever arm was measured from the lateral epicondyle of the individual to the straight bar placed in the center of the participant’s hand. The lever arm of the Cybex was situated parallel to the participant’s lever arm during all tests. Joint angle, mentioned as the fulcrum point, was measured from the acromioclavicular joint intercepting at the lateral epicondyle to the styloid process of the radius. The lever arm was then manipulated to produce a joint angle of 90degrees for each participant. The testing arm was then placed directly against the back of the seat while the participants remained in an upright position. Joint angle was measured a second time to ensure accuracy. Having the participants arm placed directly against the back of the seat was done to make sure that the force generated during the contraction would be directly related to the elbow flexors and not to external forces. The elbow joint of the participants were height matched and directly parallel to the fulcrum of the Cybex drum for all tests. Lastly, subjects were buckled in to ensure safety while performing the contractions. After all the settings were confirmed and deemed correct, participants began the isometric strength testing protocol. Participants performed three separate isometric MVC’s on each arm wherein each contraction lasted three seconds in duration (see Figure 3.4). Between each MVC, participants rested for three minutes while remaining seated. Identical procedures for both the left and right arm were used. All three MVC were performed on the same arm before switching sides. Arm selection was randomized to decide which arm would be tested first for pre and post testing. For testing reliability each MVC was measured in newton meter’s (Nm) and rounded to the nearest 0.1. It was determined that an isometric contraction was reported as an individual’s maximum if, two out of the three MVC’s were within five percent of each other. The highest value was then recorded. Lastly, all isometric strength training sessions were conducted and supervised by the same individual.
Figure 3.4. Sample isometric maximal voluntary contraction (MVC) of the elbow flexors measured in Nm. The Y- axis represents force in Nm and the X- axis represents time. Each contraction was held for approximately three seconds.
3.8 Doppler Ultrasound Pilot Test for Pneumatic Cuff Pressure
Before the commencement of the BFRT intervention, four, healthy, male participants underwent Doppler ultrasound testing to determine a cuff pressure that created a 50 percent reduction in resting blood flow of the brachial artery. Resting blood flow was measured by having the participants in a seated position with their right arm extended forward and rested on a table. The pneumatic cuff was then placed around the most proximal portion of the biceps brachii. Once the cuff was in place, the ultrasound probe was then used and placed on the brachial artery. For the entirety of the test, the probe remained on the brachial artery. The test began by measuring resting blood flow of the brachial artery for one minute with zero mmHg inflated into the cuff. The cuff was then inflated in increments of 20 mmHg. Following each successive 20 mmHg incremental increase, blood flow was assessed and recorded for one minute to allow any physiological changes in blood flow to be detected. Cuff pressure was increased until a blood flow reduction in the brachial artery of 100 percent was achieved. Doppler ultrasound unit (GE Vingmed, System Five) was used. A 4-5 MHz probe was also used to determine resting blood flow of each participant. The pneumatic cuff used during the pilot test was the same cuff used during the study. Two out of the four pilot test volunteers participated in the BFRT program. Lastly, the cuff used was a dual port, five centimeter width Easi-Fit tourniquet cuff 18’ (Medical Innovations Inc).
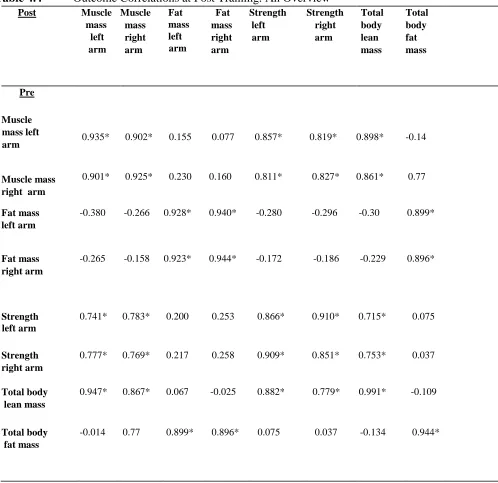
3.9 Statistical Analysis
All statistical analysis were conducted using RStudio and R software (version 2.13.0). Paired t-tests were used to determine within group differences for baseline elbow flexor muscle mass, right elbow flexor muscle mass differences between pre and post training, left elbow flexor muscle mass differences between pre and post training and differences between left and right elbow flexor muscle mass pre and post training. A total of four independent paired t-tests were used to analyze elbow flexor muscle mass. Paired t-tests were also used to determine within group differences for baseline biceps fat mass and differences between left and right elbow flexors fat mass pre and post training. Additional paired t-tests were used to determine within group differences between pre and post training for total body lean mass and total body fat mass. Pearson’s product moment correlation was used to test for correlations between, elbow flexors muscle mass, elbow flexors fat mass, isometric arm strength, total body muscle mass, and total body fat mass. All tests were two tailed, and were considered significant when p values were less than 0.05. Data is reported as mean + standard deviations.