ISSN 2286-4822 www.euacademic.org
Impact Factor: 3.1 (UIF) DRJI Value: 5.9 (B+)
Performance of Indian Economy
During 2004 to 2013: An Empirical Analysis
Dr. DIPTI RANJAN MOHAPATRA
Associate Professor (Economics) School of Business and Economics
Madawalabu University Post Box: 407, Bale Robe, Ethiopia
Abstract:
Key words: Gross Domestic Product, Net State Domestic Product, time-series data, growth rate, sector performance, growth scenario
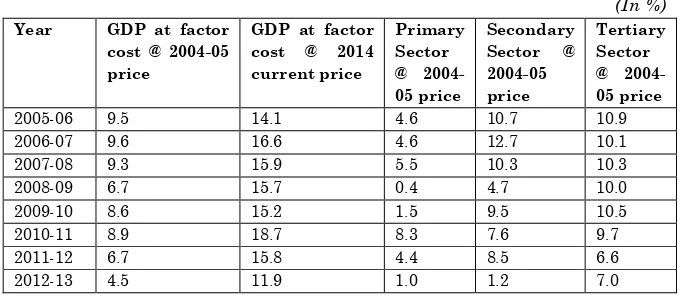
Indian economy achieved a very high growth rate of 9% and above during 2004-2008. This growth phase also performed good changes in all macro-economic indicators. After the onset of 2008 bubble burst crisis there was a setback to this growth spiral. Growth rate was high initially because of large pump of money by government to maintain a stable monetary and fiscal policy on the domestic front. However this growth spiral could not be continued for long, rather there was widening of current account and fiscal deficit in the post crisis period especially in 2012-13 with the recurrence of high consumer level inflationary pressure and slowing down of private corporate investment. The growth rate declined in the subsequent years. The data of declined GDP growth rate and sector’s growth rate of India during 2005-06 to 2012-13 is presented in Table 1.
Table 1: Growth Rate (India) (In %)
Year GDP at factor cost @ 2004-05 price
GDP at factor cost @ 2014 current price
Primary Sector @ 2004-05 price
Secondary Sector @ 2004-05 price
Tertiary Sector @ 2004-05 price
2005-06 9.5 14.1 4.6 10.7 10.9
2006-07 9.6 16.6 4.6 12.7 10.1
2007-08 9.3 15.9 5.5 10.3 10.3
2008-09 6.7 15.7 0.4 4.7 10.0
2009-10 8.6 15.2 1.5 9.5 10.5
2010-11 8.9 18.7 8.3 7.6 9.7
2011-12 6.7 15.8 4.4 8.5 6.6
2012-13 4.5 11.9 1.0 1.2 7.0
Fig.1: Growth of GDP of India (2005 to 2012)
Twelfth Five-Year Plan (2012-2017) projected a growth target (moderated) of 8.0%. However, observing the current declining growth trend there is a big question mark on feasibility of achieving the above-mentioned target. What is the feasible growth rate in the coming decade? Whether the growth rate forecasted by Planning Commission and/or professional economists will be realized or there will be variations? If at all there is any variation to what extent? Is it smaller or wider? What empirical observations say? Thus, there are many questions arises. In this paper is an attempt to answer back the above question on the basis of moderation of future growth process in India through an empirical analysis.
2.0 Review of Literature:
thus the overall growth process. The growth rate is indicators of poverty planning, attracting FDI investment and in nutshell, creating a cycle of boom and optimism in the domestic economy.
World Bank (2013) estimate indicates that the potential growth of developing economies during 2012 to 1015 will be restricted at 5.5 %. This slower growth process in the post- bubble burst crisis will have impact on Indian economy and the potential growth will be squeezed off. Many of the macro-economic variables including the wide -fiscal deficit and inflations in India follow global patterns in the post-crisis period. However, the degree of growth slowdown of Indian economy is a matter of concern. This may be due to domestic mis-alignment of certain macro-economic variables and policies. World Bank estimate indicates that the potential growth of developing economies during 2012 to 1015 will be restricted at 5.5 %. This slower growth process in the post- bubble burst crisis will have impact on Indian economy and the potential growth will be squeezed off. Many of the macro-economic variables including the wide -fiscal deficit and inflations in India follow global patterns in the post-crisis period. However, the degree of growth slowdown of Indian economy is a matter of concern. This may be due to domestic mis-alignment of certain macro-economic variables and policies.
constant prices. Post bubble burst crisis resulted in fall in demand globally although there has been a balancing of current account deficit and GDP in many advanced and emerging market economies (EMEs). The currencies depreciated in advance economies while the appreciated in EMEs. The decline in global growth rate along with high current account deficit adversely affected the growth scenario in India. India suffered from high level of current account deficit and fiscal deficit.
latter because of the perception of initial high inflationary pressure was due to high food prices in India, failure to gauge the high level of domestic demand along with high level of uncertainty around globe (RBI,2012). This was contrary to monetary and fiscal stimulus of 2008-09 periods. The revenue deficit in the domestic market around this period was due to higher allocation on MNREGA (Mahatma Gandhi National Rural Employment Guarantee Act) and higher food subsidies.
3.0 Objectives of the Paper:
The objective of this paper is to find out the performance of Indian economy during the period 2004 to 2013 and to moderate the future GDP growth rate of the country for the period 2014 to 2024.
4.0 Methodology:
i. Past Performance: The past performance of the Indian economy has been studied by analyzing time series data on GDP and income originating from the main economic sectors. The growth rate for different time periods have been worked out from regression equations fitted to time series data of sector’s income.
The two other growth scenarios are:
(a) Low growth rates- Pessimistic Scenario (15% Less growth than medium scenario)
(b) High growth rates- Optimistic Scenario (7.5% more growth than medium scenario)
5.0 Data Used:
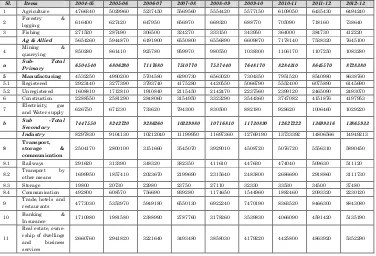
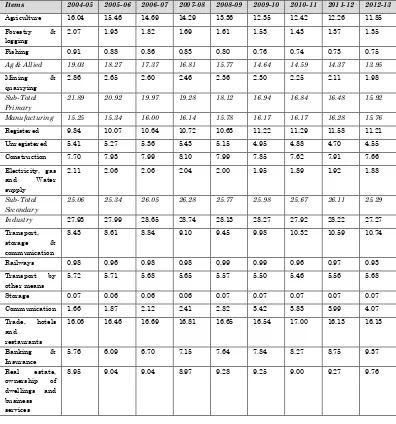
We have used Central Statistical Organization of India’s data on gross value added by various economic activities to the GDP during the period 2004-05 to 2012-13 at 2004-05 constant prices for our analysis of past performance of Indian economy. This data is presented in Table 2. The composition of various sectors during the above-mentioned time period in percentage is presented in Table 3.
Table 2: Gross Value Added by Economic Activity (@2004-05 Constant Price in Millions of Indian Rupees)
Sl. Items 2004-05 2005-06 2006-07 2007-08 2008-09 2009-10 2010-11 2011-12 2012-13
1 Agriculture 4766340 5029960 5237450 5569560 5554420 5577150 6109050 6435430 6494240
2 Forestry &
logging 616400 627420 647950 656970 669320 688770 705090 718160 738640
3 Fishing 271520 287490 306500 324270 333150 343950 364000 384730 412220
Ag & Allied 5654260 5944870 6191900 6550800 6556890 6609870 7178140 7538320 7645100
4 Mining quarrying & 850280 861410 925780 959970 980550 1038300 1106170 1107250 1083280
a Sub- Primary Total 6504540 6806280 7117680 7510770 7537440 7648170 8284310 8645570 8728380
5 Manufacturing 4532250 4990200 5704580 6290730 6563020 7304350 7951520 8540980 8638760 5.1 Registered 2923440 3277390 3793740 4175280 4420550 5066790 5552400 6075890 6145690 5.2 Unregistered 1608810 1712810 1910840 2115450 2142470 2237560 2399120 2465090 2493070 6 Construction 2288550 2581290 2848060 3154950 3323290 3544360 3747082 4151876 4197953
7 Electricity, and Water supply gas 626750 671230 733620 794300 830500 882180 928620 1006460 1029220
b Sub Secondary -Total 7447550 8242720 9286260 10239980 10716810 11730890 12627222 13699316 13865933
Industry 8297830 9104130 10212040 11199950 11697360 12769190 13733392 14806566 14949213
8
Transport, storage & communication
2504170 2800100 3151660 3545070 3929010 4508720 5076720 5556310 5890450
8.1 Railways 291620 313390 348320 382350 411610 447630 474040 509630 511120
8.2 Transport other means by 1699950 1857410 2023670 2199690 2315640 2483800 2686690 2918860 3111730
8.3 Storage 19800 20730 22980 23750 27110 32330 33530 34500 37480
8.4 Communication 492800 608570 756690 939280 1174650 1544960 1882460 2093320 2230120
9 Trade, hotels and
restaurants 4773030 5353970 5949180 6550130 6922240 7470190 8363520 8466300 8843080
10 Banking Insurance & 1710980 1981580 2388990 2787760 3178260 3539830 4066090 4591420 5135190
11
Real estate, owne-rship of dwellings and business services
Sl. Items 2004-05 2005-06 2006-07 2007-08 2008-09 2009-10 2010-11 2011-12 2012-13
12 Public administration 1746380 1822120 1856388 1997734 2393489 2813650 2802680 2921380 3021488
13 Other services 2367230 2582140 2671840 2841440 3051480 3270040 3538990 3731080 3984300
c Sub-Total
Tertiary 15762550 17481730 19239698 21215614 23332509 25781650 28273800 30130410 32226798
14 Gross Domestic Product 29714640 32530730 35643638 38966364 41586759 45160710 49185331 52475296 54821111
Source: Central Statistical Organisation, India August, 2014.
Table 3: Composition of GDP @ 2004-05 Constant Prices (India)
(In %)
Items 2004-05 2005-06 2006-07 2007-08 2008-09 2009-10 2010-11 2011-12 2012-13
Agriculture 16.04 15.46 14.69 14.29 13.36 12.35 12.42 12.26 11.85 Forestry &
logging
2.07 1.93 1.82 1.69 1.61 1.53 1.43 1.37 1.35
Fishing 0.91 0.88 0.86 0.83 0.80 0.76 0.74 0.73 0.75
Ag & Allied 19.03 18.27 17.37 16.81 15.77 14.64 14.59 14.37 13.95
Mining & quarrying
2.86 2.65 2.60 2.46 2.36 2.30 2.25 2.11 1.98
Sub-Total Primary
21.89 20.92 19.97 19.28 18.12 16.94 16.84 16.48 15.92
Manufacturing 15.25 15.34 16.00 16.14 15.78 16.17 16.17 16.28 15.76
Registered 9.84 10.07 10.64 10.72 10.63 11.22 11.29 11.58 11.21 Unregistered 5.41 5.27 5.36 5.43 5.15 4.95 4.88 4.70 4.55 Construction 7.70 7.93 7.99 8.10 7.99 7.85 7.62 7.91 7.66 Electricity, gas
and Water supply
2.11 2.06 2.06 2.04 2.00 1.95 1.89 1.92 1.88
Sub-Total Secondary
25.06 25.34 26.05 26.28 25.77 25.98 25.67 26.11 25.29
Industry 27.93 27.99 28.65 28.74 28.13 28.27 27.92 28.22 27.27
Transport, storage & communication
8.43 8.61 8.84 9.10 9.45 9.98 10.32 10.59 10.74
Railways 0.98 0.96 0.98 0.98 0.99 0.99 0.96 0.97 0.93 Transport by
other means
5.72 5.71 5.68 5.65 5.57 5.50 5.46 5.56 5.68
Storage 0.07 0.06 0.06 0.06 0.07 0.07 0.07 0.07 0.07 Communication 1.66 1.87 2.12 2.41 2.82 3.42 3.83 3.99 4.07 Trade, hotels
and restaurants
16.06 16.46 16.69 16.81 16.65 16.54 17.00 16.13 16.13
Banking & Insurance
5.76 6.09 6.70 7.15 7.64 7.84 8.27 8.75 9.37
Real estate, ownership of dwellings and business services
Items 2004-05 2005-06 2006-07 2007-08 2008-09 2009-10 2010-11 2011-12 2012-13
Public administration
5.88 5.60 5.21 5.13 5.76 6.23 5.70 5.57 5.51
Other services 7.97 7.94 7.50 7.29 7.34 7.24 7.20 7.11 7.27
Sub-Total Tertiary
53.05 53.74 53.98 54.45 56.11 57.09 57.48 57.42 58.79
Total- Gross Domestic Product
100.00 100.00 100.00 100.00 100.00 100.00 100.00 100.00 100.00
Source: Central Statistical Organisation, India 2014.
5.1 Explanation of the Data Used:
Primary Sector: The primary sector in India is composed of the contribution that comes from agriculture, forestry and logging, fishing and mining & quarrying. For the analysis purpose we have considered the data of CSO, India at 2004-05 constant prices as presented in Table 2.
Secondary Sector: The secondary sector is composed of the contribution that comes from manufacturing, construction, electricity, gas and water supply. For the analysis purpose we have considered the data of CSO, India at 2004-05 constant prices as presented in Table 2.
Tertiary Sector: The tertiary sector is composed of the
contribution that comes from transport, storage,
communication, trade, hotels and restaurants, banking & insurance, real estate, ownership of dwellings and business services, Public administration and other services. For the analysis purpose we have considered the data of CSO, India at 2004-05 constant prices as presented in Table 2.
data of CSO, India at 2004-05 constant prices as presented in Table 2.
6.0 Data Analysis:
Demographic Features: According to 2011 Census the total population of India was 1, 028.74 million in 2001, which increased to 1,210.85 million by 2011, registering an annual growth rate of 1.64%. The growth rate for male was 1.59% and for female was 1.70 during the above-mentioned decade.
Primary Sector: The contribution of primary sector to GDP is gradually declining. The contribution of this sector to GDP has declined from 22% in 2004-05 16% in 2012-13. The point to point growth of agricultural and allied sector was 3.8 % during the period 2004 to 2012. However the point to point growth of primary sector was 3.7% during the above-mentioned period. The actual growth of primary sector during this period was 1.6% (Table 4). The growth of this sector is abysmally low taking into account the size of population of the country. The productivity of agriculture and allied sector is declining at a faster rate and is the main reason for CPI (Consumer Price Index) inflation. The composition of different sectors of the economy is presented in Table 2 and 3.
Tertiary Sector: There has occurred a slight increase in contribution of this sector to GDP. This contribution has increased from 53% to 59% during the period 2004-05 to 2012-13. The point to point growth of service sector was 9.4 % during the period 2004 to 2012. The actual growth of tertiary sector during this period was 4.0% (Table 4). The composition of different sectors of the economy is presented in Table 2 and 3.
Past Performance: The Gross Domestic Product (GDP) of India at current prices increased from Rs. 29,714,640 million in 2004-2005 to Rs. 93,888,760 million in 2012-2013 registering an average annual growth rate of 15.5 percent over the period. The rate of change in GDP at constant prices is the main economic indicator for measuring the real growth in the economy. NSDP at constant (2004-2005) prices has increased from Rs. 29,714,640 million in 2004-2005 to Rs. 54,821,110 million in 2012-13, thus exhibiting an average annual growth rate of 8.0 percent over this period. The per capita income (PCI) in real terms, a measure of the disposable income and general wellbeing of the people, went up from USD 687 in 2004 to USD 1165 in 2013, at constant (2005 USD) prices registering an
average annual growth rate of 6% (World Bank Country data
for India, 2013). During the 11th Plan period, the Indian
economy witnessed an average annual growth of 8 percent while the GDP growth target during 12th Plan (2012-17) period
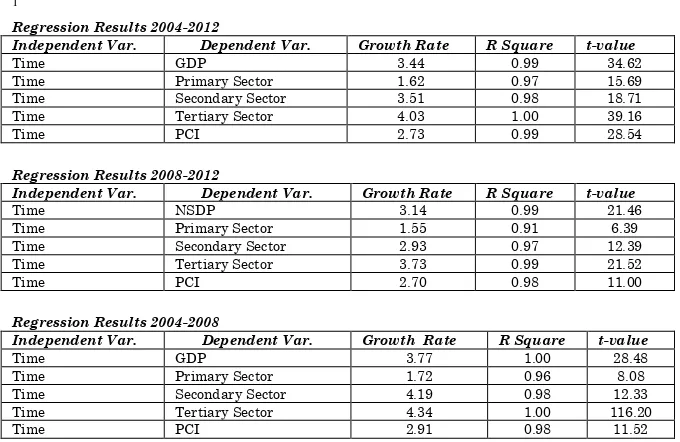
Table 4: Growth Rate
(Regression result of the dependent variables with Time as an independent variable1)
(In %)
Indicators Time Period
2004-2008 2008-2012 2004-2012
GDP 3.77 3.14 3.44
Primary Sector 1.72 1.55 1.62
Secondary Sector 4.19 2.93 3.51
Tertiary Sector 4.34 3.73 4.03
Per Capita Income (PCI) 2.91 2.70 2.73
Population 0.64 0.60 0.62
Source: Calculated from State Domestic Products Data of
Central Statistical Organization, Government of India, August 2014.
The country recorded long term average annual growth rate of GDP at 3.4 %, primary sector grew @1.6%, secondary grew @3.5%, and tertiary sector grew @4.0% during the period 2004
1
Regression Results 2004-2012
Independent Var. Dependent Var. Growth Rate R Square t-value
Time GDP 3.44 0.99 34.62
Time Primary Sector 1.62 0.97 15.69 Time Secondary Sector 3.51 0.98 18.71 Time Tertiary Sector 4.03 1.00 39.16
Time PCI 2.73 0.99 28.54
Regression Results 2008-2012
Independent Var. Dependent Var. Growth Rate R Square t-value
Time NSDP 3.14 0.99 21.46
Time Primary Sector 1.55 0.91 6.39
Time Secondary Sector 2.93 0.97 12.39 Time Tertiary Sector 3.73 0.99 21.52
Time PCI 2.70 0.98 11.00
Regression Results 2004-2008
Independent Var. Dependent Var. Growth Rate R Square t-value
Time GDP 3.77 1.00 28.48
Time Primary Sector 1.72 0.96 8.08
Time Secondary Sector 4.19 0.98 12.33 Time Tertiary Sector 4.34 1.00 116.20
to 20122. The performance of the economy in the short-term was
little better with a GDP growth @ 3.8%, primary sector growth @1.7%, secondary growth @4.2%, and tertiary sector growth @4.3% during the period 2004-2008. The per capita income growth in the long period of 2004 to 2012 was 2.7%, while 2.9% during short period of 2004-2008. The population grew @ 0.6% in both long and short period. The long, medium and short term growth rates obtained during different time periods are presented in Table 4.
The Indian economy has displayed vigorous growth with strong macroeconomic fundamentals in the past. It entered the Eleventh Plan period with an impressive record of economic growth. However, the global recession and tightening liquidity position had its impact on the main economic sectors. The national economy that was witnessing high growth in the past slowed down with economic growth slipping to 4.5% in 2012-13. This growth trend of 4.5% to 5.0% will also continue in the current fiscal year 2014-15. The growth rates of states and union territories of India from 2004-05 to 2012-13 are worked out from regression equations fitted to time series data of the income obtained from different sectors of the NSDP and is presented in Table 5 below. The past growth trend of GDP of India and different sectors as well as the growth of NSDP of different states and union territories are crucial for
2
Growth of Agriculture and Industry (In %)
Year Agriculture and Allied Sector @
2004-05 price Industry @ 2004-05 price
2005-06 5.1 9.7
2006-07 4.2 12.2
2007-08 5.8 9.7
2008-09 0.1 4.4
2009-10 0.8 9.2
2010-11 8.6 7.6
2011-12 5.0 7.8
2012-13 1.4 1.0
determining the future growth targets. This has been taken into account while determining the future growth prospects of Indian economy.
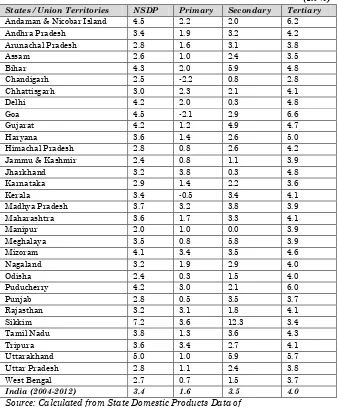
Table 5 Growth of NSDP and Sectors during 2004-05 to 2013-14 (In %)
States / Union Territories NSDP Primary Secondary Tertiary
Andaman & Nicobar Island 4.5 2.2 2.0 6.2
Andhra Pradesh 3.4 1.9 3.2 4.2
Arunachal Pradesh 2.8 1.6 3.1 3.8
Assam 2.6 1.0 2.4 3.5
Bihar 4.3 2.0 5.9 4.8
Chandigarh 2.5 -2.2 0.8 2.8
Chhattisgarh 3.0 2.3 2.1 4.1
Delhi 4.2 2.0 0.3 4.8
Goa 4.5 -2.1 2.9 6.6
Gujarat 4.2 1.2 4.9 4.7
Haryana 3.6 1.4 2.6 5.0
Himachal Pradesh 2.8 0.8 2.6 4.2
Jammu & Kashmir 2.4 0.8 1.1 3.9
Jharkhand 3.2 3.8 0.3 4.8
Karnataka 2.9 1.4 2.2 3.6
Kerala 3.4 -0.5 3.4 4.1
Madhya Pradesh 3.7 3.2 3.8 3.9
Maharashtra 3.6 1.7 3.3 4.1
Manipur 2.0 1.0 0.0 3.9
Meghalaya 3.5 0.8 5.8 3.9
Mizoram 4.1 3.4 3.5 4.6
Nagaland 3.2 1.9 2.9 4.0
Odisha 2.4 0.3 1.5 4.0
Puducherry 4.2 3.0 2.1 6.0
Punjab 2.8 0.5 3.5 3.7
Rajasthan 3.2 3.1 1.8 4.1
Sikkim 7.2 3.6 12.3 3.4
Tamil Nadu 3.8 1.3 3.6 4.3
Tripura 3.6 3.4 2.7 4.1
Uttarakhand 5.0 1.0 5.9 5.7
Uttar Pradesh 2.8 1.1 2.4 3.8
West Bengal 2.7 0.7 1.5 3.7
India (2004-2012) 3.4 1.6 3.5 4.0
Source: Calculated from State Domestic Products Data of
Central Statistical Organisation, Government of India, August 2014.
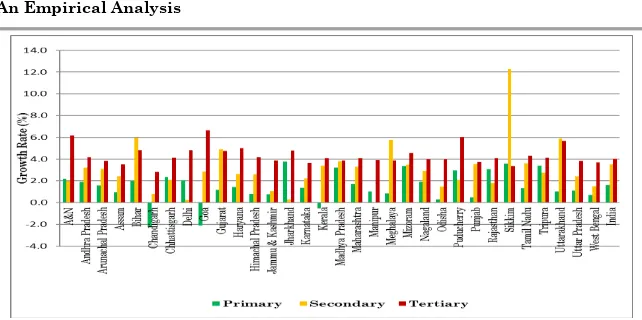
NSDP of twelve states and three union territories are better than the average GDP growth rate of India during 2004 to 2013. NSDP of states such as Bihar, Goa, Gujarat, Haryana, Madhya Pradesh, Maharashtra, Meghalaya, Mizoram, Sikkim, Tamil Nadu, Tripura and Uttarakhand are above the GDP (India) 3.4%. Similarly the NSDP of union territories of Andaman & Nicobar Island, Delhi and Puducherry are also above country average during the above-mentioned period. The growth of primary sectors in ten states and three union territories are above country average of 1.6% during this period. There is negative growth in this sector in the states of Goa and Kerala. Punjab performance is abysmally low in primary sector during this period. Seven states are above country average of 3.5% in the growth of secondary sector. Fourteen states and three union territories are above country average of 4.0% in growth of tertiary sector.
Fig.3: Sector’s Growth of States / UT and India (2004-05 to 2013-14)
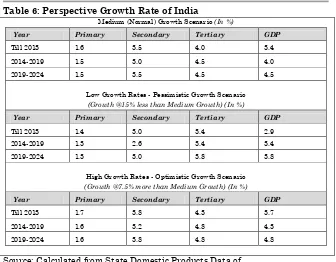
Table 6: Perspective Growth Rate of India
Medium (Normal) Growth Scenario (In %)
Year Primary Secondary Tertiary GDP
Till 2013 1.6 3.5 4.0 3.4
2014-2019 1.5 3.0 4.5 4.0
2019-2024 1.5 3.5 4.5 4.5
Low Growth Rates - Pessimistic Growth Scenario (Growth @15% less than Medium Growth) (In %)
Year Primary Secondary Tertiary GDP
Till 2013 1.4 3.0 3.4 2.9
2014-2019 1.3 2.6 3.4 3.4
2019-2024 1.3 3.0 3.8 3.8
High Growth Rates - Optimistic Growth Scenario (Growth @7.5% more than Medium Growth)(In %)
Year Primary Secondary Tertiary GDP
Till 2013 1.7 3.8 4.3 3.7
2014-2019 1.6 3.2 4.8 4.3
2019-2024 1.6 3.8 4.8 4.8
Source: Calculated from State Domestic Products Data of
Central Statistical Organisation, Government of India, August 2014.
6.0 Conclusion:
states and maintaining a regional equality is desirable. This may be achieved by narrowing the variations of per capita NSDP amongst the states. The interstate difference in rate of investment may be one of the reasons of difference in the growth mechanism among different states. The investment needs to be widening up in the states where it is lagging. This might require creation of adequate infrastructure both physical and social, diversification of central government outlays on priority basis and a well thought policy environment and governance.
REFERENCES:
Ahluwalia, M. S., Economic Performance of States in the Post-Reform Period, Economic and Political Weekly, May 5, 2000.
Central Statistical Organization, Government of India, 2014. Dreze, J. and Sen A., India: Economic Development and Social
Opportunity. Oxford University Press, Delhi, 1995. Kapoor, M., & Mohan, R., India’s Recent Macroeconomic
Performance: An Assessment and Way Forward, IMF Working Paper, WP/14/68, April, 2014.
Lai D., Rakesh M. and Natarajan, I., Economic Reforms and Poverty Alleviation: A Tale of Two Surveys, National council of Applied Economic Research, New Delhi, 2001.
Mohan, R., The Growth Record of the Indian Economy: A Story
of Sustained Savings and Investment, in Rakesh Mohan, “Growth with Financial Stability”, Oxford University Press, New Delhi, 2011.
Nagraj, R., Varoudakis, A., and Veganzones, M.A., Long-run Growth Trends and Convergence Across Indian States, Technical Paper No. 131, OECD Development Centre, 1998.
Nagaraj, R., India’s Dream Run, 2003-08: Understanding the Boom and Its Aftermath, Economic and Political Weekly, Vol. XLVIII, No.20, pp.39-51, May 18, 2013.
Planning Commission of India, 2013.
Rajan, R., The Case for India, Project Syndicate, September 11,
2013, available at
http://www.project- syndicate.org/print/how-to-fix-india-s-economy-in-the-short-term-byraghuram-rajan.
Reserve Bank of India, Macroeconomic and Monetary
Developments: First Quarter Review 2012-13.
Srinivasan, T.N., Economic Reforms and Global Integration, Chapter 7 in Francine Frankel and Harry Harding, eds., The India-China Relationship: What the United States Needs to Know. Washington, DC: Woodrow Wilson Center Press, forthcoming, 2004.