Embedded Resonances for Discrimination of Multiple Passive
Nonlinear Targets Applicable to DORT
Sun K. Hong* and Hong Soo Park
Abstract—This paper presents a method to distinguish multiple passive nonlinear targets, which can be applied to detection and selective wave focusing based on the decomposition of the time-reversal operator (DORT). A recent demonstration of DORT applied to harmonic scattering has shown that passive nonlinear targets (scatterers) can be detected in the presence of linear scatterers and separated into discrete eigenvalues. While DORT is effective in detecting multiple nonlinear targets, it could be difficult to discriminate these nonlinear scatters as their harmonic responses would look similar to each other. Our proposed approach to overcoming this difficulty is based on simply embedding a unique resonant notch in the second harmonic band for each nonlinear scatter, so as to make the notch appear in the associated eigenvalue, permitting identification and discrimination of the scatterer. We numerically demonstrate the basic feasibility of the proposed idea by considering various configurations in a two-dimensional model. The results show that a uniquely embedded resonant notch in a nonlinear target consistently appears in the corresponding eigenvalue of the time reversal operator, allowing it to be a reliable identifying feature. Further investigation into this technique holds promise towards smart wireless power transfer, biomedical, and IoT applications.
1. INTRODUCTION
For detection of multiple scatterers (or targets), utilizing an array-based system can be advantageous as it can provide a complete set of multistatic responses, allowing one to acquire the information necessary for separating the detected scatterers and determining their locations. Our interest here is with the decomposition of the time-reversal operator (DORT), a time-reversal based technique that processes multistatic scattered responses by means of eigendecomposition. With DORT, the detected targets are separated into a set of discrete eigenvalues and their corresponding eigenvectors containing the information related to their locations [1, 2]. Therefore, by feeding the array using the eigenvectors associated with a given eigenvalue, it is possible to selectively transmit waves onto a detected target of interest, either physically for focusing electromagnetic energy at the scatterer or virtually for imaging purposes. For this reason, DORT has been studied for various applications [1–11].
A recent demonstration has shown that DORT can also be applied to detection of passive nonlinear scatterers in the presence of linear scatterers [10, 11]. Nonlinear scatterers refer to electronic devices containing semiconductor junctions which can generate harmonic responses upon excitation. Hence, exploiting the harmonic content in the received signal allows for nonlinear targets to be detected and separated from linear scatters which are considered clutter. Nonlinear detection has been studied for applications such as detection of RF electronics, insect tracking, RFID, temperature sensing, and monitoring of human activities [12–17]. As for DORT applied to nonlinear scatterers, due to its ability to selectively focus electromagnetic energy at a scatter in addition to detection, it could find applications in wireless power transfer where harmonic responses from passive rectifiers can be exploited
Received 17 February 2019, Accepted 17 April 2019, Scheduled 1 May 2019 * Corresponding author: Sun K. Hong ([email protected]).
for detection and subsequent selective focusing (beamforming) to concentrate wireless power at a desired device [10, 11]. Additionally, harmonic detection and selective focusing via DORT may also be used to adaptively send power or information to passive biomedical implants or small sensors for potential IoT applications.
When DORT is applied to nonlinear targets, the eigenvalues appearing in the harmonic bands indicate the presence of nonlinear scatterers in the probed environment. Furthermore, applying pulse inversion (PI) in addition to DORT suppresses the fundamental and odd-ordered harmonics while retaining the even ordered harmonics, thereby rejecting clutter from linear scatterers [11, 18]. PI can be particularly useful when using wideband signals as there may exist some overlap between the harmonic bands. An additional advantage of using PI in a multistatic system is the removal of inter-element coupling which only occurs in the fundamental band, especially at short detection range.
While PI-DORT is effective in detecting nonlinear scatterers and separating them into discrete eigenvalues, discrimination of multiple detected nonlinear scatterers could be challenging. That is, the eigenvalues obtained for two passive nonlinear targets via PI-DORT may look identical in the second harmonic band (even though their eigenvectors differ), rendering it difficult to identify and discriminate one from the other. The ability to identify detected nonlinear targets could be essential for applications where one needs to ensure that the waves are selectively transmitted onto the intended target. An example scenario would be PI-DORT applied to selective wireless power transfer in an environment where multiple passive devices are present, in which case the detected devices must be identified and discriminated from one another to ensure that power is selectively transmitted to the device of interest. In this paper, we propose embedding a unique resonant signature in the second harmonic band for each nonlinear scatter, such that a distinct resonant notch appears in the eigenvalue of each detected nonlinear scatter. Therefore, a given nonlinear target can distinctively be identified and discriminated from other detected nonlinear scatterers. The proposed approach is numerically validated by considering various configurations.
2. PI-DORT
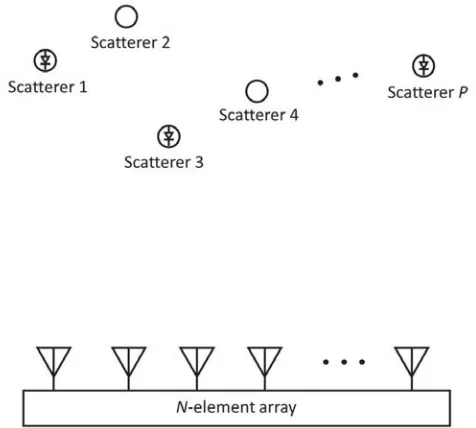
A general scenario considered here consists of an environment with multiple scatterers (linear and nonlinear) probed by a multistatic array system (Figure 1). For anN-element array and P individual well-resolved scatterers (negligible multiple scattering between scatterers), the time-domain multistatic responses can be represented with an N×N matrixR(t), where each matrix elementri,j(t) represents
the response between theith (receive) andjth (transmit) antenna elements. Assuming point scatterers for simplicity of derivation, ri,j(t) is expressed as
ri,j(t) = P
p=1
qp,j(t)∗gi,p(t), (1)
where∗denotes temporal convolution; qp,j(t) represents the response of thepth scatterer due to a pulse transmitted from thejth antenna; andgi,p(t) represents the Green’s function between thepth scatterer and ith antenna element. Here qp,j(t) can be expanded in a power series to account for both linear and nonlinear targets in general, i.e.,
qp,j(t) =
∞
k=1
αk(f(t)∗gp,j(t))k, (2)
where f(t) is the transmit pulse. For nonlinear targets, and αk is ideally nonzero for all values of k, generating scattered responses in the harmonic bands of f(t). For linear targets,αkis nonzero only for
k= 1, thereby producing scattered responses only in the fundamental band of f(t). In Eq. (2),gp,j(t) represents the Green’s function between thepth scatterer andjth antenna element.
For detection of nonlinear responses, pulse inversion (PI) can be utilized to suppress fundamental and odd-ordered harmonic responses, while enhancing even-ordered harmonic responses by twofold. PI is particularly useful in the case of a wideband transmit pulse, where there may exist some overlap between the fundamental and harmonic bands, causing a difficulty in extracting the harmonic responses using a filter. Additionally, PI inherently eliminates any coupling between antenna elements which only occurs in the fundamental band and may be a significant problem particularly at short detection range, since they could inundate scattered responses. PI can be applied by separately transmitting two pulses that are opposite in phase (polarity), but otherwise identical, that is, f−(t) =−f+(t). As a result, the
multistatic responses are obtained as two sets, i.e., R+(t) and R−(t). By taking the sum of these two
sets, we obtain Rs(t) =R+(t) +R−(t), and each matrix element in Rs(t) is expressed as
rsi,j(t) =ri,j+(t) +ri,j−(t) = P p=1 ∞ k=0
2α2(k+1)f+(t)∗gp,j(t)2(k+1)
∗gi,p(t). (3)
where only the even-ordered harmonics are retained and enhanced by a factor of two, while the fundamental and odd-ordered harmonics are eliminated.
DORT is then applied to detect and separate targets in terms of discrete eigenvalues. Since the DORT process is done in the frequency domain, the Fourier transform of the multistatic responses, Rs(ω), is used. The time-reversal operator (TRO) of Rs(ω) is defined as
T(ω) =Rs†(ω)Rs(ω) (4)
where † denotes the conjugate transpose representing time-reversal in the frequency domain. The eigendecomposition of T(ω) should yield
T(ω) =V(ω)Λ(ω)V†(ω), (5)
with Λ(ω) being a diagonal matrix representing the eigenvalues of T(ω). Since T(ω) is an Hermitian matrix, its eigendecomposition can be done through the singular value decomposition of Rs†(ω) and Rs(ω), that is,
Rs†(ω) =V(ω)Σ†(ω)U†(ω)
Rs(ω) =U(ω)Σ(ω)V†(ω) (6)
where V(ω) and U(ω) are unitary matrices representing the singular vectors, and Σ(ω) is a diagonal matrix containing the singular values. Substituting (6) into (4), (5) becomes
T(ω) =V(ω)
Σ†(ω)Σ(ω)
where Λ(ω) = Σ†(ω)Σ(ω) and therefore λi(ω) = σi2(ω). Since DORT is applied to Rs(ω) after PI in this case, λi(ω) should in principle only be associated with nonlinear targets with nonzero values only in the even-ordered harmonic bands. Therefore it should be noted that the content of λi(ω) is not linearly scalable and should represent the scattered responses of the corresponding nonlinear target for a particular case of transmit pulse (amplitude, pulsewidth and shape). Each column vi(ω) in V(ω) contains the eigenvectors of the corresponding eigenvalue, representing the phase conjugated Green’s functions between the array elements and the associated scatterer. One can then usevi(ω) to generate a set of signals for selective focusing (or beamforming) to concentrate electromagnetic waves at a desired target. Such a set of signals is expressed as
xi(ω) =kσi(ω)vi(ω), (8) where k is a scalar constant representing signal amplification. The amplitude and phase ofxi(ω) at a particular frequency can be used for phasing the array, or a set of time-domain pulses can be generated by means of the inverse Fourier transform ofxi(ω) over a specified bandwidth, i.e.,
xi(t) =F−1{kσi(ω)vi(ω)}. (9)
As shown above, PI-DORT can separate detected nonlinear scatterers into discrete λi(ω) and the correspondingvi(ω) to provide the information regarding the location of each detected nonlinear target to allow selective focusing. However, apart from the target locations, identification and discrimination of one target from another remains a challenge as the spectral shape of λi(ω) (or σi(ω)) would look similar between the targets exhibiting similar passive nonlinear characteristics.
3. EMBEDDED RESONANT NOTCH AS A DISTINGUISHING FEATURE
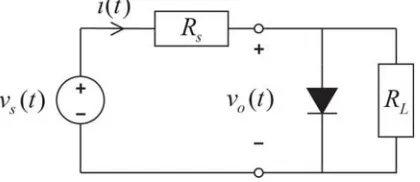
Here we describe the basic concept of the proposed idea of embedding resonances for nonlinear target discrimination using a circuit model consisting of a simple diode (Figure 2) to represent a passive nonlinear scatterer. It is to be noted that the diode model and circuit parameters used here may not represent an actual nonlinear device used in practice, but are chosen for simplicity of describing the concept without loss of generality. Such a circuit in the figure may roughly represent an antenna terminated with a nonlinear circuit (e.g., rectifier to be used in wireless power transfer applications), wherevs(t) corresponds to the induced voltage at the antenna terminal due to an incident field andRs corresponds to the antenna impedance. The nonlinear (exponential) relation between the voltage and current across the diode can also be represented by means of power series expansion [19, 20], allowing forvo(t) from the model to represent the nonlinear scatterer response qp,j(t) in Eq. (2).
Figure 2. Simple circuit model for a passive nonlinear target.
(a) (b)
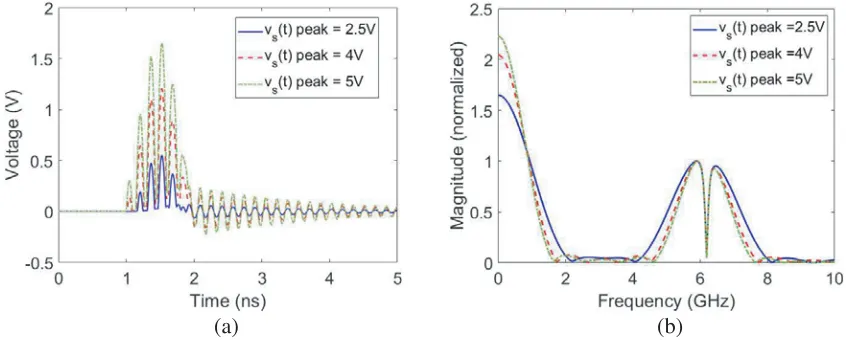
Figure 3. (a) Responsevo(t) and (b) its fourier transform|Vo(ω)|of the diode circuit model in Figure 2 to various amplitude levels of vs(t).
(a) (b)
Figure 4. (a) Pulse inversion sum vso(t) =vo+(t) +vo−(t) and (b) its fourier transform |Vos(ω)|of the diode circuit model in Figure 2 to various amplitude levels of vs(t).
The amount of harmonics (even-ordered) generated invo(t) can be seen more vividly in Figure 4(a), where the pulse inversion sum vso(t) = vo+(t) +vo−(t) is plotted. Figure 4(b) shows the corresponding
|Vs
o(ω)| with their values normalized to the peak around the second harmonic frequency of 6 GHz for a better comparison. While there is a slight difference in bandwidth due to the difference in effective pulse width as observed in Figure 4(a), the frequency content (shape) of the harmonic responses remain generally the same since the level of rectification primarily determines the amount, not the shape, of harmonics generated. This implies that it would be very difficult to distinguish multiple identical or similar passive nonlinear targets.
Now we embed a resonant notch by adding a pair of LC elements to the same nonlinear circuit from Figure 2, where a parallel LC connection is added in series with the source and the branches containing the diode and load as shown in Figure 5. One way to embed such an LC resonance in a practical nonlinear target (e.g., rectenna) is by integrating split-ring resonator-type structures in the target antenna itself [21–23]. TheLC configuration in Figure 5 allows for zero current at resonance, i.e.,
Figure 5. Simple circuit model for a passive nonlinear target with embedded resonant notch.
(a) (b)
Figure 6. (a) Pulse inversion sumvos(t) and (b) its fourier transform|Vos(ω)|of the diode circuit model in Figure 5 designed to have a notch frequency at 6.15 GHz to various amplitude levels of vs(t).
chosen to resonate at fo = 6.15 GHz for the three amplitude levels of vs(t) considered previously. In the time-domain plot (Figure 6(a)), a ringing with the same period is observed for all three cases. In the frequency domain plot (Figure 6(b)), a notch appears at the expected frequency of 6.15 GHz for all three amplitude levels. Since the resonance occurs due to the linear interaction of LC elements, the notch frequency is independent of the amplitude level of vs(t) and nonlinear rectification process, allowing for the embedded notch to be a reliable distinguishing feature for nonlinear targets regardless of their position or distance from the antenna array.
By assigning different sets of LC element values to circuits (targets) considered, a resonant notch unique to each associated circuit can be generated. Figures 7(a) and 7(b) show, respectively, vos(t) and the corresponding|Vos(ω)|for the circuit in Figure 5 designed for three different notch frequencies, namely f1 = 5.7 GHz, f2 = 6.15 GHz and f3 = 6.5 GHz. The period of the ringing in the responses
in Figure 7(a) is different from one another, resulting in different notch positions occuring at the aforementioned resonance frequencies as expected (Figure 7(b)). Due to these uniquely assigned notches, the harmonic responses can now be distinguished from one another with relative ease. It is expected that once each nonlinear scatter is uniquely assigned with a resonant notch, the corresponding eigenvalue
λi(ω) obtained via PI-DORT in the second harmonic band can be distinguishable.
4. NUMERICAL SIMULATION
(a) (b)
Figure 7. (a) Pulse inversion sumvos(t) and (b) its fourier transform|Vos(ω)|of the diode circuit model in Figure 5 designed to have a notch frequency at three different frequencies, i.e., 5.7, 6.15 and 6.5 GHz.
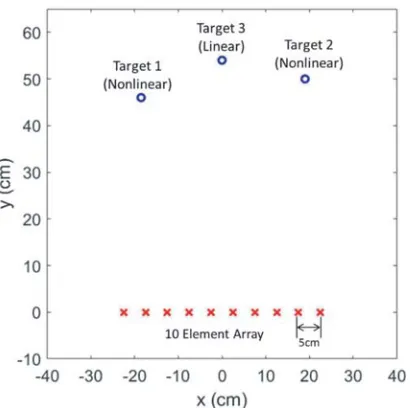
Figure 8. Numerical model used for simulation which consists of a 10-element array and three targets including one linear and two nonlinear targets.
in Figure 8. The elements in the array are modeled as point sources that radiate and receivez-polarized (TMz) electric fields. The targets are modeled as point scatterers in the EM solver, but linked with a SPICE port so that their responses can be calculated via circuit co-simulation using the models introduced in the previous section. For the transmit signal f(t), a Gaussian modulated pulse with a center frequency of 3 GHz and pulse width of 1 ns is used. The frequency band and dimensions of the model are arbitrarily chosen as the purpose of this paper is to demonstrate the basic feasibility of the concept. The frequency band and dimensions can be scaled depending on the intended application. A few representative target configurations are simulated and the results are discussed below.
Figure 9. Singular values obtained from Rs†(ω) of two simple passive nonlinear targets and one linear target.
Figure 10. Singular values obtained fromRs†(ω) of one simple passive nonlinear targets, one notch-embedded nonlinear target and one linear target.
the second harmonic band (around 6 GHz), which means that the responses from Target 3 (linear target) in the fundamental band is suppressed, allowing for detection of nonlinear targets only. As a result, there are only two significant singular values in the plot, namely σ1(ω) andσ2(ω), respectively associated with Target 1 and Target 2. It is also observed that σ1(ω) and σ2(ω) are nearly identical in shape as expected. This configuration may represent the case where all nonlinear targets in the probed environment are “unknown” with similar characteristics. One can still use the corresponding eigenvectors vi(ω) to generate signals for selective focusing on either of the two targets, but without identifying and distinguishing them.
The second target configuration consists of Target 1 as a simple passive nonlinear target (circuit model from Figure 2), Target 2 as a notch-embedded nonlinear target (circuit model from Figure 5), and Target 3 as a conducting linear target. The target locations remain the same as in Figure 8. For Target 2, the LC elements are designed to resonate at 5.7 GHz. In Figure 10, the first four singular
(a) (b)
Figure 11. Spatial plots of the electric field (power level) resulting from: (a) transmittingx1(t) and (b)
transmitting x2(t), for the case of one simple passive nonlinear target, one notch-embedded nonlinear
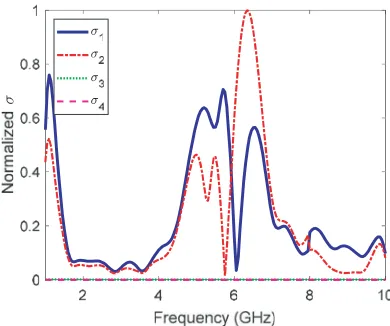
Figure 12. Singular values obtained from Rs†(ω) of one simple passive nonlinear targets, one notch-embedded nonlinear target and one linear target.
(a) (b)
Figure 13. Spatial plots of the electric field (power level) resulting from: (a) transmitting x1(t) and
(b) transmitting x2(t), for the case of two notch-embedded nonlinear targets and one linear target.
values ofRs†(ω) are plotted. Just as in the previous case, only two significant singular values associated with Target 1 and Target 2 are observed in the plot as a result of PI. However, in this case the shape of σ2(ω) is distinctively different from that ofσ1(ω), with a frequency notch observed at the expected
frequency of 5.7 GHz, allowing identification of Target 2 and discriminating it from Target 1. Note that the values of σ2(ω) are generally smaller than that ofσ1(ω), since the notch occurs near the peak
frequency. Nevertheless, it does not affect the shape of the singular values, and therefore identification of Target 2. This configuration may represent the case of a notch-embedded nonlinear target in the presence of an unknown nonlinear target. Selective focusing can then be done by generating x2(t) for
Target 2, which is now “identified”. Figure 11(b) shows the spatial distribution of the electric fields (in power level, i.e., |Ez|2) radiated by feeding x2(t) into the array, at a time instance where the wave
focusing occurs at Target 2. Figure 11(a) shows the spatial distribution of the electric fields (power level) radiated by feeding x1(t) into the array, where it shows that wave focusing is still possible for
“unknown” Target 1.
point target. The target locations remain the same as in Figure 8. For Target 1 and Target 2 the LC elements are designed to resonate respectively at 6.1 GHz and 5.7 GHz. In Figure 12, the first four singular values of Rs†(ω) are plotted. As expected, only two significant singular values associated with Target 1 and Target 2 are observed in the plot as a result of PI. A frequency notch occurs in each of the singular values, i.e., at 6.1 GHz for σ1(ω) and at 5.7 GHz for σ2(ω), which identifies σ1(ω) to be
associated with Target 1 andσ2(ω) associated Target 2, thereby discriminating one from the other. This
configuration may represent the case where all nonlinear targets in the environment are notch-embedded and identifiable. Selective focusing on either of these identified targets can be done by generatingx1(t)
orx2(t) and feeding them into the array. Figures 13(a) and 13(b) show the spatial distribution of the
electric fields (power level) radiated by feeding x1(t) and x2(t), respectively, at a time instance where
the wave focusing occurs at the intended targets.
5. DISCUSSION
The results from the numerical models considered above show that a resonant notch embedded in a nonlinear target does consistently appear in the associated eigenvalue (singular values) from PI-DORT, validating the basic feasibility of the proposed approach of embedding unique resonances as an effective distinguishing feature for identifying multiple nonlinear targets from one another. Further investigation should then involve experimental validation to demonstrate the practical utility of the concept. The following are some important practical aspects that must be addressed:
1) Real antennas used in the array as opposed to point sources: Antenna elements must be designed to have ultra-wide bandwidth, so as to cover both fundamental and second harmonic bands. Moreover, antenna design must be carefully chosen that is free of any unwanted frequency characteristics (i.e., frequency notches or significant ripples), especially in the second harmonics band, which may cause confusion in discerning the frequency response from nonlinear targets. Once the antennas are configured into an array, the elements must be sufficiently spaced to work properly in the second harmonic band without grating lobes. The previous experimental work on PI-DORT reported in [11] validates the importance of antenna element design and element spacing.
2) Required transmit power for exciting harmonic responses from nonlinear targets: In order to excite harmonic responses from a nonlinear target, the incident power at target must be high enough to cause nonlinear behavior at the nonlinear junction. Therefore, in order to ensure detection of harmonic responses from nonlinear targets at a given range, one needs to make sure to use sufficient transmit power. Performing a calculation using the nonlinear radar equation [15] could help determine the appropriate transmit power level to ensure detection of nonlinear targets at a given maximum detection range.
3) Extended targets as opposed to point targets: Practical nonlinear targets have physical extent, which may affect the spectral shape of the frequency response, and also generate additional eigenvalues due to higher modes introduced in the target [11]. How such phenomena affect the resonant notches in the spectrum of the eigenvalues must be evaluated.
4) Multiple scattering due to targets not well-resolved: Closely spaced targets may cause non-negligible multiple scattering that results in additional eigenvalues, which could limit the performance of DORT. An investigation into the effects of nonlinear target spacing on the ability to distinguish them using embedded resonances may be necessary, in order to determine the limitations of the DORT-based approach and find potential ways to overcoming them.
6. CONCLUSION
ACKNOWLEDGMENT
This work was supported in part by a National Research Foundation of Korea (NRF) grant funded by the Korea government (Ministry of Science & ICT) (No. NRF-2017R1C1B5018179).
REFERENCES
1. Fink, M., “Time reversed acoustics,” Physics Today, Vol. 50, No. 3, 34–40, 1997.
2. Prada, C., S. Manneville, D. Spoliansky, and M. Fink, “Decomposition of the time reversal operator: Detection and selective focusing on two scatterers,” Journal of Acoustical Society of America, Vol. 99, No. 4, 2067–2076, 1996.
3. Micolau, G. and M. Saillard, “DORT method as applied to electromagnetic subsurface sensing,” Radio Science, Vol. 38, No. 3, 1038–1049, 2003.
4. Micolau, G., M. Saillard, and P. Borderies, “DORT method as applied to ultrawideband signals for detection of buried objects,” IEEE Transactions on Geoscience and Remote Sensing, Vol. 41, No. 8, 1813–1820, 2003.
5. Yavus, M. E. and F. L. Teixeira, “Full time-domain DORT for ultrawideband electromagnetic fields in dispersive, random inhomogeneous media,” IEEE Transactions on Antennas and Propagation, Vol. 54, No. 8, 2305–2315, 2006.
6. Yavuz, M. E. and F. L. Teixeira, “Ultrawideband microwave sensing and imaging using time-reversal techniques: A review,”Remote Sensing, Vol. 9, 466–495, 2009.
7. Bellomo, L., S. Pioch, M. Saillard, and E. Spano, “Time reversal experiments in the microwave range: Description of the radar and results,” Progress In Electromagnetics Research, Vol. 104, 427–448, 2010.
8. Kafal, M., A. Cozza, and L. Pichon, “Locating multiple soft faults in wire networks using alternative DORT implementation,”IEEE Transactions on Instrumentation and Measurements, Vol. 65, No. 2, 399–406, 2015.
9. Hong, S. K., “Effects of target resonances on UWB DORT,” Journal of Electromagnetic Waves and Applications, Vol. 32, No. 13, 1710–1732, 2018.
10. Faia, J. M., K. W. McClintick, and S. K. Hong, “Application of DORT and pulse inversion to detection and selective electromagnetic focusing on nonlinear elements,” 32nd General Assembly and Scientific Symposium of the International Union of Radio Science (URSI GASS), Montreal, Canada, Aug. 2017.
11. Faia, J. M., Y. He, H. S. Park, E. Wheeler, and S. K. Hong, “Detection and location of nonlinear scatterers using DORT applied with pulse inversion,” Progress In Electromagnetics Research Letters, Vol. 80, 101–108, 2018.
12. Riley, J., A. Smith, D. Reynolds, A. Edwards, J. Osborne, I. Williams, N. Carreck, and G. Poppy, “Tracking bees with harmonic radar,” Nature, Vol. 379, 29–30, Jan. 1996.
13. Colpitts, B. and G. Boiteau, “Harmonic radar transceiver design: Miniature tags for insect tracking,”IEEE Transactions on Antennas and Propagation, Vol. 52, No. 11, 2825–2832, Nov. 2004. 14. Mazzaro, G., K. A. Gallagher, A. R. Owens, K. D. Sherbondy, and R. M. Narayanan, “Ultrawideband harmonic radar for locating radio-frequency electronics,” ARL Technical Report, ARL-TR-7256, Mar. 2015.
15. Mazzaro, G. J., A. F. Martone, K. I. Ranney, and R. M. Narayanan, “Nonlinear radar for finding RF electronics: System design and recent advancements,”IEEE Transactions on Microwave Theory and Techniques, Vol. 65, No. 5, 1716–1726, May 2017.
16. Huang, H., P.-Y. Chen, C.-H. Hung, R. Gharpurey, and D. Akinwande, “A zero power harmonic transponder sensor for ubiquitous wirelessμL liquid-volume monitoring,”Scientific Reports, Vol. 6, No. 18795, 1–4, Jan. 2016.
18. Hong, S. K., V. M. Mendez, T. Koch, W. S. Wall, and S. M. Anlage, “Nonlinear electromagnetic time-reversal in an open semireverberant system,” Physical Review Applied, Vol. 2, No. 044013, 2014.
19. Pulfrey, D. L., Understanding Modern Transistors and Diodes, Cambridge University Press, Cambridge, UK, 2010.
20. Vazques-Leal, H., U. Filobello-Nino, A. Yildirim, L. Hernandez-Martinez, R. Castaneda-Sheissa, J. Sanchez-Orea, J. E. Molinar-Slois, and A. Diaz-Sanchez, “Transient and DC approximate expressions for diode circuits,” IEICE Electronics Express, Vol. 9, No. 6, 522–530, 2012.
21. Si, L.-M., Q.-L. Zhang, W.-D. Hu, W.-H. Yu, Y.-M. Wu, X. Lv, and W. Zhu, “A uniplanar triple-band dipole antenna using complementary capacitively loaded loop,”IEEE Antennas and Wireless Propagation Letters, Vol. 14, 743–746, 2015.
22. Sarkar, D., K. V. Srivastava, and K. Saurav, “A compact microstrip-fed triple band-notched UWB monopole antenna,” IEEE Antennas and Wireless Propagation Letters, Vol. 13, 396–399, 2014. 23. Alshamaileh, K. A., M. J. Almalkawi, and V. K. Devabhaktuni, “Dual band-notched
microstrip-fed Vivaldi antenna utilizing compact EBG structures,” International Journal of Antennas and Propagation, Vol. 2015, 2015.