© 2014, IJCSMC All Rights Reserved 494
Available Online at www.ijcsmc.com
International Journal of Computer Science and Mobile Computing
A Monthly Journal of Computer Science and Information Technology
ISSN 2320–088X
IJCSMC, Vol. 3, Issue. 11, November 2014, pg.494 – 503
RESEARCH ARTICLE
Simulative Investigation of Zigbee Network
Coordinator Failure with Different QoS
Devender
1, Chirag
2, Kuldeep Vats
3,
Deepika Madaan
41 M.Tech, Department of ECE, South Point Institute of Engineering and Technology, Sonepat, Haryana, India
2Assistant Professor, Department of ECE, South point Institute of Engineering and Technology, Sonepat, Haryana, India
3B.E. Honors, M.Tech, Department of Computer Science Engineering, Sonepat, Haryana, India
4
M.Tech, Department of ECE, South Point Institute of Engineering and Technology, Sonepat, Haryana, India
______________________________________________________________________________________________________
Abstract: ZigBee (IEEE 802.15.4-2006 standard) is a category in the IEEE 802 family, is responsible for ZigBee standard which uses the transported services of the 802.15.4 network specification therefore ZigBee is a specification for a suite of high level communication protocols using small, low-power digital radios based on an IEEE 802 standard for personal area networks. In this paper, we perform extensive personal area network evaluation, to study the Effect of coordinators failures on ZigBee Star, Tree network, using OPNET Modeler. The performance is analyzed in terms of control traffic received and sent, throughput, data dropped, network load PAN1 and PAN2
Keywords: IEEE-802.15.4, ZigBee WSN, Topology, MAC Layer, Network Layer, Application Layer, OPNET Modeler, Traffic Received & Sent Throughput, Load, Delay, No. of Hop
________________________________________________________________________________________
INTRODUCTION
© 2014, IJCSMC All Rights Reserved 495
output and environmental characteristics, ZigBee devices can transmit data over long distances by passing data through a mesh network of intermediate devices to reach more distant ones. ZigBee is typically used in low data rate applications that require long battery life and secure networking (ZigBee networks are secured by 128 bit symmetric encryption keys.) It is best suited for intermittent data transmissions from a sensor or input device.[2]
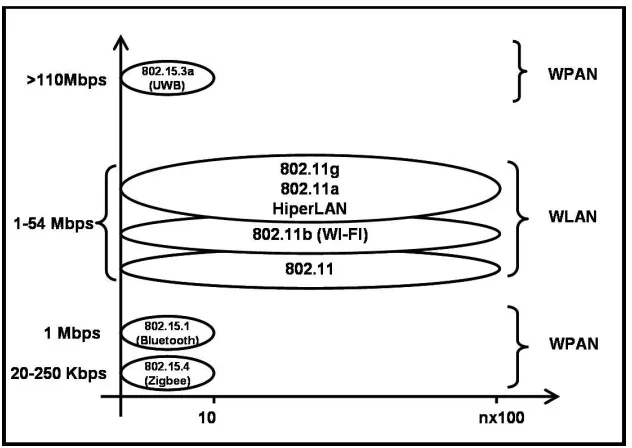
Figure 1 showing WPAN, WLAN, WPAN(Zigbee)
The ZigBee network layer natively supports both star and tree networks, and generic Mesh networking. Every network must have one coordinator device, tasked with its creation, the control of its parameters and basic maintenance. Within star networks, the coordinator must be the central node. Both trees and meshes allow the use of ZigBee routers to extend communication at the network level. ZigBee builds on the physical layer and media access control defined in IEEE standard 802.15.4 for low-rate WPANs. The specification includes four additional key components: network layer, application layer, ZigBee device objects (ZDOs). ZDOs are responsible for a number of tasks, including keeping track of device roles, managing requests to join a network, as well as device discovery and security. [3]
ZigBee devices are of three types:
ZigBee Coordinator (ZC): The most capable device, the Coordinator forms the root of the network tree and
might bridge to other networks. There is exactly one ZigBee Coordinator in each network since it is the device that started the network originally (the ZigBee light link specification also allows operation without a ZigBee Coordinator, making it more usable for over-the-shelf home products). It stores information about the network, including acting as the Trust Center & repository for security keys.
ZigBee Router (ZR): As well as running an application function, a Router can act as an intermediate router,
passing on data from other devices.
ZigBee End Device (ZED): Contains just enough functionality to talk to the parent node (either the
© 2014, IJCSMC All Rights Reserved 496
a significant amount of the time thereby giving long battery life. A ZED requires the least amount of memory, and therefore can be less expensive to manufacture than a ZR or ZC.[4,5]
Figure 2 Generalized ZigBee Network[6]
OPNET SIMULATOR
OPNET simulator is a tool to simulate the behavior and performance of any type of network. The main difference with other simulators lies in its power and versatility. This simulator makes possible working with OSI model. OPNET 14.5 is designed for modeling communication devices, technologies, protocols and to simulate the performance of these technologies. User can create customized models and simulate various network scenarios. It is possible to simulate various wireless communication technologies such as MANET, 802.11, 3G/4G, Ultra Wide Band, WiMAX, Bluetooth, ZigBee using OPNET tool.[7]
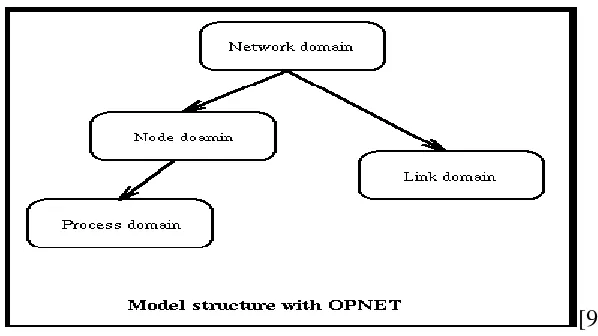
Opnet modeler is based on the Three-Tiered OPNET Hierarchy.
• Three domains: network, node, and process
• Node model specifies object in network domain
• Process model specifies object in node domain[8]
© 2014, IJCSMC All Rights Reserved 497
[9]
Figure 3 Model structure with Opnet
SIMULATION INFRASTRUCTURE AND SCENARIOS FOR FAILUR OF COORDINATER, ROUTER & END DEVICES
Figure 4 Network Model
Table 1
Network Model No. of
Coordinates
No. of Routers No. of End Devices
Failure & Recovery Devices
Personal Area Network 1
1 4 9
1 Personal Area
Network 2
© 2014, IJCSMC All Rights Reserved 498 Simulation Parameter Setup
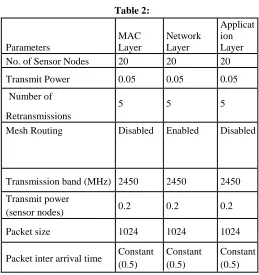
Table 2: Parameters MAC Layer Network Layer Applicat ion Layer
No. of Sensor Nodes 20 20 20
Transmit Power 0.05 0.05 0.05
Number of
5 5 5
Retransmissions
Mesh Routing Disabled Enabled Disabled
Transmission band (MHz) 2450 2450 2450
Transmit power
0.2 0.2 0.2
(sensor nodes)
Packet size 1024 1024 1024
Packet inter arrival time Constant Constant Constant
(0.5) (0.5) (0.5)
Failure & Recovery Setup
Coordinator Failure & Recover Process
© 2014, IJCSMC All Rights Reserved 499 Table 3 :
Parameters Scenario
1
Scenario 2
Scenario 3
Scenario 4
Status
Transmit Power 0.5 0.10 0.15 0.20
Channel Sensing Duration(sec)
0.1 0.1 0.1 0.2 Active
Coordinates_0(Sec) 120 100 300 420 Fail
Coordinates_0(Sec) 240 200 500 640 Recover
Coordinates_1(Sec) 480 400 700 880 Fail
Coordinates_1(Sec) 600 500 900 1160 Recover
SIMULATION RESULTS
Here, We are analyzing the two Personal Area Network(PAN1) & Personal Area Network(PAN2), their failure & recovery process. We focus on performance measures Traffic Received & Sent, Load, Delay, Data dropped, Throughput and End-to-End Delay and retransmission attempts.
Control Traffic Received
Traffic received is the average number of packets per second forwarded to the MAC layer in the network . Below figure using IEEE 802.15.4 standard show the results of traffic received in difference scenario and we can clearly see the result as the transmit power and channel sensing duration is increase from 0.05 w to 0.20 w , 0.1 sec to 0.2 sec respectively, the control traffic is also increase.
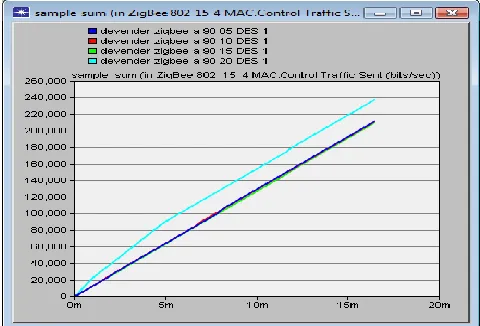
© 2014, IJCSMC All Rights Reserved 500 Control Traffic Sent
Traffic sent is the average number of packets per second submitted to the MAC layer in the network and
Below figure show the results of traffic received in difference scenario and we can clearly see the result as the
transmit power and channel sensing duration is increase from 0.05 w to 0.20 w , 0.1 sec to 0.2 sec
respectively, the control traffic is also increase.
Figure 6 Control Traffic Sent in MAC Layer(bits/sec)
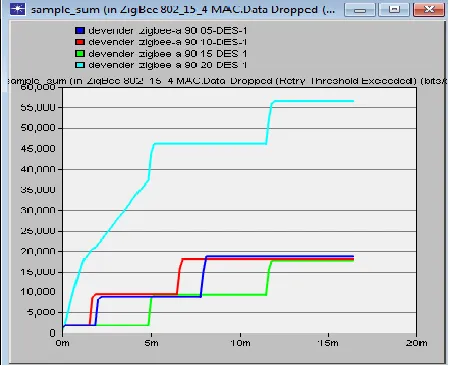
Data Dropped (bits/sec):
It measures the average of data packets that dropped due to their propagation through network model layers (i.e. overflow of buffers) and due to their fails to reach to their receiver entities (failure of all retransmissions until retry limit). It calculated as the total size of higher layer data packets (in bits/sec) dropped by all the WLAN. Below figure show the result of simulation of 1020 sec, data dropped at different transmit power i.e 0.05w, 0.10w,0.15w, 0.20w and channel sensing duration 0.1sec,0.20 sec using IEEE 802.15.4 standard.
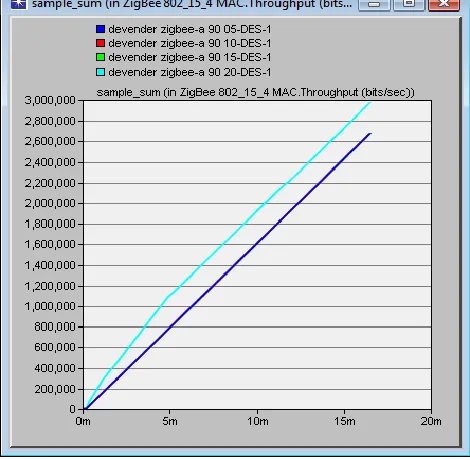
© 2014, IJCSMC All Rights Reserved 501 THROUGHPUT
Throughput is defined as; the ratio of the total data reaches a receiver from the sender (Latif and Rashid, 2004). The time it takes by the receiver to receive the last message is called as throughput. Throughput is expressed as bytes or bits per sec (byte/sec or bit/sec). Some factors affect the throughput as; if there are many topology changes in the network, unreliable communication between nodes, limited bandwidth available and limited energy. A high throughput is absolute choice in every network. After simulation of 1020 sec the average throughput approximately in the same order but as the transmit power increase and channel sensing duration time is also increase from 0.1sec to 0.2 sec than throughput also increase.
Figure 8 MAC Throughput
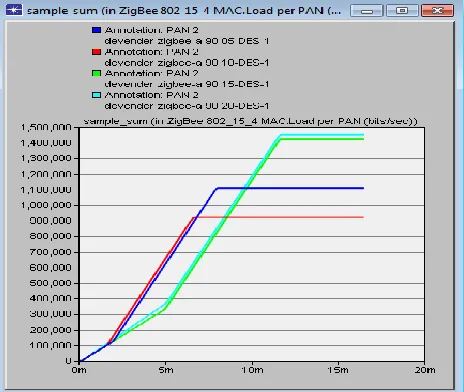
NETWORK LOAD
© 2014, IJCSMC All Rights Reserved 502 Figure 9 MAC Layer Load PAN1 (bits/sec)
MAC Layer Load PAN2
After simulation of 1020 sec PAN2 ( Personal Area Network) at different transmit power i.e. 0.05 w ,0.10 w,0.15 w,0.20 w the load measured is higher at 0.20 w using IEEE 802.15.4 standard show in figure.
Figure 10 MAC Layer Load PAN2 (bits/sec)
Conclusion
© 2014, IJCSMC All Rights Reserved 503
References
[1] www.wikipedia.com
[2] Lovish Jaiswal et al.,“ Performance analysis of back off exponent behaviour at MAC layer in ZigBee Sensor Networks”, International Journal of Computer Applications, Vol. 57, No. 22, November 2012.
[3] Mumtaz M.Ali AL-Mukhtar Department of Internet Engineering Information Engineering College/AL-Nahrain University Baghdad-Iraq “Diagnosis of Failures in Zigbee Based Wireless Sensor Networks”.
[4] Lovish Jaiswal et al. “ Performance Analysis of Topological Variation in Personal Area Network using ZigBee Wireless Sensors” IJCST Vol. 3, Issue 4, Oct - Dec 2012
[5] http://www.creativeworld9.com/2011/04/zigbee-technology-abstract.html
[6] Singh et al., International Journal of Advanced Research in Computer Science and Software Engineering 3(12), December -2013, pp. 1121-1126
[7] OPNET Modeler [Online]. Available: http://www.opnet.com/products/modeler/home.html
![Figure 2 Generalized ZigBee Network[6]](https://thumb-us.123doks.com/thumbv2/123dok_us/1967910.1259602/3.612.132.463.120.288/figure-generalized-zigbee-network.webp)