P R O C E E D I N G S
Open Access
Evaluation of pooled association tests for rare
variant identification
Wan-Yu Lin
1, Boshao Zhang
1, Nengjun Yi
1, Guimin Gao
2, Nianjun Liu
1*From
Genetic Analysis Workshop 17
Boston, MA, USA. 13-16 October 2010
Abstract
Genome-wide association studies have successfully identified many common variants associated with complex human diseases. However, a large portion of the remaining heritability cannot be explained by these common variants. Exploring rare variants associated with diseases is now catching more attention. Several methods have been recently proposed for identification of rare variants. Among them, the fixed-threshold, weighted-sum, and variable-threshold methods are effective in combining the information of multiple variants into a functional unit; these approaches are commonly used. We evaluate the performance of these three methods. Based on our analyses of the Genetic Analysis Workshop 17 data, we find that no method is universally better than the others. Furthermore, adjusting for potential covariates can not only increase the true-positive proportions but also reduce the false-positive proportions. Our study concludes that there is no uniformly most powerful test among the three methods we compared (the fixed-threshold, weighted-sum, and variable-threshold methods), and their
performances depend on the underlying genetic architecture of a disease.
Background
In the past several years, genome-wide association stu-dies (GWAS) have successfully identified many common single-nucleotide polymorphisms (SNP) (say, minor allele frequency [MAF] > 5%) associated with complex human diseases. Despite the findings from GWAS, a large portion of the remaining heritability cannot be explained by these common variants [1]. The impor-tance of detecting rare variants has thus been recog-nized. However, exploring rare variants that are associated with diseases is challenging because of their low frequencies and individually small contributions to the susceptibility to a disease [2]. Recently, several meth-ods have been proposed for detecting rare variants (for an overview see Dering et al. [3]). Most of these meth-ods pool signals of multiple rare variants into a func-tional unit, such as a candidate gene, and then test the association between the pooled signal and the disease [4-7]. For these methods, the choice of a threshold to
discriminate rare variants from common variants plays an important role. If the threshold is too high, variants with relatively high MAFs will dominate the results of association tests for the genes. On the other hand, if the threshold is too low, the statistical power of the associa-tion tests will tend to become unnecessarily low. The specification of a threshold is crucial to the performance of a pooled association test. In this paper, we evaluate the performance of several methods using the simulated data of unrelated individuals from Genetic Analysis Workshop 17 (GAW17) [8].
Methods
Three analysis methods
Some of the proposed pooling methods first specify a fixed threshold for the MAF and then perform associa-tion tests on the set of variants with MAFs smaller than that threshold [4,6]. The weighted-sum method [5] extends this idea and weights each variant by the inverse square root of the expected variance based on the allele frequencies. The larger the MAF, the smaller the weight given to that variant. However, this weighting scheme restricts the effect of a functional variant to be * Correspondence: [email protected]
1
Department of Biostatistics, University of Alabama at Birmingham, 1665 University Boulevard, Birmingham, AL 35294, USA
Full list of author information is available at the end of the article
statistically related to its allele frequency, which may not be plausible in some situations. To address the issue of a preset threshold for the MAF, Price et al. [7] proposed a variable-threshold (VT) approach. The VT approach groups rare variants together by searching for an opti-mal threshold that maximizes the difference between trait distributions for subjects with and without the rare variants. Using the data from GAW17, we compare the performance of the VT method with the performance of the weighted-sum (WS) method [5] and the fixed-threshold method of Morris and Zeggini [6] with thresh-olds of 1% and 5% (denoted T1 and T5, respectively).
Data
We use the GAW17 data for 697 unrelated individuals with variants on 22 autosomal chromosomes. There are 24,487 SNPs located in 3,205 genes on these chromo-somes. We use the start and end positions (in base pairs) of each gene to pick the SNPs falling within the bound-aries of that gene. We analyze all the phenotypes avail-able: Q1, Q2, Q4, and the binary trait (Affected). All the 200 simulated replicates were studied. To evaluate the performance of the four tests (T1, T5, WS, and VT), we requested the simulation answers and compared the answers with the results obtained from the four tests.
Variable threshold software
All the analyses were performed using the VT test soft-ware (http://genetics.bwh.harvard.edu/rare_variants/) of Price et al. [7]. The VT software performs T1, T5, WS, and VT tests in each analysis. The statistical models are all based on linear regressions:
y w xi i
wherey is the phenotype,xi is the number of theith
rare variant in geneG, wiis the weight given to the ith
rare variant, and bˆ0 and bˆ are the estimates of the regression coefficients. For the T1 (or T5) test,wi equals
1 if the frequency of theith variant is less than 1% (or 5%) and 0 otherwise. For the WS test,
w
wherepiis the allele frequency of theith variant.
For the VT test, az-score:
z T T
is computed for each allele frequency threshold T, where SE represents the standard error. Let zmaxbe the
maximum zscore among all possible values of T; then, the significance of zmax is assessed by permutation of
phenotypes. Suppose that we perform ppermutations and therefore havezmax,1,zmax,2,…, zmax,p, which are the
maximumz scores obtained at their optimal thresholds T1,T2, …, Tp, respectively. To ensure the validity of the
VT test, the software allowsT1, T2,…,Tpfor permuted
data to be different from the optimal thresholdT for the original data. The VT software then compares zmax
withzmax,1, zmax,2, …, zmax,pto determine its statistical
significance.
When we performed the T1, T5, WS, and VT tests with the VT software, eachp-value was calculated based on 100,000 permutations. To increase the computation speed, the VT test uses linear regression instead of logistic regression to analyze all phenotypes, including the binary trait. To understand the influence of adjust-ment for covariates, we compared the results when ignoring all covariates with the results obtained when adjusting for Age and Smoking status. We first obtained the residuals by regressing the phenotypes on Age and Smoking status, and then the residuals were regarded as the adjusted phenotypes and were analyzed by the VT software.
Results
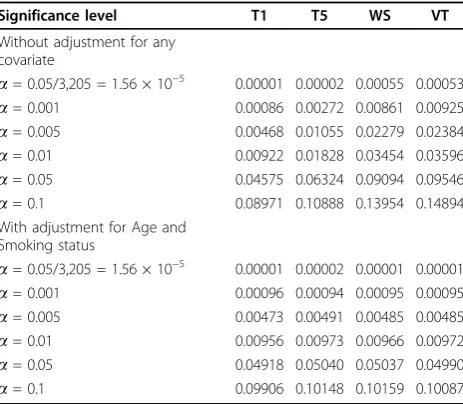
Type I error rates
The phenotype Q4 is not related to any of the 3,205 genes, so we use this part of the results to evaluate type I error rates. Given a significance level a, we estimate the type I error rate using:
I p
whereI(·) is the indicator function, pi,r is thep-value
of theith gene in therth replicate,Tgis the set formed
by all genes, and |Tg| is the number of genes in Tg.
Note that the set Tg varies with different methods.
Table 1 shows the type I error rates for the four tests. When we ignore all the covariates, the type I error rates are generally inflated for the WS and VT tests and slightly inflated for the T5 test. After adjusting for Age and Smoking status, this inflation of type I error rates disappears. We further discovered that the inflation of type I error rates disappeared so long as Age was adjusted, but it remained if only Smoking status was adjusted. To verify this, we deliberately let Age be the outcome variable and tested its association with genes. We found that the rates of rejection of no association (between genes and Age) were generally larger than the nominal significance levels (when the significance level was set at 5%, the average rejection rates were 7.6%, 11.9%, 11.0%, and 12.4% for the T1, T5, WS, and VT tests, respectively). However, when we let Smoking sta-tus be the outcome variable and tested its association with genes, the average rejection rates matched the nominal significance levels. This suggests that the observed inflation of type I error rates comes from some latent confounders (e.g., population stratification or preferential death of carriers with some particular genotypes), and we can remove the false-positive find-ings by adjusting for Age.
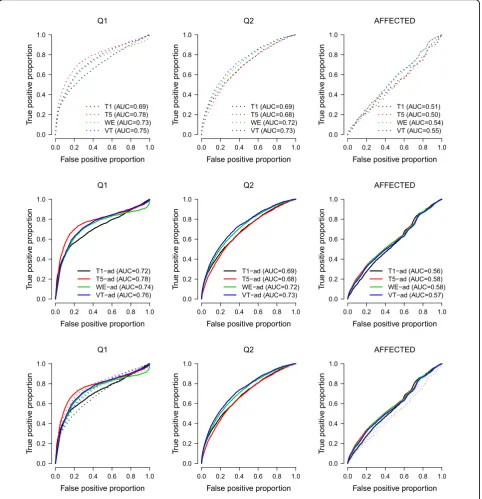
ROC curves
The phenotypes Q1, Q2, and the binary trait (Affected) are related to some genes, so we use the results on these three phenotypes to evaluate the true-positive pro-portions and the false-positive propro-portions. Figure 1 pre-sents the receiver operating characteristic (ROC) curves of the four tests. Given a significance levela, we esti-mate the true-positive proportion using:
I p
and the false-positive proportion using:
I p
genes unrelated to the disease. The set ofSgis provided
by the underlying simulation model.
From the results, all methods perform better for con-tinuous traits than for the binary trait. For concon-tinuous traits, these methods perform better for Q1 than for Q2. This is reasonable because Q1 has higher residual herit-ability. For phenotypes Q1 and Affected, the areas under the ROC curves (i.e., the AUC) increased when the phe-notypes were adjusted for Age and Smoking status. However, adjusting for these two covariates did not have any influence on the ROC curves for Q2. This is also reasonable because Q2 is not influenced by any covariate, according to the underlying simulation model.
Discussion
In this study, we evaluated the performance of three methods (four tests)—fixed-threshold, weighted-sum, and variable-threshold methods—for detecting rare var-iants. The main difference between these methods is the selection of a threshold to discriminate rare from com-mon variants. Based on the simulation model for Q1, most true signals are variants with MAF < 5%, so the T5 test is the best method. The only two exceptions are
C13S523 (MAF = 6.67%) in gene FLT1 and C4S1878
(MAF = 16.50%) in gene KDR. However, the powers of the four tests are all high for detectingFLT1andKDR, because the two genes include many functional variants. Excluding C13S523 from FLT1or excluding C4S1878 fromKDR makes no difference to the final results. The VT test is inferior to the T5 test because of the inclu-sion of the higher threshold (>5%), which increases noise and reduces power. When analyzing the pheno-type Q2, we found that the VT test was the most powerful method for detecting gene VNN1. However, both the T1 test and the T5 test performed poorly in detecting VNN1, because one of the two functional var-iants in VNN1 is relatively common (MAF = 17%). Table 1 Type I error rates (results based on analyzing
Q4)
Significance level T1 T5 WS VT
Without adjustment for any covariate
a= 0.05/3,205 = 1.56 × 10⁻⁵ 0.00001 0.00002 0.00055 0.00053
a= 0.001 0.00086 0.00272 0.00861 0.00925
a= 0.005 0.00468 0.01055 0.02279 0.02384
a= 0.01 0.00922 0.01828 0.03454 0.03596
a= 0.05 0.04575 0.06324 0.09094 0.09546
a= 0.1 0.08971 0.10888 0.13954 0.14894
With adjustment for Age and Smoking status
a= 0.05/3,205 = 1.56 × 10⁻⁵ 0.00001 0.00002 0.00001 0.00001
a= 0.001 0.00096 0.00094 0.00095 0.00095
a= 0.005 0.00473 0.00491 0.00485 0.00485
a= 0.01 0.00956 0.00973 0.00966 0.00972
a= 0.05 0.04918 0.05040 0.05037 0.04990
Therefore, when analyzing Q2, the VT test is slightly better than the other methods. For the binary trait (Affected), all tests have similar (poor) performances. This is because the binary trait was determined by a model including noise (Q4). Not surprisingly, analyzing this trait is more challenging than analyzing Q1 or Q2.
Based on our results, we found that inflated type I error rates were caused by potential confounders not adjusted for in the models (Table 1). If a phenotype is related to some covariates, adjusting for these covariates can also increase the true-positive proportions (Q1 and Affected in Figure 1). However, if a phenotype is not related to 0.0 0.2 0.4 0.6 0.8 1.0
the covariates, adjusting for them has no influence on the true-positive proportions (Q2 in Figure 1).
Conclusions
We evaluated the performance of three methods (fixed-threshold, weighted-sum, and variable-threshold meth-ods) in pooling signals of multiple rare variants in a gene. Based on our analyses for the GAW17 data, we find that no method is universally better than the others. Furthermore, adjusting for potential covariates can not only increase the true-positive proportions but also reduce the false-positive proportions. Our study provides an overall evaluation of the three popular pooled association methods with the GAW17 exome simulation data. This can provide insights to determine a strategy for analyzing exome sequencing data.
Acknowledgments
We thank the anonymous reviewers for their constructive comments, the organizers of GAW17 for providing the data, and the members of GAW17 presentation group 15 for helpful discussions. The Genetic Analysis Workshops are supported by National Institutes of Health (NIH) grant R01 GM031575. This research was supported in part by NIH grants GM081488 (NL), 2R01 GM069430-06 (NY), and GM073766 (GG) from the National Institute of General Medical Sciences. The content is solely the responsibility of the authors and does not necessarily represent the official views of the National Institutes of Health.
This article has been published as part ofBMC ProceedingsVolume 5 Supplement 9, 2011: Genetic Analysis Workshop 17. The full contents of the supplement are available online at http://www.biomedcentral.com/1753-6561/5?issue=S9.
Author details
1Department of Biostatistics, University of Alabama at Birmingham, 1665
University Boulevard, Birmingham, AL 35294, USA.2Department of Biostatistics, School of Medicine, Virginia Commonwealth University, Richmond, VA 23298-0032, USA.
Authors’contributions
W-YL participated in the design of the study, performed the statistical analysis, and drafted the manuscript. NY, GG, and NL participated in the design of the study and revised the manuscript. BZ participated in the statistical analysis and revised the manuscript. All authors read and approved the final manuscript.
Competing interests
The authors declare that they have no competing interests.
Published: 29 November 2011
References
1. Manolio TA, Collins FS, Cox NJ, Goldstein DB, Hindorff LA, Hunter DJ, McCarthy MI, Ramos EM, Cardon LR, Chakravarti A,et al:Finding the missing heritability of complex diseases.Nature2009,461:747-753. 2. Bodmer W, Bonilla C:Common and rare variants in multifactorial
susceptibility to common diseases.Nat Genet2008,40:695-701. 3. Dering C, Pugh E, Ziegler A:Statistical analysis of rare sequence variants:
an overview of collapsing methods.Genet Epidemiol2011,X(suppl X):X-X. 4. Li B, Leal SM:Methods for detecting associations with rare variants for
common diseases: application to analysis of sequence data.Am J Hum Genet2008,83:311-321.
5. Madsen BE, Browning SR:A groupwise association test for rare mutations using a weighted sum statistic.PLoS Genet2009,5(2):e1000384.
6. Morris AP, Zeggini E:An evaluation of statistical approaches to rare variant analysis in genetic association studies.Genet Epidemiol2010, 34:188-193.
7. Price AL, Kryukov GV, de Bakker PI, Purcell SM, Staples J, Wei LJ, Sunyaev SR: Pooled association tests for rare variants in exon-resequencing studies.
Am J Hum Genet2010,86:832-838.
8. Almasy LA, Dyer TD, Peralta JM, Kent JW Jr., Charlesworth JC, Curran JE, Blangero J:Genetic Analysis Workshop 17 mini-exome simulation.BMC Proc2011,5(suppl 9):S2.
doi:10.1186/1753-6561-5-S9-S118
Cite this article as:Linet al.:Evaluation of pooled association tests for rare variant identification.BMC Proceedings20115(Suppl 9):S118.
Submit your next manuscript to BioMed Central and take full advantage of:
• Convenient online submission
• Thorough peer review
• No space constraints or color figure charges
• Immediate publication on acceptance
• Inclusion in PubMed, CAS, Scopus and Google Scholar
• Research which is freely available for redistribution