P R O C E E D I N G S
Open Access
Prediction of genetic contributions to complex
traits using whole genome sequencing data
Chen Yao
1, Ning Leng
2, Kent A Weigel
1, Kristine E Lee
3, Corinne D Engelman
4, Kristin J Meyers
3*From
Genetic Analysis Workshop 18
Stevenson, WA, USA. 13-17 October 2012
Abstract
Although markers identified by genome-wide association studies have individually strong statistical significance, their performance in prediction remains limited. Our goal was to use animal breeding genomic prediction models to predict additive genetic contributions for systolic blood pressure (SBP) using whole genome sequencing data with different validation designs.
The additive genetic contributions of SBP were estimated via linear mixed model. Rare variants (MAF<0.05) were collapsed through the k-means method to create a“collapsed single-nucleotide polymorphisms.” Prediction of the additive genomic contributions of SBP was conducted using genomic Best Linear Unbiased Predictor (GBLUP) and BayesCπ. Estimates of predictive accuracy were compared using common single-nucleotide polymorphisms (SNPs) versus common and collapsed SNPs, and for prediction within and across families.
The additive genetic variance of SBP contributed to 18% of the phenotypic variance (h2= 0.18). BayesCπhad slightly better prediction accuracies than GBLUP. In both models, within-family predictions had higher accuracies both in the training and testing set than didacross-family design. Collapsing rare variants via the k-means method and adding to the common SNPs did not improve prediction accuracies. The prediction model, including both pedigree and genomic information, achieved a slightly higher accuracy than using either source of information alone.
Prediction of genetic contributions to complex traits is feasible using whole genome sequencing and statistical methods borrowed from animal breeding. The relatedness of individuals between the training and testing set strongly affected the performance of prediction models. Methods for inclusion of rare variants in these models need more development.
Background
The genetic architecture underlying complex traits is hypothesized to involve numerous individual loci, of varying frequency, each with small to moderate effects. Genome-wide association studies (GWAS) have gener-ally focused on single nucleotide polymorphisms (SNPs) occurring at a minor allele frequency (MAF) >0.05 with strict statistical criteria for inclusion in the predictive models (eg, individual SNPs with pvalue <5 × 10⁻⁸).To date, loci from GWAS for quantitative traits such as blood pressure and height have provided only limited
ability to explain the variability of complex traits, result-ing in “missing heritability”[1], and their usage for dis-ease prediction has been limited [2].
An alternative approach for explaining the heritability and improving prediction of the additive genetic contri-butions (known as“breeding value”in animal breeding) to complex traits is the use of whole genome markers jointly [3,4]. As reviewed by de los Campos et al, whole genome prediction methods, borrowed from animal breeding, provide the potential to greatly improve the prediction of genetic risk for complex traits in humans, as compared to prediction using only specific susceptibil-ity loci from GWAS [2]. Further improvement in predic-tion models might come from the inclusion of rare variants. Through whole genome sequencing, there is an unprecedented opportunity for predicting the individual * Correspondence: [email protected]
3Department of Ophthalmology and Visual Sciences, University of Wisconsin Medical School, 1069 WARF Building, 610 North Walnut Street, Madison, WI 53726, USA
Full list of author information is available at the end of the article
additive genetic contributions for complex traits through the inclusion of variants across the frequency and effect size spectrums.
In this study, we applied animal breeding whole gen-ome prediction methods to data provided by the Genetic Analysis Workshop 18 (GAW18) to predict the additive genetic contributions of a complex trait, systolic blood pressure (SBP), in humans. As part of this study, we explored 2 methods for validation and the k-means method to collapse and include rare variants into the prediction model.
Methods
Phenotypic values
We used the real data provided by GAW18, including information from up to 4 measurements of SBP per individual. Observed variation in SBP is a function of genetic and environmental factors [5]. A linear mixed model was applied to partition variance of SBP after accounting for 5 fixed effects (band p= 5).Variance is partitioned into the additive genetic effect (u) and the repeated environmental effect (c) of each individual. The additive genetic effect (u) was estimated based on degree of additive relatedness determined from pedigree struc-ture. The repeated environmental effect was the envir-onmental effect on an individual’s phenotype that is constant across (or common to) repeated measures on that individual, and independent between different indi-viduals, which was defined by fitting individual identity as an additional random effect [6].The linear mixed model below was applied to 2189 records (n) of 916 individuals (q) without missing phenotype, and included information from every examination,
y=Xβ+Zu+Tc+e (1)
whereyis ann × 1 vector of SBP measurements;Xis ann × pmatrix containing fixed effects variables including year of examination, age, sex, medications usage, and tobacco smoking;βis ap × 1 vector of fixed effects para-meters;Zis ann ×qmatrix containing dummy variables and relating each of the additive genetic effect to an indivi-dual’s phenotype;u∼N(0,Aσu2)is aq × 1 vector of addi-tive genetic effects for all individuals whereAis aq ×q pedigree-based kinship matrix; T is ann ×qmatrix con-taining dummy variables and relating each of the repeated environmental effect to an individual’s phenotype; c∼N(0,Iσc2)is aq × 1 vector of random repeated envir-onmental effects whereIis aq ×qidentity matrix assum-ing independent repeated environmental effects among different individuals; and error terme∼N(0,Iσe2). The mixed model equation was solved with the restricted maximum likelihood method using the“pedigreemm” R-package version 0.2-4. The estimated additive genetic
contributions were taken as the estimated random additive genetic effectsuˆ, and were used as the independent vari-able in the genomic prediction models.
The narrow-sense heritability [5] (hereafter “ herita-bility”) was calculated from the variance components estimated in model (1) as shown in model (2):
ˆ
Based on 139 unrelated founders from all 20 families, the whole genome sequence markers provided in GAW18 were pruned using PLINK 1.07 [7], keeping markers with linkage disequilibrium coefficient r2<0.9. The whole genome prediction models were applied to 835 individuals from 20 families with both genotype and phenotype data. Common SNPs with MAF≥0.05 were coded to an additive genetic model (0, 1, or 2 minor alleles) using the rounded dosages given by GAW18.
Even though many approaches have been developed for collapsing rare variants to test in association studies [8], approaches for including rare variants in prediction models have not been explored. In this study, a “ col-lapsed SNP” was generated from a vector of 100 rare SNPs based on physical position within the chromosome with k-means method [9], which is a popular clustering method in the fields of statistical learning and pattern recognition [10].
To be consistent with the 3 level genotypes of com-mon SNPs, the k-means method was applied to each 100-rare-SNP vector generated to partition genotypes into 3 clusters, in which each of 835 individuals belonged to the cluster with the nearest mean of indivi-duals in that cluster to minimize the within-cluster sum of square error. After clustering, individuals in the same cluster are expected to be genetically closer to each other compared to individuals from different clusters. Individuals in the cluster with the largest, medium, and smallest cluster size were assigned a collapsed SNP gen-otype to be 0, 1, and 2, respectively, and the MAF was calculated. A total of 26,845 collapsed SNPs were formed from 2,683,921 rare SNPs.
including both common and collapsed SNPs formed by rare variants.
Whole genome prediction models
The whole genome prediction models, genomic Best Linear Unbiased Predictor (GBLUP) and BayesCπ, were trained using 2validation designs described in the next section. The general statistical model is below, and the predicted genomic value of each individual was defined as the fitted valueyˆ:
y=μ+Ma+e (3)
whereyis the estimated genetic valueuˆ from model (1), μis the overall mean,ais a vector of random additive effects of all loci (of SNP set 1 or set 2) with genotype matrixM, and error terme ∼N(0,Iσe2).
In GBLUP, it is assumed thata∼N(0,Kσa2), that is, the same variance is shared by all loci, whereKis the whole genome marker-based relationship matrix. The estimates of marker effectaˆare obtained following the solution of mixed-model equations in Meuwissen et al [11].
In BayesCπ, besides sharing the common variance among all loci, a prior distribution was assigned to the additive effect of each locus depending on the variance
σ2
a and the probability π that the given SNP has zero
effect (formula (4)). The algorithm was implemented as in Habier et al [12].
a|π,σ2
a =
0 with probabilityπ,
N(0,σa2) with probability (1−π). (4)
Both GBLUP and BayesCπ were implemented via Gibbs sampling. The ratio σa2/σe2in GBLUP was set to
2/3, according to the output of BayesCπ. The initial value forπin BayesCπwas set as 0.9. The total number of itera-tions in both models was 12,000 with a burn-in of 2000 and a mining rate of 10. Longer chains (total of 40,000 with a burn-in of 5000 and a mining rate of 10) did not improve the correlation between predicted value and true value. The correlations were also consistent among multi-ple short chains with the same length of 12,000 iterations.
Validation design for prediction models
Two different validation designs were used to evaluate the predictive ability of different models and using different SNP sets. The first was a within-family prediction with the first 3 generations from all 20 families (528 individuals) in the training set (TRN), and their descendants from the fourthand fifth generations (307 individuals) in the testing set (TST). The second was an across-family prediction using 5-fold cross-validation. To balance sizes of training and TSTs in each replicate of cross-validation, 20 families were ranked by their family sizes, and then every five families were randomly assigned to five different folds (four families in each fold) to get about 668 individuals in TRN and about 167 in TST.
Predictive accuracy
The accuracies of genomic prediction were measured by the correlation of the estimated additive genetic contri-butions(y=u)ˆ with their genomic prediction values(y) from model (3).
The prediction accuracies were compared between genome and pedigree based additive genetic contribu-tions(up)ˆ for individuals in within-family prediction TST with at least 1parent in TRN. Theupˆ was calculated with formula (5).
whereuˆF anduˆMare estimated additive genetic
contri-butions of the father and mother of the individual. The linear models in (6) were then fitted, and the R2 values (coefficient of determination of the linear regression) from the model fitting were reported to be the predic-tive accuracies using genomic only, parent average only, and both genomic and parent average information.
ˆ
The additive genetic contributions of SBP ranged from −18.9 to 15.8 with mean 0.2 and SD 3.5. The estimated
variance components, additive genetic variance(σg2), repeated environmental variance(σc2), and error var-iance(σe2), of model (1) were 44.4, 61.5, and 135.0, respectively. The estimated heritability of SBP was cal-culated to be 0.18 using formula (2), which means that 18% of phenotypic variance was a result of additive genetic contributions. The reported heritability estimates of SBP in previous studies ranged from 0.24 to 0.37 [13-15]. The slightly lower heritability estimates from this study could result from different methods for esti-mation or different populations and environments [16]. When the data contained repeated measurements, failure to model a repeated environmental effect would inflate estimates of heritability by interpreting the covar-iance because of repeated environmental effects as cov-ariance among a series of clones with a coefficient of coancestry of 0.5 [6]. Our linear mixed model (model 1) incorporated repeated environmental measures, there-fore minimizing this possibility.
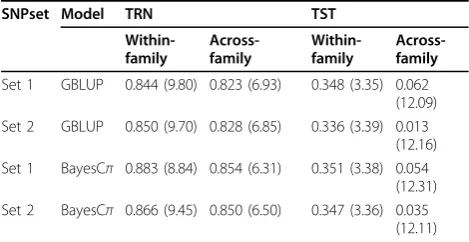
Table 1 outlines correlations between additive genetic contributions of SBP and predicted genomic values and corresponding mean square errors (MSE) in within-family validation and across-within-family prediction with GBLUP and BayesCπ. In general, the BayesCπ outper-formed GBLUP based on both correlation and MSE, althoughthe differences were small (mostly <5%). The markers in GBLUP are assumed to share the same nor-mal distribution, whereas BayesCπfits only a small frac-tion of the available markers with an assumpfrac-tion that most loci are expected to have zero contribution to the independent variable, and the remaining nonzero mar-ker effects are normally distributed. It is possible that the number of causal loci for SBP is relatively small, which is closer to the assumption of BayesCπ. Similar improvement of BayesCπ over GBLUP was found by previous studies [17,18].
Validation designs of prediction greatly affected the prediction accuracy. In both BayesCπand GBLUP, the
Table 1 The accuracies of genomic prediction for additive genetic contribution to SBP.
Set 1 GBLUP 0.844 (9.80) 0.823 (6.93) 0.348 (3.35) 0.062 (12.09) Set 2 GBLUP 0.850 (9.70) 0.828 (6.85) 0.336 (3.39) 0.013
(12.16) Set 1 BayesCπ 0.883 (8.84) 0.854 (6.31) 0.351 (3.38) 0.054
(12.31) Set 2 BayesCπ 0.866 (9.45) 0.850 (6.50) 0.347 (3.36) 0.035
(12.11)
within-family prediction had a strong advantage over across-family prediction, achieving a higher correlation between predicted value and true value, as well as a decreased MSE. For within-family prediction, TST was formed by the descendants of people in TRN, that is, closely related to each other. For the across-family pre-diction, individuals in TST and TRN were from different families, that is, unrelated to each other. Thus, the relat-edness of individuals between TRN and TST strongly affected the performance of prediction models. This result was consistent with a genomic prediction study of human height [4] and several studies on the impact of genetic relationship information on genomic prediction in animal breeding [19,20].
The results from BayesCπin within-family prediction indicated that 14% of total variants (ie, 141,278 SNPs), on average, in TRN contributed when using SNPset 1, and 32% of the additive variance was explained by these SNPs. Thus the whole genome sequence variants detected a large proportion of the heritability (32%). The rest of the heritability might result from rare variants. We attempted to explore an approach in our models to include rare variants, but the addition of the collapsed SNPs did not improve the prediction accuracies (perfor-mance of SNPset 2 vs. set 1 in Table 1). Prediction accuracies using SNP set 2 were consistent among multi-ple runs of k-means methods with different starting points. It is possible that only three clusters were not enough to capture the genetic effects of the combinations of 100 rare SNPs, or that different window sizes should be considered rather than fixed at 100, or the relation-ships between the clusters is more complicated than what we modeled by the coding of the 3 clusters to 0, 1, and 2 under an additive genetic effect assumption. Differ-ent implemDiffer-entations of k-means method should be explored in future studies. Other clustering strategies to collapse rare variants could be attempted as well.
In within-family prediction, there were 289 individuals from TST with at least 1 parent in TRN. Based on the results from the linear regression model (6), the prediction accuracy (the R2) using pedigree based information only is 0.455, higher than the 0.353 using whole genome markers only. Combining information from both sources, the pre-diction accuracy of 0.458 slightly outperformed either of the single source prediction. Including the parent average breeding value in genomic evaluations in animals is a common practice [21], which leads to a significantly greater reliability compared to using parent average breed-ing value only. An advantage of the inclusion is to obtain any genetic variance not captured by markers, for exam-ple, low-frequency quantitative trait loci.
Finally, the population size in this study may not be enough to obtain highly reliable variance component and additive genetic contribution estimates, which can
bring extra noise into genomic predictions. It is also possible that SBP has limited additive genetic influences (ie, the low heritability estimate) and is not a good can-didate for genomic prediction. With the limitations of the Genetic Analysis Workshop (GAW) data set (blood pressure was the only outcome) and GAW timeline, we did not have an opportunity to explore the impact of our model choice. Strategies that may improve the accu-racy of genomic prediction might be (a) increasing the reference population size, (b) using a trait with a higher heritability, and (c) including information of relatives in the reference population.
Conclusions
By using prediction models borrowed from animal breed-ing, GBLUP, and BayesCπ, we showed that prediction of additive genetic contributions for a complex trait using whole genome sequencing data in humans is feasible. The prediction accuracy is strongly affected by the relatedness of individuals between TRN and TST. A large proportion of the additive variance can be explained through inclu-sions of whole genome sequence information in the model. The k-means method as implemented in our study for inclusion of rare variants did not improve the predic-tion. Different implementations of k-means or other meth-ods for including rare variants in genomic prediction should be tested. Including both genomic and parent aver-age information in the prediction model gave a slightly better accuracy than using either one of them alone.
Competing interests
The authors declare that they have no competing interests.
Authors’contributions
CY designed the study and wrote the manuscript. NL conducted the k-means method and computations. CY and NL were responsible for statistical analysis. KAW provided guidance in statistical methodologies. CDE coordinated data acquisition through GAW and provided feedback on conceptual development. KJM and KEL provided oversight and feedback from conception of design through manuscript submission. All authors read, revised, and approved the final manuscript.
Acknowledgements
We would like to thank Chuanyu Sun for the implementation of GBLUP and BayesCπ.
The GAW18 whole genome sequence data were provided by the T2D-GENES Consortium, which is supported by NIH grants U01 DK085524, U01 DK085584, U01 DK085501, U01 DK085526, and U01 DK085545. The other genetic and phenotypic data for GAW18 were provided by the San Antonio Family Heart Study and San Antonio Family Diabetes/Gallbladder Study, which are supported by NIH grants P01 HL045222, R01 DK047482, and R01 DK053889. The Genetic Analysis Workshop is supported by NIH grant R01 GM031575. This article has been published as part ofBMC ProceedingsVolume 8 Supplement 1, 2014: Genetic Analysis Workshop 18. The full contents of the supplement are available online at http://www.biomedcentral.com/bmcproc/ supplements/8/S1. Publication charges for this supplement were funded by the Texas Biomedical Research Institute.
Authors’details
Wisconsin, 1220 Medical Sciences Center, 1300 University Ave, Madison, WI 53706, USA.3Department of Ophthalmology and Visual Sciences, University of Wisconsin Medical School, 1069 WARF Building, 610 North Walnut Street, Madison, WI 53726, USA.4Department of Population Health Sciences, University of Wisconsin School of Medicine and Public Health, Madison, WI53726, USA.
Published: 17 June 2014
References
1. Manolio TA, Collins FS, Cox NJ, Goldstein DB, Hindorff LA, Hunter DJ, McCarthy MI, Ramos EM, Cardon LR, Chakravarti A,et al:Finding the missing heritability of complex diseases.Nature2009,461:747-753. 2. de los Campos G, Gianola D, Allison DB:Predicting genetic predisposition
in humans: the promise of whole-genome markers.Nat Rev Genet2010,
11:880-886.
3. Yang J, Benyamin B, McEvoy BP, Gordon S, Henders AK, Nyholt DR, Madden PA, Heath AC, Martin NG, Montgomery GW,et al:Common SNPs explain a large proportion of the heritability for human height. Nat Genet2010,42(7):565-569.
4. Makowsky R, Pajewski NM, Klimentidis YC, Vazquez AI, Duarte CW, Allison DB, de los Campos G:Beyond missing heritability: prediction of complex traits.PLoS Genet2011,7:e1002051.
5. Falconer DS, Mackay TF:Introduction to Quantitative Genetics.Addison Wesley Longman, Harlow, Essex, UK;, 4 1996.
6. Kruuk LE, Hadfield JD:How to separate genetic and environmental causes of similarity between relatives.J Evol Biol2007,20:1890-1903. 7. Purcell S, Neale B, Todd-Brown K, Thomas L, Ferreira MA, Bender D, Maller J,
Sklar P, de Bakker PI, Daly MJ,et al:PLINK: a tool set for whole-genome association and population-based linkage analyses.Am J Hum Genet
2007,81:559-575.
8. Dering C, Hemmelmann C, Pugh E, Ziegler A:Statistical analysis of rare sequence variants: an overview of collapsing methods.Genet Epidemiol
2011,35(Suppl 1):S12-S17.
9. MacQueen JB:Some methods for classification and analysis of multivariate observations.Proceedsings of the 5th Berkeley Symposium on Mathematical Statistics and Probability: 1967Berkelely: University of California Press; 1967.
10. Steinley D:K-means clustering: a half-century synthesis.Br J Math Stat Psychol2006,59(1):1-34.
11. Meuwissen TH, Hayes BJ, Goddard ME:Prediction of total genetic value using genome-wide dense marker maps.Genetics2001,157:1819-1829. 12. Habier D, Fernando RL, Kizilkaya K, Garrick DJ:Extension of the bayesian
alphabet for genomic selection.BMC Bioinformatics2011,12:186. 13. van Rijn MJ, Schut AF, Aulchenko YS, Deinum J, Sayed-Tabatabaei FA,
Yazdanpanah M, Isaacs A, Axenovich TI, Zorkoltseva IV, Zillikens MC,et al:
Heritability of blood pressure traits and the genetic contribution to blood pressure variance explained by four blood-pressure-related genes. J Hypertens2007,25(3):565-570.
14. Fava C, Burri P, Almgren P, Groop L, Hulthen UL, Melander O:Heritability of ambulatory and office blood pressure phenotypes in Swedish families.J Hypertens2004,22(9):1717-1721.
15. Adeyemo AA, Omotade OO, Rotimi CN, Luke AH, Tayo BO, Cooper RS:
Heritability of blood pressure in Nigerian families.J Hypertens2002,
20(5):859-863.
16. Tenesa A, Haley CS:The heritability of human disease: estimation, uses and abuses.Nat Rev Genet2013,14:139-149.
17. Croiseau P, Guillaume F, Fritz S:Comparison of genomic selection approaches in Brown Swiss within Intergenomics.Interbull Bull2012,
42:127-132.
18. Zeng J, Pszczola M, Wolc A, Strabel T, Fernando RL, Garrick DJ, Dekkers JC:
Genomic breeding value prediction and QTL mapping of QTLMAS2011 data using Bayesian and GBLUP methods.BMC Proc2012,6(Suppl 2):S7. 19. Habier D, Tetens J, Seefried FR, Lichtner P, Thaller G:The impact of genetic
relationship information on genomic breeding values in German Holstein cattle.Genet Sel Evol2010,42:5.
20. Perez-Cabal MA, Vazquez AI, Gianola D, Rosa GJ, Weigel KA:Accuracy of genome-enabled prediction in a dairy cattle population using different cross-validation layouts.Front Genet2012,3:27.
21. Hayes BJ, Bowman PJ, Chamberlain AJ, Goddard ME:Invited review: genomic selection in dairy cattle: progress and challenges.J Dairy Sci
2009, ,92:433-443.
doi:10.1186/1753-6561-8-S1-S68
Cite this article as:Yaoet al.:Prediction of genetic contributions to complex traits using whole genome sequencing data.BMC Proceedings 20148(Suppl 1):S68.
Submit your next manuscript to BioMed Central and take full advantage of:
• Convenient online submission
• Thorough peer review
• No space constraints or color figure charges
• Immediate publication on acceptance
• Inclusion in PubMed, CAS, Scopus and Google Scholar
• Research which is freely available for redistribution