Open Access
Proceedings
Single-nucleotide polymorphism-gene intermixed networking
reveals co-linkers connected to multiple gene expression
phenotypes
Bin-Sheng Gong
1, Qing-Pu Zhang
2, Guang-Mei Zhang
3, Shao-Jun Zhang
1,
Wei Zhang
3, Hong-Chao Lv
1, Fan Zhang
1, Sa-Li Lv
1, Chuan-Xing Li
1,
Shao-Qi Rao*
1,4,5and Xia Li*
1,2,5Address: 1Department of Bioinformatics, Harbin Medical University, Harbin 150081, People's Republic of China, 2Department of Computer
Science, Harbin Institute of Technology, Harbin 150080, People's Republic of China, 3The First Clinical College, Harbin Medical University,
Harbin 150081, People's Republic of China, 4Departments of Molecular Cardiology and Cardiovascular Medicine, Cleveland Clinic Foundation,
9500 Euclid Avenue, Cleveland, Ohio 44195, USA and 5Department of Bioinformatics, Capital University of Medical Sciences, Beijing 100084,
People's Republic of China
Email: Bin-Sheng Gong - [email protected]; Qing-Pu Zhang - [email protected]; Guang-Mei Zhang - [email protected]; Shao-Jun Zhang - [email protected]; Wei Zhang - [email protected]; Hong-Chao Lv - [email protected];
Fan Zhang - [email protected]; Sa-Li Lv - [email protected]; Chuan-Xing Li - [email protected]; Shao-Qi Rao* - [email protected]; Xia Li* - [email protected]
* Corresponding authors
Abstract
Gene expression profiles and single-nucleotide polymorphism (SNP) profiles are modern data for genetic analysis. It is possible to use the two types of information to analyze the relationships among genes by some genetical genomics approaches. In this study, gene expression profiles were used as expression traits. And relationships among the genes, which were co-linked to a common SNP(s), were identified by integrating the two types of information. Further research on the co-expressions among the co-linked genes was carried out after the gene-SNP relationships were established using the Haseman-Elston sib-pair regression. The results showed that the expressions among the co-linked genes were significantly higher if the number of connections between the genes and a SNP(s) was more than six. Then, the genes were interconnected via one or more SNP co-linkers to construct a gene-SNP intermixed network. The genes sharing more SNPs tended to have a stronger correlation. Finally, a gene-gene network was constructed with their intensities of relationships (the number of SNP co-linkers shared) as the weights for the edges.
from Genetic Analysis Workshop 15
St. Pete Beach, Florida, USA. 11–15 November 2006
Published: 18 December 2007
BMC Proceedings 2007, 1(Suppl 1):S45
<supplement> <title> <p>Genetic Analysis Workshop 15: Gene Expression Analysis and Approaches to Detecting Multiple Functional Loci</p> </title> <editor>Heather J Cordell, Mariza de Andrade, Marie-Claude Babron, Christopher W Bartlett, Joseph Beyene, Heike Bickeböller, Robert Culverhouse, Adrienne Cupples, E Warwick Daw, Josée Dupuis, Catherine T Falk, Saurabh Ghosh, Katrina A Goddard, Ellen L Goode, Elizabeth R Hauser, Lisa J Martin, Maria Martinez, Kari E North, Nancy L Saccone, Silke Schmidt, William Tapper, Duncan Thomas, David Tritchler, Veronica J Vieland, Ellen M Wijsman, Marsha A Wilcox, John S Witte, Qiong Yang, Andreas Ziegler, Laura Almasy and Jean W MacCluer</editor> <note>Proceedings</note> <url>http://www.biomedcentral.com/content/pdf/1753-6561-1-S1-info.pdf</url> </supplement>
This article is available from: http://www.biomedcentral.com/1753-6561/1/S1/S45
© 2007 Gong et al; licensee BioMed Central Ltd.
BMC Proceedings 2007, 1(Suppl 1):S45 http://www.biomedcentral.com/1753-6561/1/S1/S45
Background
It is increasingly recognized through genomic studies that genes regulated via the same mechanisms are likely to have similar mRNA expression profiles, for example, by sharing the same transcriptional factors, or pathways, or any unknown but important factor. Several investigators have provided indirect evidence for this hypothesis by clustering genes according to their mRNA expression profiles [1]. Thus, it may be a feasible strategy to search for co-regulated gene clusters from the correlated genes linked to a common SNP(s) as the shared factor. The relationship between the expression and the shared factor(s) (which we call co-linkers) has not been directly tested or quantified on a large scale previously because it is difficult to provide a reliable estimate to measure such relationships using a small number of genes and factors. In this study, we were very interested in identifying such genetic factors (for instance SNPs). A SNP co-linker cis- or trans-linked with a number of genes may indicate that it is either a functional polymor-phism or close to an underlying genetic co-factor nearby that is able to modulate these genes. Today, both genome-wide gene expression and SNPs can be measured at the
same time, which allows identification of such cis- and
trans-acting loci, often called (pleiotropic) expression quantitative trait loci (eQTLs) at the "omics" scale. By treat-ing gene expressions as quantitative traits and SNPs as genomic landmarks, the analysis can proceed in the same (or extended) manner as mapping genetic loci for physio-logic or clinical traits [2].
In this study, following the conventional linkage analysis for identification of the "susceptibility" SNP/loci for each gene, we further identified these SNP co-linkers by measur-ing the strength of the relationship between the linked genes and the co-linker. After finding SNP co-linkers, the SNP-gene intermixed network could be further expanded by linking two genes if they shared a common SNP co-linker. We used Haseman-Elston sib-pair linkage analysis to establish gene-SNP linkages. Then, hub genes and SNPs were identified by their high degree of connectivity. Finally, a SNP-gene intermixed network was constructed.
Methods
Data preparation
In this study, we used data for Problem 1 from Genetic Analysis Workshop 15 (GAW15), which provided expres-sion levels of 3554 genes in lymphoblastoid cells from fourteen three-generation Centre d'Etude du Polymor-phisme Humain (CEPH) Utah families. Genotypes of 2882 autosomal and X-linked SNPs were also included [3]. For the sib-pair linkage analysis, allele frequencies of each SNP locus were estimated by using a maximum-likelihood method incorporated in the FREQ program of S.A.G.E. (Version 5.3) [4], and the identical-by-decent (IBD) data were produced by the GENIBD program in S.A.G.E. [4].
Due to the problem for multipoint IBD computations of very dense SNPs, we performed only single-point IBD com-putations.
Sib-pair linkage analysis
We used the SIBPAL program in S.A.G.E. for sib-pair link-age analysis [4]. This is a model-free linklink-age analysis pro-gram based on the Haseman-Elston regression test that models trait data from full-sib pairs as functions of marker allele sharing IBD. Denote the jth sib-pair with the subscript
ii', and define the mean transcriptional expression for a gene as:
where the summands were the gene expression values measured on N sib pairs. Then the dependent variable for the jth pair was
yj = (xi - )(xi' - ).
The basic regression model we fitted was of the form:
y = α+ βh h + ε,
where α was the intercept, and βh and h were the total genetic variance due to the hth SNP marker and the esti-mated IBD at the marker respectively, and εwas the resid-ual error. This regression model was used to establish the gene-SNP linkages.
Constructing a gene-SNP intermixed network
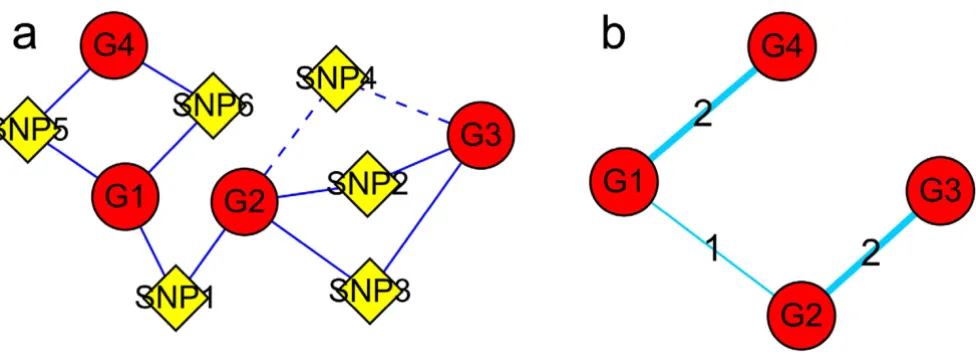
A gene-SNP network was constructed using the identified relationships between genes and SNPs, where genes and SNPs were two types of nodes. Two nodes were connected using an edge if a relationship between them was presented (Fig. 1a). Some nodes that had markedly more connections with other nodes were defined as "hub nodes", including "hub genes" and "hub SNPs". Hub genes or hub SNPs, which may have more important functions or key roles in some biological processes or pathways, were subjected to further investigations.
Exploring the expression pattern between genes linked to a common SNP locus
The genes that were linked to a common SNP(s) might have correlated mRNA expression profiles because they share a genetic factor. Let Gi be a group of n genes that were linked to a common SNP (identified via the previous
sib-pair linkage analysis). The hypothesis tested (Ht) was
whether the genes in Gi were significantly co-expressed by
comparing it with the null model (H0) that depicts the ran-dom expression patterns among groups of genes of the same size as Gi. The averaged Pearson's correlation coeffi-cient ( ) was used as the metric to measure the
transcrip-tion consensus:
rG
i
r
r n n
G
ij i j i j
n
i = −
= <
∑
2
1 1 , ,
( ) ,
Gene-SNP intermixed network Figure 2
Gene-SNP intermixed network. The size of each node is scaled by its degree of connectivity. Hub nodes thus are readily viewed due to their larger size.
A graphical illustration for constructing agene-SNP intermixed network and a gene-gene network Figure 1
BMC Proceedings 2007, 1(Suppl 1):S45 http://www.biomedcentral.com/1753-6561/1/S1/S45
where rij was the Pearson's correlation coefficient between
ith and jth genes. A gene could be clustered into different functional groups if it was linked to multiple SNP co-link-ers. A permutation approach was used to determine the consensus threshold for Gi. We randomly sampled n genes from the original whole gene pool and calculated the aver-aged correlation coefficient between the n genes. The same
process was repeated 100,000 times and the 95% quantile was then defined as the empirical threshold that corre-sponds to the type I error of 0.05 [5].
Extracting a gene-gene network
Gene expressions are often influenced by multiple factors (e.g., transcription factors, reporters, enhancers, modifiers, and so on). The more factors two genes share, the closer the relationship they tend to have. However, the strong linkage disequilibrium (LD) among the SNP co-linkers might influence the result. To investigate the issue, we assessed the LD for all SNP pairs by implementing a likelihood ratio test using the software Arlequin [6], whose empirical distribu-tion was obtained by a permutadistribu-tion procedure [7]. We found that LD had a small influence on the result (only 4.8% of gene pairs were co-linked with a SNP pair or block of a significant LD (p < 0.05)). As shown in Figure 1b, we defined two genes to be connected if they shared at least one linked SNP and the number of co-linked non-signifi-cant LD SNPs for the two genes was used to describe the intensity of their relationship (considering a SNP pair of a significant LD as a single SNP). A gene-gene network was then constructed according to the newly identified relation-ships with their intensities of relationship as the weights for the edges.
Results
Gene-SNP relationships
We found a total of 4727 gene-SNP linkage pairs at the significance level of 10-7 after multiple test correction using Bonferroni's method. There were 60 pairs defined as
cis-acting where the SNPs localized within the extended
10-Mb region of the paired genes, and all the remaining were trans-acting.
Gene-SNP intermixed network and hubs
A gene-SNP network was constructed from the above gene-SNP linkages. Genes and SNPs had 2.4 connections
Table 2: The top 1% SNPs of a high degree of connectivity
SNP ID Degree Co-expression measure p-Value
1857063 114 0.3650 <0.0001
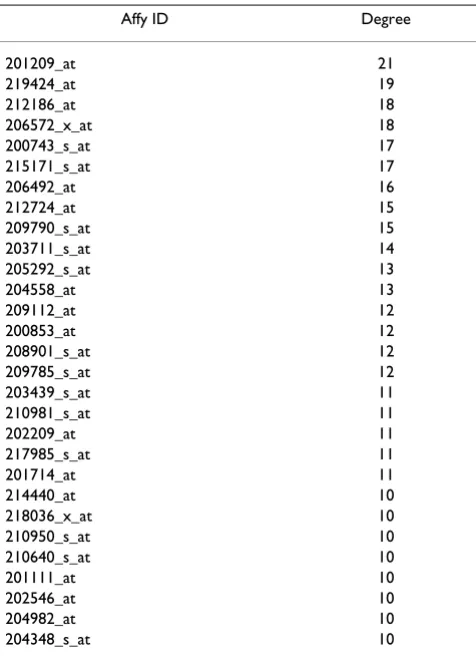
Table 1: The top 1% genes of a high degree of connectivity
on average. Some genes and SNPs had a significantly larger number of relationships than the average. These genes and SNPs were defined as hub nodes (either hub genes or hub SNPs) as illustrated in Figure 2. Inferring from their topological roles that these genes would likely be lethal if mutated, we expect they might have more important function(s) in the underlying pathways, but this would have to be verified in wet-lab experiments for their pleiotropic influences on multiple genes. The top 1% hub genes or hub SNPs are listed in Tables 1 and 2, respec-tively.
Co-expression pattern between genes linked to a common SNP locus
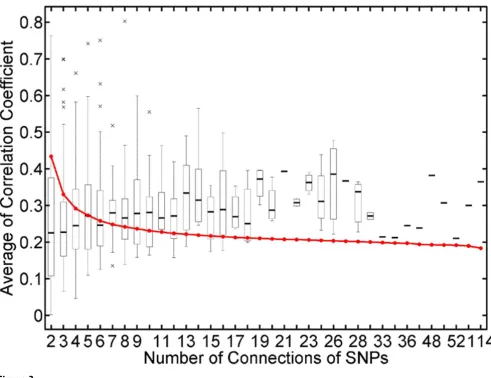
We used the averaged correlation coefficient between co-linked genes as their co-expression measure. Table 2 lists the results for the top 1% SNP co-linkers, and the p-values
correspond to the empirical values derived from the null distribution generated by 100,000 permutations. In this study, we found that the genes among a group having number of connections >18 were significantly co-expressed. If the number of connections dropped down between 18 and 7, co-expressions of most gene clusters were less significant. But, if the number dropped down below 7, co-expression might be occurring by chance (Fig. 3).
Gene-gene network
The gene-gene network (Fig. 4) was extracted from the gene-SNP intermixed network (Fig. 2). The network can obviously be divided into several agglomerate subnets (illustrated in Fig. 4). We used the number of co-linked SNPs of each gene pairs as their interacting power (Pi). Gene pairs with a high Pi may have a similar function(s)
Intensity of co-expression of genes linked to acommon SNP(s) Figure 3
BMC Proceedings 2007, 1(Suppl 1):S45 http://www.biomedcentral.com/1753-6561/1/S1/S45
because potentially they share more common factors. However, this was not investigated further.
Discussion
In our study, first we used a univariate method to identify gene-SNP relationships for each gene expression pheno-type separately. After finding the pool of all gene-SNP relationships, we constructed the SNP-gene intermixed network and further gene-gene network based on the con-cept of sharing a factor(s). Alternatively, one may consider using purely multivariate modelling to include all the genes, but this is not practical yet due to the prohibitive computing demand. One may also consider several data reduction techniques such as principal-component analy-sis as seen in several applications in this workshop. From both theoretical and applied views, all the methods have their own merits and weaknesses in analyzing modern high-dimension data. Further comparisons between dif-ferent approaches are expected to provide novel method-ological insights.
Although we identified gene-SNP relationships using very strict criteria, it is likely that the resulting gene-SNP inter-mixed network (or the further derived gene-gene net-work) includes some noise links. Hub SNPs or hub genes, which are expected to play key roles in maintaining the
underlying biological networks in a working condition, should be further studied either computationally or using molecular biology techniques prior to applying these hub SNPs or hub genes in more practical settings.
Conclusion
The proposed bioinformatics approach, which attempts to identify co-regulated gene clusters from the correlated genes linked to a common SNP(s) as the shared factor, has been demonstrated via analysis of the GAW15 Problem 1 data, to be a promising and feasible strategy to identify transcriptional QTLs (hub SNPs) and to elucidate the underlying transcriptional genetic networks on the global scale. However, further studies, including topological and functional evaluation and validation of the resulted net-works using more data sets and large-scale simulations are warranted.
Competing interests
The author(s) declare that they have no competing inter-ests.
Acknowledgements
This work was supported in part by the National Natural Science Founda-tion of China (Grants 30370798, 30571034, 30570424, 30600367, and 30670484) and the Foundation of Heilongjiang Province (Grants 1055HG009, ZJG0501, GB03C602-4, F2004-02, 2005-39, and
A reconstructed gene-gene interaction network Figure 4
Publish with BioMed Central and every scientist can read your work free of charge "BioMed Central will be the most significant development for disseminating the results of biomedical researc h in our lifetime."
Sir Paul Nurse, Cancer Research UK
Your research papers will be:
available free of charge to the entire biomedical community
peer reviewed and published immediately upon acceptance
cited in PubMed and archived on PubMed Central
yours — you keep the copyright
Submit your manuscript here:
http://www.biomedcentral.com/info/publishing_adv.asp
BioMedcentral BMFH060044). Some of the results of this paper were obtained by using the
program package S.A.G.E., which is supported by a U.S. Public Health Serv-ice Resource Grant (RR03655) from the National Center for Research Resources.
This article has been published as part of BMC Proceedings Volume 1 Sup-plement 1, 2007: Genetic Analysis Workshop 15: Gene Expression Analysis and Approaches to Detecting Multiple Functional Loci. The full contents of the supplement are available online at http://www.biomedcentral.com/ 1753-6561/1?issue=S1.
References
1. Inoue LY, Neira M, Nelson C, Gleave M, Etzioni R: Cluster-based network model for time-course gene expression data. Biosta-tistics 2007 in press.
2. Rao S, Wang QK: SAGE programs: model-free linkage analysis for complex cardiovascular phenotypes. Methods Mol Med
2006, 128:61-89.
3. Cheung VG, Conlin LK, Weber TM, Arcaro M, Jen KY, Morley M, Spielman RS: Natural variation in human gene expression assessed in lymphoblastoid cells. Nat Genet 2003, 33:422-425. 4. S.A.G.E.: Statistical Analysis for Genetic Epidemiology,
Release 5.3 2006 [http://genepi.cwru.edu/]. Cleveland: Department of Epidemiology and Biostatistics, Case Western Reserve University
5. Li X, Rao S, Jiang W, Li C, Xiao Y, Guo Z, Zhang Q, Wang L, Du L, Li J, Li L, Zhang TW, Wang QK: Discovery of time-delayed gene regulatory networks based on temporal gene expression profiling. BMC Bioinformatics 2006, 7:26.
6. Schneider S, Roessli D, Excoffier L: Arlequin: A software for pop-ulation genetics data analysis. Ver 2.000. 2000 [http:// lgb.unige.ch/arlequin/]. Geneva: Genetics and Biometry Laboratory, Department of Anthropology, University of Geneva
7. Slatkin M, Excoffier L: Testing for linkage disequilibrium in gen-otypic data using the expectation-maximization algorithm.