R E S E A R C H
Open Access
Intelligent optimization for support
pressure zone algorithm based on fuzzy
neural network damage identification
Jianyang Yu
1,2*and Yuanhui Li
1Abstract
To predict the scope of support pressure zone in coal mining, this paper focuses on analysis over the features of stress transformation in front of the working face. Based on the fuzzy neural network (FNN) damage identification of the warped beam structure (WBS), a mechanical analysis model was optimized, from which a quantifying formula for calculating the scope of the support pressure zone (SPZ) in front of the mechanized working face during the periodic weighting stage was derived. The algorithm of fuzzy neural network optimization for transfer coefficient of elastic damage (TCOED) offers a method and basis to predict the stress state in front of the working face. The research results have guiding significance to computer intelligence monitoring for coal mines.
Keywords:Fuzzy neural network (FNN), Warped beam structure (WBS), Support pressure zone (SPZ), Transfer coefficient of elastic damage (TCOED)
1 Introduction
Fully mechanized mining of coal mines can cause massive movement and stress redistribution in the over-lying strata with significant changes in the stresses of the coal wall which offers supporting pressure in front of the working face. The redistribution of support pressure has contributed to the formation of a dynamic support pressure zone (SPZ), which is the main zone of stress concentration in the process of coal mine exploitation. When the zone’s stress is less than the coal mass’s com-pressive strength, the coal wall will present an elasticity of downward compression. When the zone’s stress ex-ceeds the coal mass’s compressive strength, the coal wall will present plasticity, exposing the zone to mining di-sasters including massive sinking of the roof, rock burst, or coal and gas outburst [1, 2]. The disasters usually occur together with periodicity during the periodic weighting. Therefore, study on the support pressure’s distribution and influence sphere algorithm under dy-namic mining is the key of computer intelligence moni-toring and safe production.
The stress distribution has been studied by multiple researchers with varied methods. Many researchers have made contributions to analyzing the support pressure distribution and degree of stress concentration ahead of an advancing coal face in theory. Song et al. established the “transfer rock theory” that takes overlying strata as the sports center. And the rule of support pressure dis-tribution was obtained on the basis of onsite real data [3]. Qian et al. have proposed a key strata theory on the basis of “voussoir beam theory”. It holds that the key strata act as the carrier and framework in the strata’s movement [4]. Additionally, the finite element method was adopted for the analysis of the features and stress distributions of stope structure. Similar material simula-tion and numerical simulasimula-tion are widely used to analyze stresses of the mining face and explain the formation of the support pressure by many researchers. In the studies conducted by Alehossein and Poulsen [5], three kinds of mechanical models for supporting zones and roof caving zones are proposed through analysis of caving features and condition. UDEC is used to analyze stress distribu-tion of the mining face front under full-mechanized cav-ing mincav-ing condition, range of plastic zone, and distribution of surrounding rock movement under the mining influences. In the studies of Pu and Miao [6],
* Correspondence:[email protected]
1Key Laboratory of Ministry of Education on Safe Mining of Deep Metal
Mines, Northeastern University, Shenyang 110819, China
2
Liaoning Provincial Institute of Mineral Exploration, Shenyang 110000, China
RFPA is introduced to simulate the collapse process of the overlying strata. The overlying strata’s caving features and the dynamic distribution rules of the surrounding rock’s support pressure are obtained [6]. The distribu-tion rules of the support pressure of fully mechanized caving faces are obtained from the process.
In the above researches, the support pressure’s distri-bution and features of the mining face front are analyzed through roadway deformation observation, supportload measurement, laboratory simulation, numerical simula-tion, and simplified calculation of elasticity. However, dynamic algorithm for accurate scope of the SPZ based on structural damage identification has rarely been studied. In this paper, theoretical model deduction is op-timized for the scope calculation, with numerical simula-tion as a tool to obtain calculasimula-tion parameters of the fuzzy neural network (FNN) damage identification. The quantifying method is proved to be simple and precise. The parameters can be directly obtained through onsite measurement. During the periodic weighting, dynamic forecast for the scope of SPZ can be realized with this method. The following geological conditions should be satisfied if the method is going to be used: the dip angles of the coal layer and the overlaying strata are small ones; the roof within the studied zone has been well preserved without any major structure damage.
2 The warped beam structure (WBS) and the analysis of mechanical model
2.1 Definition of the WBS
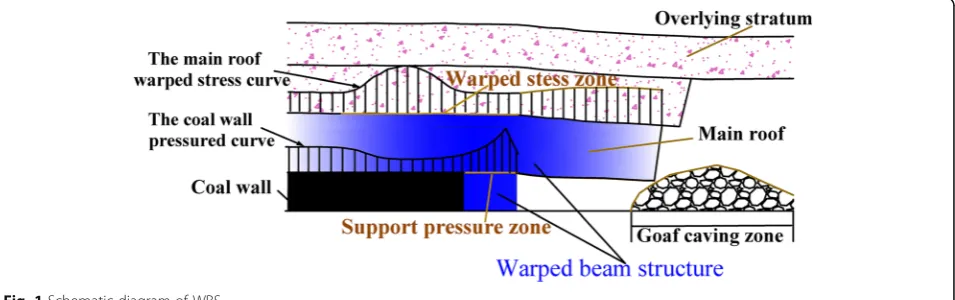
During the mining process, multiple bearing structures are formed between the overlying strata and the surrounding rocks due to influences of the key layer. As the mining continues, the stress state of the coal-and-rock mass in front of the mining face is chan-ged and a new stress zone is formed. This stress state is mainly influenced by the bearing structure with the main roof as the pressure-bearing layer [7–9]. When the main roof remains unbroken (or stay in structural balance),
according to the medium transfer theory, the stress will be partially transferred through the main roof’s elastic deformation within certain zones of the mining face front. As a result, a WBS (as shown in Fig. 1) is formed between the main roof of the aforementioned zone and the SPZ in front of the mining face [10]. The balanced state during the mining can be divided into two categor-ies: before the main roof’s first weighting and during the periodic weighting phase. This paper mainly focuses on the latter.
2.2 The analysis of the stress zone’s formation mechanism under the influence of the WBS
2.2.1 Warped stress zone’s formation mechanism
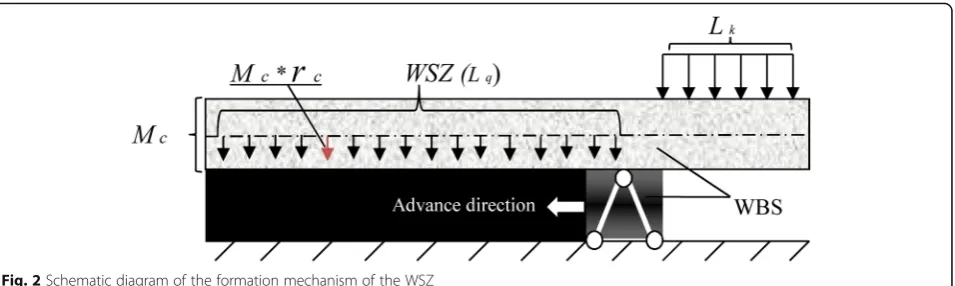
As the mining process continues, the original balance of mechanical structure is broken and a new mechanical balance system and load-carrying system are formed. All pressures from the sinking rock layer will be carried by the main roof at the upper goaf. The aforementioned pressure together with the main roof’s weight is called as the active load in the WBS balance system [11, 12]. Different from the one in mechanical equilibrium state, the main roof will not be rotated due to the restriction from the rock layers in front of the mining face. Because the main roof’s rigidity is bigger than the adjacent over-lying strata, the main roof will squeeze the overover-lying rock with the warping effect. The stress in zones above the main roof will increase accordingly due to the re-action forces that the main roof within the WBS pro-duces to keep a balance with the restrictions. As a result, an abscission layer is formed between the im-mediate roof and the main roof. The zone caused by the warping effect is called warped stress zone (WSZ) (as shown in Fig. 2).
2.2.2 The analysis of the formation mechanism of the SPZ SPZ is formed through the pressure of the WBS carried by the coal wall. It carries the weight of the overlying strata at the upper goaf and the pressure from the
balanced WBS under the warping effect. The support pressure is then exponentially increased by the impacts on the SPZ from the aforementioned pressures and the weight of the overlying strata [13–15].
2.3 Calculation of the stress zone’s division in front of the mining face
The stress zone in front of the mining face presents periodicity along with periodic weighting. The range of the WSZ and the SPZ can be identified through the mechanical analysis of the WBS and quantified accord-ing to the physical and mechanical characteristics of the WBS, the stope, and the surrounding rock.
2.3.1 Calculation of the WSZ
After the main roof’s initial caving, the pressure in the front of the mining face can be released. As the mining continues, the main roof’s exposed area increases and the WSZ moves forward. Roof separation appears be-tween the main roof and the immediate roof. As the stress grows, a pre-splitting zone appears at the rising main roof. Then, the main roof’s integrity is broken. Mean-while, transfer coefficient of elastic damage (TCOED) and the warping stress decrease. When the main roof caves, the TCOED reaches the lowest with the roof separation closed. The warping stress of the main roof experiences a from-weak-to-strong and from-strong-to-weak periodic process as the mining continues [16–18]. The scope of WSZ formula can be obtained through the balance theory of the WBS:
whereLqrepresents the range of the WSZ,nrepresents
the number of overlying strata beams at the upper stope, mc is the thickness of the main roof, rc represents the
unit weight of the main roof, Dx represents the main
roof’s TCOED, Lkrepresents the span of the main roof
at the upper stope, andmiandrirepresent the thickness
and the unit weight of the overlying strata respectively.
2.3.2 Calculation of the SPZ
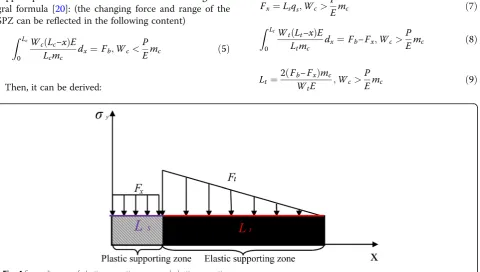
According to the definition of the WBS, the SPZ holds three categories of pressures: the first is the pressure from the balanced WBS under the warping effect; the second is the overlying strata’s weight at the SPZ; and the third is the partial weight of the overlying strata at the upper stope (as shown in Fig.3). As the pressure in the SPZ increases, the coal wall near the stope enters plastic supporting stage with the main roof’s pressure to the both ends reaches the ductility summit and the bearing-pressure peak moves towards the mining face’s front. The SPZ is then divided into elastic supporting zone and plastic supporting zone (as shown in Fig. 4). As the support pressure’s loads increase, the range of the SPZ at the mining face’s front is quantified based on the changing features of the loads at the SPZ and the physico-mechanical properties of the coal wall at the SPZ [19].
The changing loads of the SPZ:
Fb¼εDx FcþFq
−Fj ð2Þ
where Fb represents the changing loads of the SPZ, Fc
represents the SPZ’s pressure from the upper stope, Fq
represents the SPZ’s restriction pressure from the WBS at the mining face’s front, Fj represents the Hydraulic
support’s work resistance force, andεrepresents the cor-rection coefficient of the overlying strata;
Fc¼Lk
Xn
i¼1miriþmcrc
ð3Þ
wherenrepresents the number of overlying strata beams at the upper stope,Fcrepresents the SPZ’s pressure from
the upper stope,mcrepresents the main roof’s thickness,
rc represents the main roof’s unit weight, Lk represents
the span of the main roof at the upper stope, andmiand
ri represent the thickness and unit weight of the main
roof’s overlying strata respectively.
Fq¼ FcLk
Lq
ð4Þ
where Fc represents the SPZ’s pressure from the upper
stope, Fqrepresents the SPZ’s restriction pressure from
the WBS at the mining face’s front, Lk represents the
span of the main roof at the upper stope, andLq
repre-sents the range of the WSZ.
When the coal wall which supports the pressure at the mining face’s front is in elastic supporting zone (as shown in Fig. 5), the changing loads and range of the support pressure can be reflected in the following inte-gral formula [20]: (the changing force and range of the SPZ can be reflected in the following content)
Z Lc
0
WcðLc−xÞE
Lcmc dx
¼ Fb;Wc<P
Emc ð5Þ
Then, it can be derived:
Lc¼
2Fbmc
WcE ;Wc<
P
Emc ð6Þ
whereLc represents the range of the SPZ,wc represents
the coal wall’s maximum compressibility, E represents the coal sample’s elasticity modulus, P represents the coal sample’s uniaxial compressive strength,Xrepresents the advancing distance of the mining face, andFb
repre-sents the changing loads of the SPZ.
As the mining face advances, the coal wall’s pressure increases. The range of the SPZ at the mining face’s front can be divided into elastic supporting zone and plastic supporting zone:
Fx¼Lsqs;Wc>P
Emc ð7Þ
Z Lt
0
WtðLt−xÞE
Ltmc dx
¼ Fb−Fx;Wc>P
Emc ð8Þ
Lt¼
2ðFb−FxÞmc
WtE ;Wc>
P
Emc ð9Þ
Fig. 3Schematic diagram of the formation mechanism of the SPZ
Lc¼LtþLs ð10Þ
where Fx represents the overall pressure that the
plastic supporting zone holds, Ls represents the
range of the plastic supporting zone, qs represents
the average supporting force of the plastic support-ing zone, wc represents the coal wall’s maximum
compressibility in the SPZ, wt represents the
max-imum compressibility of the coal wall’s elastic sup-porting, E represents the coal sample’s elasticity modulus, P represents the coal sample’s uniaxial compressive strength, ε represents the correction co-efficient of the overlying strata, and Lt represents the
range of the plastic supporting zone. It can be concluded that:
Lc¼
2.4 Identification of structural damage based on neural network
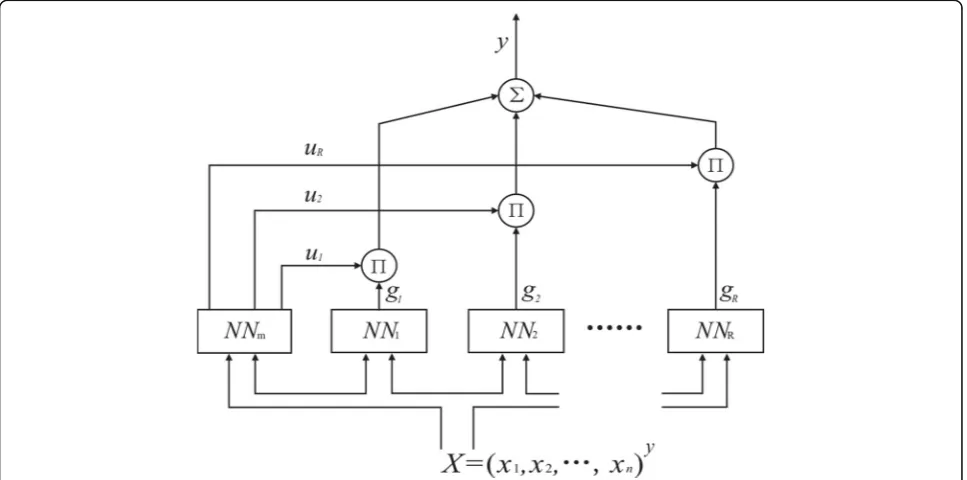
2.4.1 T-S-type fuzzy neural network inference system Roof damage identification belongs to the single output fuzzy system of n input; the fuzzy system of T-S model mainly includes the following three parts [21]:
1) NNmfis mainly used to determine membership
function and give the applicability of each rule to the discrepancy;
2) R neural network NNR in this picture corresponds to R rules;
3) The part of weighted summation; the output of the fuzzy system is decided by the following equation (as shown in Fig.6).
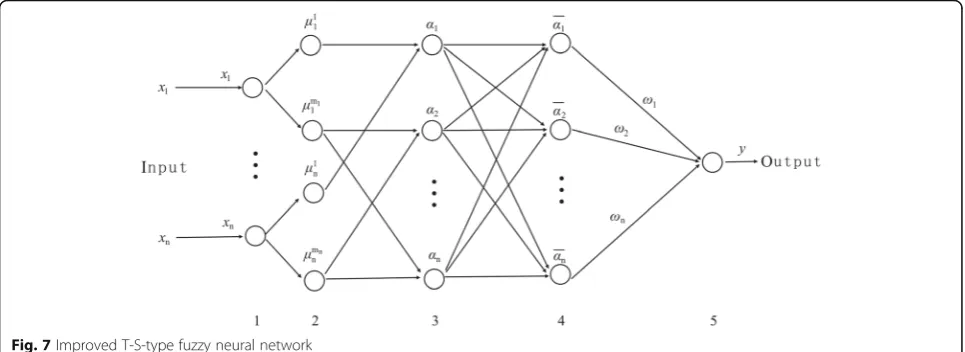
2.4.2 Improved T-S-type fuzzy neural network
The improved neural network is used to determine the extent of the damage transmission to the roof. The im-proved T-S-type fuzzy neural network includes five layers, namely, the input layer and output layer and three hidden layers. They respectively correspond to various parts of the fuzzy reasoning system [22].
Fig. 5The stress distribution of the elastic supporting zone
The first layer is the input layer, in which each node is directly connected to the each componentxof the input vector. The layer passes the input node x= [x1,x2, .. … xn]Tto the next layer.Xis the input after the scale
trans-formation, and the number of nodes in the layerN1=n (as shown in Fig.7).
The second layer is fuzzified layer. Each node in it rep-resents a linguistic variable value, such as NS and PB. It can calculate the membership function uij that input component xi that belongs to each linguistic variable
fuzzy set; the membership function is expressed by Gaussian function:
wheren denotes the dimension of the input and mi
de-notes the fuzzy partition number; the number of nodes in the layerN2¼
Pn
i¼1mi.
In the third layer of fuzzy rules, each node represents one piece of fuzzy rule, is used to match fuzzy rules and calculate the applicability of each rule:
aj¼ min u1i1;u2i2;……;unin;
The fourth layer is the normalized calculation:
aj¼aj=
Xm
i¼1
ai;j¼1;2;…m ð14Þ
The layer has the same number of nodes as the third layer N3=m. The fifth layer is the output layer, which can implement perspicuity calculation:
is equivalent to the center value of first j lan-guage, the membership function ofy.
2.4.3 Neural network fitting elastic damage transfer coefficient fitting analysis
A large number of experiments show that there is cer-tain nonlinear inverse relationship between material bearing pressure ability and damage degree. And coal mine roof is the structure bearing overburden pressure. Due to the damage, conduction ability in the structure decreases with the decrease of damage degree. It is diffi-cult to describe process through simple phenomenon re-lation. The damage degree of roof is recognized using the fused fuzzy neural network by fuzzy neural network and fuzzy theory, and the pressure indicator that passes to the front and back of the working surface due to de-formation is assumed [23].
The TCOED is an indicator which can be used to measure the roof’s capacity to transfer the pressure from the pressure of overlying strata at the upper stope after the main roof’s integrity is broken. Obvi-ously, the value is 1 when the main roof is intact, which means that the main roof has no transfer pressure loss. When the main roof is totally dam-aged, the value is 0, which means the roof is broken and cannot transfer pressures from the upper stope (as shown in Fig. 8).
The progress of the main roof’s damage is shown in the changes of the transfer coefficient’s value from 1 to 0, which can be expressed in the following formula Based on the fuzzy neural network (FNN) damage identification:
Dð Þx ¼
1;0≤x≤Li
1− x−Li Lb−Li
2
;Li<x≤Lb
0;x¼Lb
8 > > < > >
: ð16Þ
where Li represents the main roof’s span when it starts
to break, Lb represents the main roof’s periodic caving
span, X represents the mining face’s advancing distance, andDxmeans the main roof’s TCOED;
3 Case study and verification of onsite observation
3.1 Geological conditions of the case
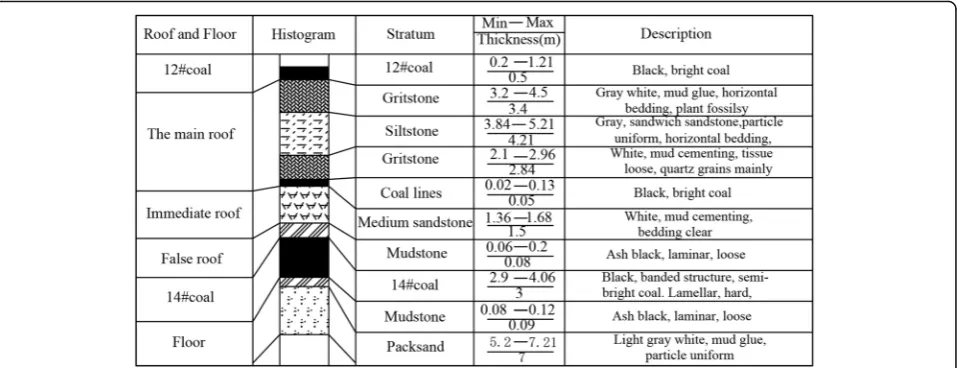
In this paper, the theoretical calculation is conducted in the SW4102 mining face of the Xiaonan mine, which be-longs to Tiefa Coal Mining Group. The SW4102 mining face is located at the northwest second level of the south-wing mining zone. The mining face measures − 398~−426 m in elevation, 1053 m in strike length, 220 m in face length, and 212,410 m2in zone. The over-all structure of mining face is uniclinal. Its trend is N190°~N204°. Its tendency is N280°~N294°.The coal layer’s dip angle is 4°~8° (6° in average). The mining face is in14# coal seam with average thickness of 2.9~ 4.36 m (3 m in average). The coal seam’s roof consists of false roof, immediate roof, and main roof. The false roof is made of mudstone with thickness of 0.04 m~0.70 m (0.29 m in average). The immediate is made of medium
sandstone with average thickness of 1.5 m. The main roof is made of coarse sandstone and siltstone with aver-age thickness of 10 m. The span of the mining face’s periodic weighting is 29 m (as shown in Fig.9).
3.2 Obtaining parameters using FLAC model-building According to the formula of the TCOED, the main roof’s span isLiwhen it starts to break. The values of TCOED
under varied mining distances can be obtained through advancing distances and span of periodic weighting. In this paper, the finite difference numerical simulation software Free Lossless Audio Codec (FLAC) is used to calculate the main roof’s damage. The model is built based on the real condition of the SW4102 mining face. Physical and mechanical parameters of the coal rock measured by Lab are shown in Table 1. The Mohr-Coulomb model is adopted to reflect constitutive relations of wall rock [24, 25]. In the model, the thick-ness is 3 m in the coal layer and 1.5 m in the immediate roof. The main roof is made of coarse sandstone and siltstone with average thickness of 10 m and tensile strength of 2.89 MPa. The overall thickness of the over-lying strata is 386 m. In order to conduct observation to the main roof damages, the overlying strata’s pressure is simulated with equivalent pressure.
zone are shown in Fig.10. As the mining continues, the stress in each zone begins to change. As can be seen in Fig.11, the tensile stresses 1–3, 22–24, 28–34, and 38–45 increase. When the mining face advances to 12 m, the ten-sile stress of“point 1”reaches 2.5 MPa. When the mining face advances to 16 m, the tensile stress of “point 1” reaches 3.6 MPa, which exceeds the 2.89 limitation of ten-sile strength. Meanwhile, the tenten-sile stress of“point 2”and “point 24” also exceed the limitation of tensile strength and increase as the mining continues.
According to the above data and Fig.12, the main roof starts to break when the mining process advances to 13 m; therefore, the value of TCOED can be calculated as Dx. Subsequently, the range of SPZ (Lc) and range of
WSZ (Lq) can be calculated according to the working
parameters and formulas mentioned in the previous sec-tion. The calculation results and parameters are shown in Table2(obtained by lab tests).
3.3 Verification of onsite observation and comparative analysis of the data
3.3.1 Verification method
Due to warping effects of the WBS, the roof separation of varied degree appears. Then, the range of WSZ at the front of the mining face can be obtained. Since the sup-porting pressure can cause the coal wall at the front of
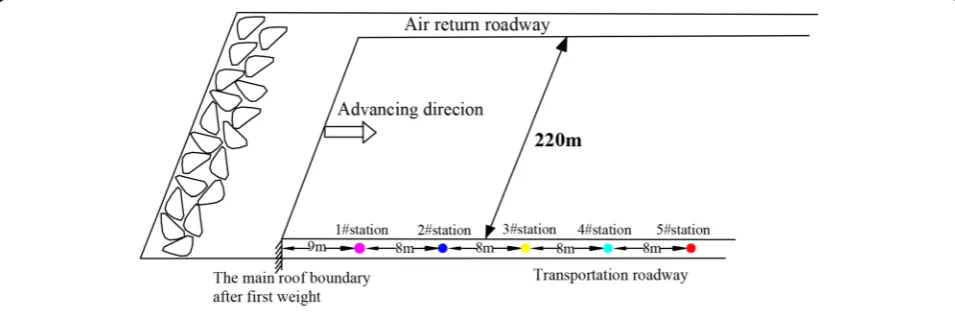
the mining face to be compressed and sink, the range of the SPZ can be identified according to the range of the compressed coal wall. Based on measurement needs, an observation station for the roof separation is set in the conveyor gateway as shown in Fig.13. According to ac-tual conditions of the roof, each observation station is set with two observation roof bolts. One is fixed to the main roof through the immediate roof and the other one fixed to the immediate roof with a certain observation distance of over 170 mm between the ends and the immediate. The observation data are recorded on daily basis. The deformation of the roof separation and the roadside’s compression are also monitored. After the first weighting, the 1# observation point is deployed at the location 9 m to the caving roof’s edge. The rest of the observation points are set with a distance of 8 m (Fig. 14).
The theoretical calculation for the stress zone in front of the mining face is conducted according to the real pa-rameters applied to theoretical formulas. The theoretical results are compared with the real data from onsite measurement. The displacement of surface rock is used to assist the observation of periodic weighting. The range of SPZ and WSZ can be verified with the com-pressed coal wall range and observation data of the roof separation under the shaft. In the following part, the Fig. 9Schematic diagram of drilling columnar
Table 1Physical mechanical parameter statistics tables of coal rock
Rock strata Densityρ(kg/m3) Modulus of elasticityE(GPa) Poisson’s ratioν CohesionC(Mpa) Friction angleΦ(°)
Coarse sandstone 2600 16.5 0.206 4.5 34
Siltstone 2460 19.5 0.2 2.75 38
Medium sandstone 2650 18 0.21 3.5 35
Mudstone 2461 17.7 0.204 1.2 32
Coal 1380 5.3 0.32 1.25 32
theoretical results of the range of SPZ and WSZ are ana-lyzed comparatively with the real results.
3.3.2 The analysis for the range of the WSZ
Results of comparative analysis between the real obser-vation results and theoretical calculations are shown in Fig.15. When the mining face advances to 4 m, the the-oretical calculation result for the range of WSZ is 6.7 m, and the 1# observation station is located 5 m in front of
the face, which is in consistent with the theoretical re-sults. When the mining face advances to 8,12,16,20, and 24 m, the theoretical calculation for the range of WSZ are 9.4,11.5,12.9,13.1 and 11.5 m respectively with roof separation being observed. When the mining face ad-vances to 28 m, the theoretical calculation for the range of WSZ is 2.9 m with the 4# observation station at the position 5 m in the front of the mining face. There is no roof separation observed. It can be concluded that the Fig. 10The numerical simulation model
real observation results and the theoretical calculations are consistent with each other. According to the obser-vation station of N20 for displacement of surface rock, the earth surface sinks in a severe level. The roof col-lapse as the mining face continues to advance.
According to the developing rules of the range of the WSZ, during the periodic weighting, as the mining face advances, the theoretical calculations of the range of the WSZ should undergo an increase-stable-decrease process. However, the real observation results turn out to be an increase-decrease slightly-increase-decrease towards the original point process. The main reason for this difference is the limited observatory location. Despite the slight differences between the theoretical
calculations and real observation results, the overall de-veloping trends are consistent.
3.3.3 Analysis for the range of the SPZ
The results from comparative analysis between the real observation results and theoretical calculations are shown in Fig. 16. When the mining face advances to 4 m, the theoretical calculation for the range of SPZ is 1.1 m with the 1# observation at the location 1 m from the mining face; this means that the real observation re-sults and the theoretical calculations are consistent with each other. When the mining face advances to 8, 12, and 28 m, the theoretical calculation for the range of SPZ are 2.1, 3.7, and 1.5 m respectively. When the mining Fig. 12a–cSchematic diagram of the main roof’s damage
Table 2Theoretical calculation results table of stress influence zone
Name Units Actual measurement parameters and computed results
Lk m 4 8 12 16 20 24 28
Wc mm 41 48 56 58 60 58 54
Ls m 0 0 0 0.6 1.1 0.8 0
Fj,q Pa 1.2 × 10
6
1.2 × 10⁶ 1.2 × 10⁶ 1.2 × 10⁶ 1.2 × 10⁶ 1.2 × 10⁶ 1.2 × 10⁶
D(x) – 1 1 1 0.9446 0.779 0.502 0.1142
Lc m 1.1 2.5 3.6 5.4 6.61 6.1 2.9
face advances to 16, 20, and 24 m, the theoretical sults are consistent with the onsite observation re-sults. The roof begins to collapse after the mining face advances to 28 m.
The ranges of WSZ and the developing trend of the supporting range share some common grounds. Both have undergone an increase-decrease process. There are also differences: the range of the WSZ goes through an increase-remain stable-sharp decrease process, while the range of SPZ experiences an increase-decrease process with a stable period. Since the theoretical calculations
and onsite measurement results for the range of SPZ are consistent with each other, it can be concluded that the theoretical calculation method is reasonable and can offer precise calculation during the periodic weighting phase.
4 Discussion
4.1 Discussion of the TCOED
4.1.1 The changing law of the TCOED
Figure17displays the variation tendency of the TCOED. The location where the face main roof was originally Fig. 13Observation station based on field schematic diagram
damaged was obtained through the numerical simulation monitoring of the FLAC. Then, the span of the damage and the corresponding value of the TCOED were calcu-lated using the formula (12). It can be noticed that the TCOED was initially at a stable stage and the value de-creases monotonically at an increasing rate as the min-ing activity advances. When the workmin-ing face proceeds from 4 to 12 m, no damage is found at the main roof and the TCOED remains unchanged. When the working face proceeds to 16 m, main roof are found partially damaged and its bearing capacity starts to decline. When the working face proceeds to 28 m, the damages to the main roof worsen and its bearing capacity is found in sharp decline. The declining speed also increases until the ceiling is totally damaged and losses all bearing cap-acity. The average gradient is −0.01385 and −0.09695
respectively when the working face progress is 12–16 m and 20–28 m. The damaging speed can be reflected in the difference of average gradient where the later dam-aging speed is seven times faster than the initial speed.
4.1.2 Comparative analysis of the TCOED and calculation results
Figure 18 displays the corresponding relation between the TCOED and the range of WSZ. When the working face expands from 4 to 12 m, the TCOED remains at a stable level of 1 and the average gradient of the curve for the warped stress range is 0.6. The range of WSZ also increases at a stable growing speed. When the working face expands from 12 to 16 m, the TCOED drops to 0.9446. The range of WSZ increases, though it is still at a lowering speed in comparison with the former stage. When the working face advances to 20 m, the TCOED continues to drop to 0.9446. The average gradient of the curve for the warped stress range is 0.05. The range of WSZ increases at a much lower rate in Fig. 15Contrast of warped stress influence scope between actual
measurement and theoretical calculation
Fig. 16Contrast of support pressure influence scope between actual measurement and theoretical calculation
Fig. 17Variation curve of the TCOED
comparison with the previous stage, and it finally reaches its peak level of 13.1 m. When the working face reaches 24 m, the TCOED continues to decline to 0.502. The average gradient of the curve for the warped stress range starts to become a negative value of −0.4. The range of WSZ also begins to drop. When the working face reaches 28 m, the TCOED drops dramatically to 0.1142. The range of WSZ also encounters a sharp de-cline until the main roof breaks. According to the above data analysis, it can be concluded that the TCOED has influence and control effect on the range of WSZ. To conclude, the range of WSZ has experienced four chan-ging stages: a sharp increase stage where the TCOED is 1, a growing stage at a slow pace where the TCOED stands at a range of 0.779 to 1, a slow dropping stage where the TCOED falls within a range of 0.779 to 0.502, and a sharp declining stage, where the TCOED is be-tween 0.502 to 0.1142.
Figure19displays the corresponding relations between the TCOED and the range of SPZ. When the working face progresses from 4 to 20 m; the TCOED drops from 1 to 0.779. In comparison with the range of WSZ, stead of shifting from a sharp increase to a slow in-crease, the range of SPZ experiences a sharp growth to its peak level of 6.61 m. When the working face reaches 24 m, the TCOED declines from 0.779 to 0.502. The range of SPZ shrinks at a slow pace to 6.1 m. When the working face advances to 28 m and the TCOED drops to 0.1142, the range of SPZ faces a sudden drop to 2.9 m. According to the above data analysis, it can be con-cluded that the TCOED has certain impact on the range of SPZ. In comparison with the range of WSZ, the range of SPZ experiences three stages: a sharp increasing stage where the TCOED stands at a range of 1 to 0.779, a slow decreasing stage where the TCOED falls within a range of 0.779 to 0.502, and a sharp declining stage where the
TCOED ranges from 0.502 to 0.1142. In the above two cases, both peak values appear when the TCOED is 0.779 and the roof is about 30% damaged. It can be concluded that by monitoring the roof’s damaging level, it can be predicted whether the range of stress zone reaches its peak value, which offers references to the reinforcement of the conveyor gateway and the return-air gateway.
4.2 Discussion of the calculation results
4.2.1 Discussion on the changing law of the SPZ and WSZ In Fig. 20, it can be seen that the SPZ shares the same changing tendency with the WSZ. To begin with, the range of SPZ is far smaller than the WSZ. When the working face progresses to 4 m, the range of WSZ is 6.5 times larger than the range of SPZ. As the working face advances, the difference between the range of SPZ and the range of WSZ continues to narrow until the working face reaches the location where the peak values appear and the WSZ is two times larger than the range of SPZ. In the following progress of the working face, the ratio of WSZ to the SPZ remains at a stable level of 2. This phenomenon can be explained by the growing tendency of the warped stress. Growth speed of the WSZ changes from fast to slow, while the SPZ increases at a growing rate. The peak values appear where the working face reaches 20 m. In the following declining process, the WSZ and the SPZ share the same pace and maintain a stable ratio. According to the above relations, it can be concluded that the range of WSZ can be used to predict the range of SPZ and to offer reference parameters for the defining of the range of SPZ.
4.2.2 The fitting and error analysis for the observed data and the theoretical calculation results
Figures13and14show the comparison of the measured results of the WSZ and the SPZ. It can be concluded that errors exist between the theoretical calculation
results and the measured data. In particular, in the case of the WSZ, obvious errors appear between the theoret-ical calculations and the measured results. It can be ex-plained through the following aspects. First, the location of the observation station may cause errors. When Fig.7 shows the working face progress to 16 m, it can be seen from the layout plan in the Fig.9 that the layout obser-vation station that the obserobser-vation station should be placed in the working face’s conveyor gateway as re-quired by the real situation. Therefore, it can be inferred that the range of WSZ obtained from the layer observa-tion is not fully reliable. When the working face pro-gresses to 16 m, the theoretical calculation result is 12.9 m. In this case, the third observation station is 9 m in front of the working face and the fourth observation station is 17 m in front of the working face. It can be found that obvious errors exist between the real location and the calculated location. However, bed-separation phenomenon is found at the third observation station and its real location is 3.9 m from the calculated loca-tion, which may cause the errors. In the whole WSZ, the observation errors are highly related to the layout of the observation station. Secondly, due to the fact that the theoretical calculations need some parameters, the pa-rameters have to be obtained through onsite observa-tion, which is also a factor contributing to the errors between the theoretical calculations and the observed data. Thirdly, errors may also exist in the process of obtaining the TCOED. As a key parameter, the TCOED is obtained through FLAC numerical simulation. How-ever, the model of numerical simulation has been simpli-fied which is different from the main roof in real geological conditions, particularly in terms of the changes of the roof thickness, the minor fracture devel-opment, and the roof’s physical characteristics. These factors may cause errors in obtaining the TCOED, which finally contribute to the errors between the theoretical calculations and the measured data.
5 Conclusions
(1) The mechanics analysis of the warp beam structure shows that the mining influenced stress zone in front of the mining face can be divided into the SPZ and the WSZ. By establishing the mechanical model of WBS, the quantitative formulas of the pressure zone and the warping zone range are given.
(2) With the algorithm of fuzzy neural network optimization for transfer coefficient of elastic damage (TCOED), a dynamic simulation monitoring is conducted for the stress states of
varied locations of the SW4102 working face’s
main roof. The value of TCOED is calculated.
From the data analysis of the TCOED, it can be found that as the working face advances, the
main roof’s damage degree is escalating with the
later damaging speed seven times faster than the
earlier damaging speed and the main roof’s role
as a transmission medium is also weakened. Besides, the scope of stress zone in front of the working face is related to the roof’s damage degree. When the roof is 30% damaged, the scope of WSZ and SPZ reaches their peak values. (3) According to the theoretical calculations, as the
working face advances, the scope of the WSZ experiences a successive process from a sharp increase, a slow increase, and a slow decline to a sharp decline during the periodic weighting stage. Due to the controlling influences on the TCOED during the whole process, the scope of the SPZ experiences a successive process from a sharp increase to a slow decline to a sharp decline. As the working face advances, the ratio of the scope of the WSZ to the SPZ stabilizes at 2. During the periodic weighting stage, the scope of the SPZ in front of the working face has remained smaller than the scope of the WSZ.
(4) According to the observation data from the abscission layer, the method proposed in this paper can enable a relatively precise calculation for the scope of the WSZ and the SPZ in front of the working face during the periodic weighting stage. It provides foundation for the risk-area forecasts and the study of stress states in front of the working face.
Abbreviations
FNN:Fuzzy neural network; SPZ: Support pressure zone; TCOED: Transfer coefficient of elastic damage; WBS: Warped beam structure; WSZ: Warped stress zone
Acknowledgements
This work was supported by the Liaoning Provincial Research Program (Study on formation mechanism and governance technology of coal mining subsidence area). The authors are grateful to TieFa coal industry group
Liaoning Provincial Institute of Mineral Explorationfor their great support.
About the authors
The first author, Yu Jianyang, Master of Engineering, is a geological engineer. He graduated from the Liaoning Technical University in 2014. He is currently a Ph.D. candidate in the Northeastern University. His research interests include fuzzy neural network and rock mechanics.
The second author, Li Yuanhui, Doctor of Engineering, is a professor. He graduated from the Northeastern University in 2005 and worked in the Northeastern University. His research interests include fuzzy neural network and deep mining.
Funding
This work was supported by the State Key Research Development Program of China (No. 2016YFC0801605) and National Natural Science Foundation of China (No. 51674061).
Authors’contributions
the study and participated in its design and coordination and helped to draft the manuscript. All authors read and approved the final manuscript.
Competing interests
The authors declare that they have no competing interests.
Publisher’s Note
Springer Nature remains neutral with regard to jurisdictional claims in published maps and institutional affiliations.
Received: 19 April 2018 Accepted: 30 May 2018
References
1. GX Xie, JC Chang, K Yang, Investigations into stress shell characteristics of surrounding rock in fully mechanized top-coal caving face. Int. J. Rock Mech. Min. Sci. 46, 171–181 (2009).
2. JL Xie, JL Xu, Effect of key stratum on the mining support pressure of a coal seam. Geosci. J. 21(2), 267–276 (2017).
3. ZQ Song,Practical Mine Pressure Control,China Beijing (China Mining University Press, 1988).
4. MG Qian, PW Shi, JL Xu,Mining Pressure and Strata Control, China Beijing (China University of Mining and Technology Press, 2003).
5. H Alehossein, BA Poulsen, Stress analysis of longwall top coal caving. Int. J. Rock Mech. Min. Sci. 47(1), 30–41 (2010).
6. H Pu, XX Miao, Numerical simulation of dynamic falling of overlying rocks and support pressure in surrounding rocks for fully-mechanized top-coal caving stope. Chin. J. Rock Mech. Eng. 23(7), 1122–1126 (2004). 7. MC He, HP Xie, SP Peng, Study of rock mechanics indeep mining
engineering. Chin. J. Rock Mech. Eng. 24(16), 2803–2813 (2005). 8. HP Xie, HW Zhou, Mining-induced mechanical behavior in coal seams
under different mining layouts. J. China Coal Soc. 36(7), 1067–1074 (2011). 9. JC Wang, SG Yang, Y Li, ZH Wang, A dynamic method to determine the
supports capacity in longwall coal mining. Int. J. Min. Reclam. Environ. 29(4), 277–288 (2015).
10. JX Yang, CY Liu, B Yu, FF Wu, The effect of a multi-gob, pier-type roof structure on coal pillar load-bearing capacity and stress distribution. Bull. Eng. Geol. Environ. 74, 1267–1273 (2015).
11. ZC Qin, TX Wang, Support pressure distribution and its transfer law in floor of deep isolated fully-mechanized mining faces using sublevel caving. Chin. J. Rock Mech. Eng. 23(7), 1127–1131 (2004).
12. JF Ju, JL Xu, WB Zhu, et al., Strata behavior of fully-mechanized face with 7.0 m height support. J. Min. Saf. Eng.29(3), 344–350 (2012).
13. N Hosseini, K Oraee, K Shahriar, K Goshtasbi, Studying the stress redistribution around the longwall mining panel using passive seismic velocity tomography and geostatistical estimation. Arab. J. Geosci. 6, 1407– 1416 (2011).
14. AK Singh, S Rajendra, J Maiti, R Kumar, PK Mandal, Assessment of mining induced stress development over coal pillars during depillaring. Int. J. Rock Mech. Min. Sci. 48, 805–818 (2011).
15. XT Feng, AJ Hudson, Specifying the information required for rock mechanics modelling and rock engineering design. Int. J. Rock Mech. Min. Sci. 47(2), 179–194 (2010).
16. XT Feng, AJ Hudson, The ways ahead for rock engineering design methodologies. Int. J. Rock Mech. Min. Sci. 41(2), 255–273 (2004). 17. JF Ju, JL Xu, Surface stepped subsidence related to top-coal caving longwall
mining of extremely thick coal seam under shallow cover. Int. J. Rock Mech. Min. Sci. 78, 27–35 (2015).
18. DY Xuan, JL Xu, WB Zhu, Dynamic disaster control under a massive igneous sill by grouting from surface boreholes. Int. J. Rock Mech. Min. Sci. 71, 176– 187 (2014).
19. PL Gong, ZM Jin, Mechanical model study on roof control for fully-mechanized coal face with large mining height. Chin. J. Rock Mech. Eng. 27(1), 193–198 (2008).
20. H Wu, N Zhang, WJ Wang, YM Zhao, P Cao, Characteristics of deformation and stress distribution of small coal pillars under leading abutment pressure. Int. J. Min. Sci. Technol. 25, 921–926 (2015).
21. XS Deng, XZ Wang, Incremental learning of dynamic fuzzy neural networks for accurate system modeling. Fuzzy. Sets. Syst. 160(7), 972–987 (2009). 22. CF Juang, TM Chen, Birdsong recognition using prediction-based recurrent
fuzzy neural networks. Neurocomputing 71(1–3), 121–131 (2007).
23. M Singh, S Srivastava, M Hanmandlu, et al., Type-2 fuzzy wavelet networks (T2FWN) for system identification using fuzzy differential and Lyapunov stability algorithm. Appl. Soft Comput. 9(3), 977–989 (2009).
24. QS Bai, SH Tu, M Chen, et al., Numerical modeling of coal wall spall in a longwall face. Int. J. Rock Mech. Min. Sci. 88, 242–253 (2016).