FULL PAPER
Surface deformation of Asama volcano,
Japan, detected by time series InSAR combining
persistent and distributed scatterers, 2014
‒
2018
Xiaowen Wang
1,2*, Yosuke Aoki
1and Jie Chen
3Abstract
Asama volcano is one of the most active volcanoes in Japan. Spatially dense surface deformation at Asama volcano has rarely been documented because of its high topography and snow cover around the summit. This study presents the first interferometric synthetic aperture radar (InSAR) observation of ground deformation at Asama volcano with 120 Sentinel-1 SAR images from both ascending and descending tracks and 20 descending ALOS-2 images acquired between 2014 and 2018. We exploited both persistent and distributed scatterers to overcome decorrelation of SAR signals and applied a three-dimensional unwrapping method to retrieve the displacement time series efficiently. Our observations reveal an asymmetric deformation around the volcano with two main deformation regions on the northeast and southeast flanks, respectively. The northeast flank (NEF) exhibits line-of-sight (LOS) extensions in all the three SAR datasets with maximum velocities of − 14, − 10, and − 12 mm/year for the descending ALOS-2, ascend-ing, and descending Sentinel-1 measurements, respectively. The southeast flank (SEF) shows LOS extensions in the ascending observations and LOS shortening in the descending observations with velocities between − 12 and 9 mm/ year. Decomposition of the LOS displacements reveals nearly pure subsidence at the NEF, while the SEF exhibits a sub-stantial eastward component as well as subsidence. Comparisons of the vertical subsidence at two continuous GNSS stations near the summit crater with our InSAR observations indicate small discrepancies smaller than 4 mm/year. We interpreted that the subsidence at the NEF of Asama is primarily due to the hydrothermal activity, while the deforma-tion at SEF is plausibly due to flank instability. We highlight that efforts should be taken to monitor the slope instability at Asama volcano in the future.
Keywords: Asama volcano, InSAR, Volcano deformation, Persistent scatterers, Distributed scatterers, Slope instability
© The Author(s) 2019. This article is distributed under the terms of the Creative Commons Attribution 4.0 International License (http://creat iveco mmons .org/licen ses/by/4.0/), which permits unrestricted use, distribution, and reproduction in any medium, provided you give appropriate credit to the original author(s) and the source, provide a link to the Creative Commons license, and indicate if changes were made.
Introduction
Asama volcano is an andesitic composite volcano and one of the most active volcanoes in Japan. Asama vol-cano has been active for about 100,000 years and repeat-edly erupted every several years in history (Aoki et al. 2013). The recent eruptions at Asama volcano were in 2004, 2008, 2009, 2015, and 2019. An eruption at Asama volcano has the potential of posing volcanic hazards to the Tokyo metropolitan area, which is about 160 km southeast of the volcano with a population of more than 20 million. For instance, the 2004 eruption in Asama
volcano produced large ash clouds and led to ashfall in the Tokyo metropolitan area (Tsunematsu et al. 2008). For this reason, monitoring the activity of Asama volcano is essential for mitigating volcanic hazards during future large eruptions.
Geodetic measurements of surface deformation at active volcanoes can provide important clues for assess-ing volcanic activity (Pinel et al. 2014). Leveling surveys were repeated 22 times at and around Asama volcano between 1902 and 2005 (Murase et al. 2007). Continuous global navigation satellite system (GNSS) observations at Asama volcano have also been implemented since the mid-1990s (Takeo et al. 2006; Aoki et al. 2013). These geodetic measurements have revealed that the deforma-tion pattern of Mt Asama is temporally variable. Leveling
Open Access
*Correspondence: [email protected]
1 Earthquake Research Institute, The University of Tokyo, Tokyo, Japan
benchmarks at the eastern flank of the volcano have shown minor subsidence between 1935 and 1939 and apparent uplift during 1939 and 1950, while the leveling surveys at the southeastern flank exhibited significant uplift between 1902 and 1952 and moderate subsidence between 1952 and 2004 (Murase et al. 2007). Murase et al. (2007) described these vertical displacements as due to the deflation and inflation of two pressure sources beneath Mt Asama. Temporal variations in baseline length between continuous GNSS stations around Asama volcano have also exhibited frequent alternation between contraction and expansion (Aoki et al. 2013). Contrac-tion of the GNSS baseline has been observed preceding both the 2004 and 2009 eruptions and been interpreted as degassing from previously intruded magma (Kazahaya et al. 2015).
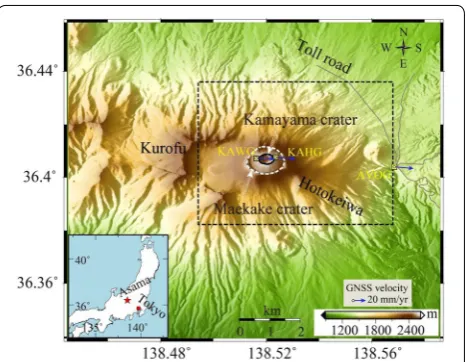
Although conventional geodetic measurements from leveling and GNSS have provided crucial insights into the deformation pattern and magmatic activity of Asama volcano, a detailed characterization of surface deforma-tion at the volcano is still lacking. One important reason is that the GNSS stations are sparsely distributed around the volcano with only two continuous GNSS sites around the summit (KAHG and KAWG in Fig. 1). While inter-ferometric synthetic aperture radar (InSAR) has proven to be a useful tool for mapping ground deformation with high spatial resolution and precision (Hooper et al. 2012; Pinel et al. 2014), InSAR has rarely been applied to Asama volcano. Decorrelation of InSAR due to several factors such as the steep topography, dense vegetation, and snow cover around the summit have limited the application of InSAR to monitor deformation at Asama volcano (Pinel et al. 2014; Remy et al. 2015).
Considerable efforts have been made to overcome phase decorrelation of InSAR and increase measurement points by exploiting a subset of pixels with stable phase such as persistent scatterer (PS) or distributed scatterer (DS) from repeated SAR images (Crosetto et al. 2016). A classical method that exploits both PS and DS from SAR images is Stanford Method for Persistent Scatter-ers (StaMPS) method developed by Hooper et al. (2004). This method assumes that ground deformation is spa-tially correlated and implements spatial filtering with a boxcar window to distinguish stochastic noise phase from other phase components. However, such spatial filtering may bias interferometric phase because the scattering patterns of neighboring pixels may be het-erogeneous (Parizzi and Brcic 2011; Jiang et al. 2015). The advantage of StaMPS is that it does not rely on any strong a priori assumptions of the temporal evolution of deformation by implementing a three-dimensional (3D) unwrapping method, facilitating the efficient detection of non-linear surface motion over time. As an alternative
way to increase measurement points, Ferretti et al. (2011) proposed a method called SqueeSAR™, in which a trian-gulation algorithm is implemented to “optimize” inter-ferometric phase using all possible interferograms. While SqueeSAR™ can increase measurement points remarka-bly, the phase triangulation procedure is time consuming, because (N(N − 1))/2 interferograms are required from N SAR images.
In this study, we attempted to characterize the mod-ern surface deformation of Asama volcano with repeated Sentinel-1 and ALOS-2 SAR images acquired between 2014 and 2018. Considering the severe decorrelation of SAR signals at the volcano, we developed a new InSAR processing procedure by taking advantage of the preexist-ing methods StaMPS and SqueeSAR™. First, we selected PS and DS following a method similar to Ferretti et al. (2001, 2011), with some modifications for a more robust selection of PS and DS. We then retrieved the displace-ment time series by applying the 3D unwrapping method on the selected pixels within the framework of StaMPS (Hooper et al. 2004, 2008). The proposed method takes advantage of SqueeSAR™ for increasing measurement points and StaMPS for obtaining ground deformation products more efficiently. We also investigated possible mechanisms to account for the observed deformation
with independent geological data and other geophysical observations around the volcano.
Geological background
Asama volcano is a complex volcano consisting of Kurofu, Hotokeiwa, and Maekake volcanoes from west to east (Fig. 1). Kurofu volcano, the oldest edifice, col-lapsed eastward and formed the horseshoe-shaped cal-dera approximately 24,000 years ago (Aramaki 1963). After the activity of Kurofu Volcano ceased, the eruption center shifted to the east, and the Hotokeiwa volcano formed around 17,000–11,000 years ago (Aramaki 1963). The most recent volcanism was at the Maekake volcano, on which the Kamayama crater remains active at pre-sent. The latest major eruptions with Volcanic Explosivity Index (VEI; Newhall and Self 1982) of 4–5 took place in 1108, 1128, and 1783 AD (Aramaki 1963). The eruptions have become less explosive during the last few decades with several moderate-sized eruptions of VEIs 2 in 1982, 1983 and 2004. More recently, minor eruptions with VEIs of 1 took place in 2008, 2009, and 2015.
The highest point of Asama Volcano is the summit of the Kamayama crater (Fig. 1) at about 2560 m above sea level. The Kamayama crater has a diameter of about 500 m in the east–west direction and 440 m in the north–south direction (Fig. 1). The topography of Asama volcano is steep with an elevation difference of 1150 m between the summit and a GNSS site AVOG at the vol-canic base ~ 4 km to the east of the summit. The slope angles of the volcano mainly range between 20º and 50º, and the western flank is steeper than the eastern flank (Aoki et al. 2013).
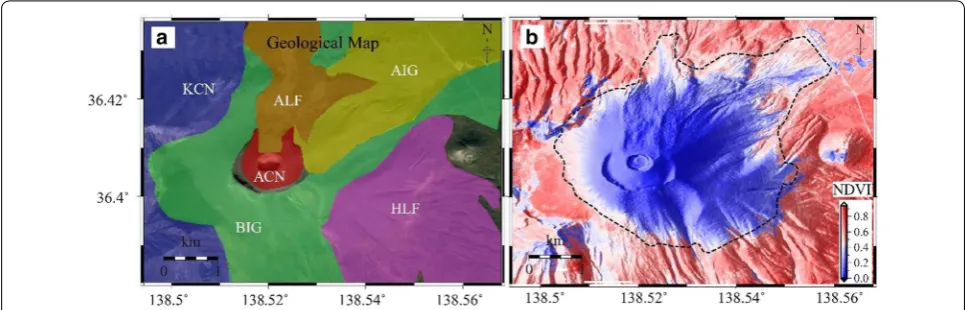
Geological mapping shows that Asama volcano is mainly covered by six types of pyroclastic flow that were emplaced during past eruptions (Fig. 2a). By a chrono-logical sequence, the geochrono-logical deposits are the KCN formed during the activity of Kurofu volcano, the HLF formed during the activity of Hotokeiwa volcano, the BIG formed during the 1108 explosive eruption, and the ACN, ALF, and AIG erupted during the 1783 eruption. The lava flows of the 1783 eruption cover the summit area and most of the north and east flanks (Hayakawa 2006).
SAR data
We collected a total of 140 SAR images comprising 120 C-band Sentinel-1 images and 20 L-band ALOS-2 images to detect the surface deformation at Asama vol-cano between 2014 and 2018. The Sentinel-1 images are acquired from two paths: 58 images from the descend-ing path and 62 images from the ascenddescend-ing path. The ALOS-2 images are acquired from the descending path 19. The Sentinel-1 SAR satellites have a temporal sam-pling interval of 12 or 24 days, while the ALOS-2 images are uneven sampled with adjacent intervals from 14 to 224 days. The short sampling rate of Sentinel-1 SAR images has a potential of maintaining SAR coherence even if the wavelength of radar wave is short (~ 5.5 cm). The ALOS-2 SAR images with a longer wavelength (~ 24 cm) are less affected by temporal decorrelation of the SAR signal. Table 1 lists the detailed information of the SAR data. The acquisition dates of the SAR images are listed in Additional file 1: Tables S1–S3.
Dense vegetation covers Asama volcano. Figure 2b shows the Normalized Difference Vegetation Index (NDVI) (Rouse et al. 1974) calculated from the cloud-free
Sentinel-2 image acquired on 21 May 2017. Previous studies have shown that the densities of PS and DS are highly correlated with the NDVI value (Cigna et al. 2014). Given this insight, our study mainly focuses on this region of NDVI lower than 0.4 around the summit as circled by the dashed line in Fig. 2b because the dense vegetation beyond the region prevents us from obtain-ing reliable measurements due to the loss of coherence of SAR images. Additional file 1: Figure S1 shows an exam-ple of coherence from two Sentinel-1 images acquired in the summer of 2017, which demonstrates significant coherence loss outside the circled region. Although the coherence of ALOS-2 data is generally better than the Sentinel-1 data, the ALOS-2 data have a poor temporal resolution, which may degrade the quality of deforma-tion estimate over highly vegetated regions. Therefore, we focus on the region where both the C-band Sentinel-1 and ALOS-2 data can reliably obtain surface deforma-tion, forming a cross-validation between the two SAR sensors.
SAR data processing
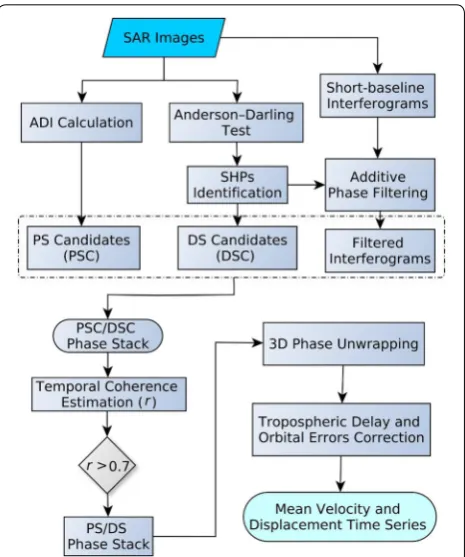
The basic idea of multi-temporal InSAR analysis is to select a subset of pixels (PS or DS) based on certain sta-tistics such as their amplitude or phase over multiple SAR images, and then estimate the mean velocities and the evolution of displacement on these selected pixels (Osmanoğlu et al. 2016). Figure 3 shows the procedure of multi-temporal InSAR analysis by jointly analyzing PS and DS as we propose in this study. Main steps of the proposed method include the generation of interfero-grams, selection of the PS and DS, three-dimensional phase unwrapping, and the calculation of the mean velocity and displacement time series. We will present these main steps in detail in this section.
Generation of SAR interferograms
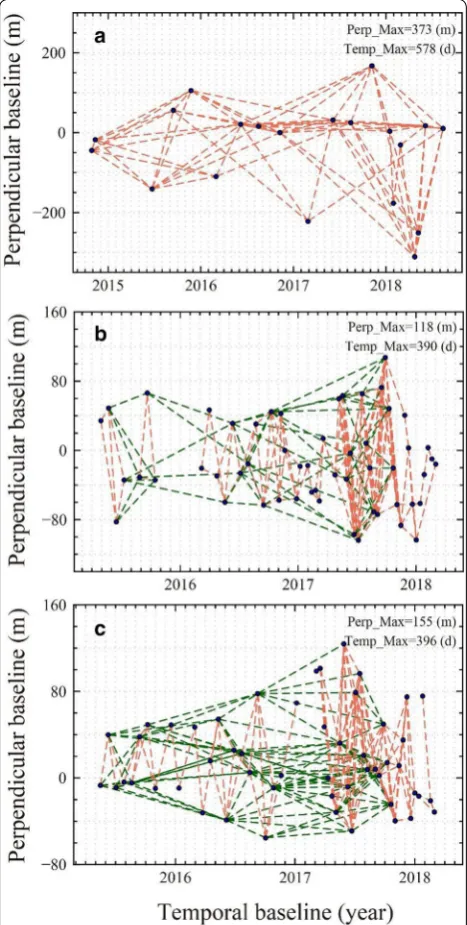
We generated SAR interferograms with small temporal and perpendicular baselines. This reduced the number of interferograms and the processing time compared with SqueeSAR™ (Ferretti et al. 2011) that makes full use of all the possible interferograms. All the SAR pairs from ALOS-2 images have perpendicular baselines
smaller than 400 m, and only those with temporal separation less than 400 days are selected to generate interferograms. For each path of the Sentinel-1 data, we selected two groups of interferograms: one group includes pairs with the maximum temporal separation of 60 days and perpendicular baseline of 200 m; the other group includes pairs with the maximum tempo-ral separation of 400 days and maximum perpendicular baseline of 100 m. We adopted such selection criteria for Sentinel-1, because Asama volcano is covered with snow most of the time in winter, leading to significant temporal decorrelation for some winter interfero-grams. We added inter-annual summer interferograms Table 1 SAR data used in this study
Satellite Time span Path number No. of images Off-nadir
angle (°) Azimuth angle (°) Resolution (Rg × Azi m) No. of interferogram
ALOS-2 20141028‒20180814 19 20 36.2 − 169.7 (descending) 1.4 × 2.1 75
Sentinel-1A 20150411‒20180302 119 58 33.8 − 166.8 (descending) 2.3 × 14.0 220
Sentinel-1B 20150430‒20180303 39 62 33.8 − 10.5 (ascending) 2.3 × 14.0 187
for the Sentinel-1 data to avoid unconnected SAR images. Figure 4a‒c show the networks for the ALOS-2 and ascending and descending Sentinel-1 images, respectively.
We used the GAMMA software to generate interfero-grams (Wegmüller and Werner 1997). A digital eleva-tion model (DEM) with a 10-m resolueleva-tion provided by Geospatial Information Authority of Japan was employed to correct for topographic phase.
PS and DS selection
Identifying PS and DS candidates
The first step of PS/DS selection is to determine PS can-didates (PSC) or DS cancan-didates (DSC) according to the statistical patterns of amplitudes of a set of SAR images. We selected PSC based on the amplitude dispersion index (ADI, DA ) defined as (Ferretti et al. 2001):
where µA and σA are the mean and standard deviation of series of amplitude values, respectively. Pixels with ADI smaller than 0.4 are considered as PSC (Hooper et al. 2004).
The selection of DSC starts from the determination of statistically homogeneous pixels (SHPs), whose ampli-tudes share similar statistical characteristics over time (Ferretti et al. 2011). For an arbitrary pixel, goodness-of-fit testing is usually employed to determine its surround-ing SHPs within a specific window (Jiang et al. 2015; Parizzi and Brcic 2011). Several testing methods such as the Kolmogorov–Smirnov test (Stephens, 1970), Ander-son–Darling test (Papoulis 1965), and the generalized likelihood ratio test (Pettitt 1976) have been proposed in recent years. Here we adopt the Anderson–Darling test to select SHPs because it has proven to be more robust than the other methods given a large stack of SAR images (Parizzi and Brcic 2011). The Anderson–Darling two-sample test is a nonparametric test with the test statistic A2 defined as (Parizzi and Brcic 2011):
where xp,i and xq,i are the amplitude time series of two pixels p and q , i=1, 2, ..M , and M is the number of SAR images, Fˆp(x) and Fˆq(x) are empirical cumulative distri-bution functions of amplitudes for the pixels p and q ,
ˆ
Fpq(x) is empirical distribution function of the pooled distribution
xp,i,xq,i
. The two pixels p and q are con-sidered homogenous if the calculated A2 for them is less than a threshold value. After the identification of SHPs, we estimated the adaptive coherence for each pixel based on its surrounding SHPs within a square window of 7 pixels. The pixels with mean coherence larger than 0.2 (1) DA=
σA µA
(2) A2= M
2
x∈{xp,i,xq,i}
ˆ
Fp(x)− ˆFq(x)
2
ˆ Fpq(x)
1− ˆFpq(x) Fig. 4 Temporal and perpendicular baselines for the a ALOS-2, b
are then considered as PSC. Additional file 1: Figure S2 shows the number of SHPs for each pixel from three SAR datasets.
We also implemented adaptive multi-looking in each interferogram to enhance the signal-to-noise ratio of the interferometric phase. The idea of adaptive multi-looking is to average a given pixel only with neighboring SHPs instead of a rectangular averaging (Jiang et al. 2015). Considering that the summit crater of Asama volcano has a diameter of only a few hundred meters, we employed a small window size (3 × 3) when implementing the adap-tive multi-looking. Compared with the phase triangu-lation method adopted in SqueeSAR™ (Ferretti et al. 2011), which also aims at improving phase quality, adap-tive multi-looking is more efficient without the require-ment of using all possible interferograms. Taking the pair 20150123‒2012021 from ascending Sentinel-1 (path 39) data as an example, Fig. 5a, b shows the initial interfero-metric phase and that after adaptive multi-looking, indi-cating a significant improvement of the phase quality.
Selection of PS and DS
With the identified PSC and DSC, we selected pixels with a stable phase over time as PS and DS. A good indica-tor of phase stability (Tizzani et al. 2007) is the temporal coherence of each PSC and DSC as estimated as follows.
Assuming that M interferograms were generated fol-lowing the criteria described in “Generation of SAR interferograms” section and unwrapped independently
using the 3D unwrapping method (Hooper et al. 2004), for a given pixel with coordinates (x,r) , the unwrapped phase of the kth interferogram computed from the SAR acquisitions at times TB and TA can be expressed as:
where k=1, 2,. . .M , is the SAR wavelength, φ(tB,x,r) and φ(tA,x,r) represent phase at the two acquisitions, d(tB,x,r) and d(tA,x,r) are the cumulative LOS
dis-placements at tB and tA with respect to the first acquisi-tion time of SAR images. �φktopo(x,r) and �φorbk (x,r) are phase errors due to uncertainties in DEM and SAR orbital parameters, respectively, in which the former can be modeled as 4π
B⊥k�h(x,r)
R·sin(θ ) and the latter can be
esti-mated and removed with a second-order polynomial fitting. B⊥k , R , h , and θ represent the perpendicular baseline, slant range, DEM uncertainty, and SAR off-nadir angle, respectively.
We solved Eq. (3) with singular value decomposition by setting the cumulative displacements and DEM error as unknown parameters. Then, we re-constructed the inter-ferometric phase ( δφ˜k ) which only consists of deforma-tion, topographic error, and orbital error. The difference between the initial and re-constructed phase represents the noise level of SAR phase history, from which we can (3)
δφk(x,r)=φ(tB,x,r)−φ(tA,x,r)
= 4π
[d(tB,x,r)−d(tA,x,r)]+�φ
topo k (x,r)
+�φkorb(x,r)+�φ noise k (x,r)
calculate the temporal coherence ( rt ) for each PSC and DSC:
Both the δ∅k and δφ˜k need to be wrapped phase to cal-culate rt which ranges between 0 and 1 (Tizzani et al.
2007). We selected the PSC and DSC with temporal coherence higher than 0.7 as PS and DS for further time series analysis.
Retrieving mean deformation rates and displacement time series
Once the selection of PS and DS is completed, we can obtain a phase stack on the selected pixels. We then imported the phase stack into the StaMPS software for further InSAR time series analysis, followed by steps of 3D phase unwrapping, correction for phase errors including orbital and topographic errors and tropo-spheric delay, estimation of mean deformation velocity, and displacement time series retrieving (Hooper 2008).
(4) rt=
M
k=1exp
j
δ∅k−δφ˜k
M
As a remark, we used the Toolbox for Reducing Atmos-pheric InSAR Noise (TRAIN) provided by Bekaert et al. (2015) to correct for tropospheric phase delay. We tested three independent correction methods within TRAIN to determine which method provides the best performance of tropospheric phase correction. They are, namely, (1) the linear phase-elevation fitting method (Zebker et al. 1994; Beauducel et al. 2000), (2) the predictive tropo-spheric estimates from ERA-Interim (ERA-I) atmos-pheric reanalysis data (Dee et al. 2011), and (3) the GACOS phase delay products from the operational high-resolution European Centre for Medium Range Weather Forecasts data (Yu et al. 2018). Previous studies have shown that none of these methods have been entirely successful in correcting for tropospheric errors in SAR interferograms, and the performance of each method highly depends on the local topo-climate conditions (Pinel et al. 2011; Kinoshita et al. 2012; Remy et al. 2015).
Results
Comparison of atmospheric corrections
Figure 6a shows the mean LOS velocities from the ascending Sentinel-1 images (path 39) without
corrections, while Fig. 6b‒d are those after the correc-tion for the tropospheric delay with the three correccorrec-tion methods as described in “Retrieving mean deformation rates and displacement time series” section. Slight dif-ferences exist between the mean velocities with the three different correction methods. The deformation field after corrections with weather models shares similar defor-mation patterns with broad LOS shortening around the volcanic base and evident LOS extension near the sum-mit. Especially, an area showing anomalous range short-ening appears on the southwest flank of the volcano more clearly after the corrections with weather models (see white polygons in Fig. 6c, d). However, the differ-ent deformation patterns between the volcanic base and summit are inconsistent with the GPS observations (see “Validation of the InSAR measurements” section).
We calculated the correlation coefficient between the interferometric phase and elevation to evaluate the per-formance of the corrections. The correlation coefficient between the elevation and the phase before corrections is 0.19, while those after the tropospheric correction by phase-elevation fitting, ERA-I, and GACOS are 0.14, 0.34, and 0.28, respectively. The linear fitting gives the smallest correlation coefficient between phase and eleva-tion, while, unexpectedly, the weather model data does not reduce the correlation coefficient. The relatively large correlation coefficients from weather model data are probably because there is significant difference in spatial resolution between the SAR images and weather mod-els, which are 75 km and 14 km for ERA-I and GACOS, respectively. Additionally, the acquisition time of a given SAR image relative to the time period of the weather model would also impact the quality of the correction (Murray et al. 2019), particularly over a high mountain area like Mt Asama with highly variable tropospheric conditions. Although the linear fitting may also remove the elevation-correlated displacements, this would not significantly affect the interpretation of deformation at Mt Asama because the correlation coefficient between the elevation and the uncorrected phase is smaller than 0.2. Therefore, we employed the phase-elevation linear fitting method to correct for the tropospheric phase delay to generate the deformation field.
Deformation field
With the SAR processing procedure presented in “SAR data processing” section, we successfully detected ground deformation at Asama volcano with high spatial resolution. The number of PS detected from the ALOS-2, ascending Sentinel-1, and descending Sentinel-1 images are 2112, 697, and 531, respectively, while the number of DS from the three datasets are 16942, 12455, and 12358, respectively. Both the numbers of PS and DS identified
from ALOS-2 images are higher than those from Sen-tinel-1 because of the higher coherence with ALOS-2 images. We identified much more DS than PS, indicating that the measurement points were remarkably improved by the inclusion of DS. As an example, Additional file 1: Figure S3 shows the distributions of PS and DS from the ascending Sentinel-1 images (path 39). Although only hundreds of PS were identified from the ascending Senti-nel-1, we included the PS in the further analysis because the PS are mainly located near the summit where the coherence loss is significant.
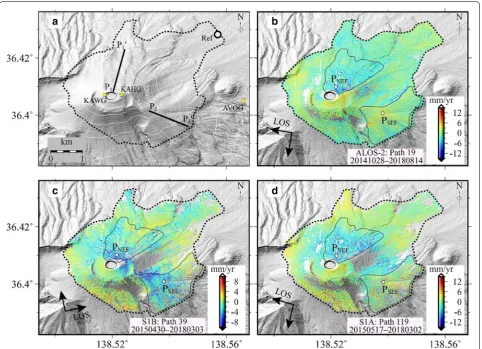
Figure 7a shows the topography with a resolution of 10 m used in this study, in which the black dotted line indicates the extent of our measurement points. Fig-ure 7b‒d show the mean LOS velocities from the ALOS-2, ascending Sentinel-1, and descending Sentinel-1 images, respectively. Additional file 1: Figure S4 shows the standard deviations of the LOS velocities estimated by the percentile bootstrapping method in StaMPS (Efron and Tibshirani 1986; Shamshiri et al. 2018). The reference point (white circle in Fig. 7a) was selected on the road at the eastern flank of the volcano, where the deformation there was assumed to be stable over the observation period. The standard deviations of the LOS velocities at the reference point from the three SAR data-sets are all smaller than 3 mm/year.
The blue and red color in Fig. 7b‒d represent the LOS extension and shortening, respectively. All the LOS measurements from the three datasets exhibit asymmet-ric patterns with deformation predominantly at the east-ern flank of the volcano. Deformation at Asama volcano can be roughly divided into two sections: the northeast flank (NEF) and the southeast flank (SEF) with areas of approximately 3.68 km2 and 2.14 km2, respectively (Fig. 7b‒d). The NEF exhibits LOS extension from all the three datasets with the maximum LOS extension rates from the ALOS-2, ascending Sentinel-1, and descending Sentinel-1 images − 14, − 12, and − 10 mm/year, respec-tively. The displaced region at SEF forms a fan shape with apparent LOS shortening and extension from descending and ascending paths, respectively. The maximum mean velocities at SEF from the three datasets range between
− 12 and 9 mm/year.
of the slope. The deformation rate along P2P2′ from the ascending path (path 39) is much higher than that from the descending paths, implying significant east–west movement.
Figure 9 shows the temporal evolution of LOS dis-placements at PNEF and PSEF, the locations of which are denoted in Fig. 7b‒d. All the time series exhibit approxi-mately linear trend over the entire period, implying that the mechanisms controlling the deformation do not change over the observation period. We did not detect significant deformation anomaly associated with a VEI 1 eruption in June 2015, suggesting that the mass transfer during this episode was limited.
We also calculated the quasi-vertical and quasi-east– west velocities by decomposing the LOS velocities from the three SAR datasets (Additional file 1: Fig. S5). The north–south component is ignored due to its insensitivity
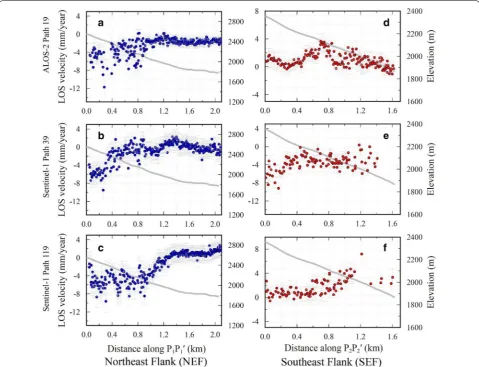
to LOS measurements by InSAR (e.g., Wright et al. 2004). Statistics of the quasi-vertical and east–west velocities show that 65% of the points within NEF show subsidence, while 59% of the points within SEF show a sliding defor-mation pattern. Table 2 shows the decomposed velocities at the selected points PNEF and PSEF. Uncertainties of the estimates were calculated by the law of error propagation (Cecchi 1991). The time series at PNEF exhibit apparent subsidence of about − 6.0 ± 0.2 mm/year with a minor east–west component. The time series at PSEF exhibit the eastward velocity of 6.7 ± 0.08 mm/year and minor sub-sidence of − 2.1 ± 0.05 mm/year. We thus suggest that the deformation at the NEF is dominated by subsidence, while the deformation at SEF is presumably in the slope direction. A possible mechanism to explain the observed deformation at NEF and SEF will be discussed in “ Pos-sible mechanism for the observed deformation” section. Fig. 7 a Topography around Asama volcano. Two solid lines indicate profiles whose LOS displacements are shown in Fig. 8. The mean LOS velocities from the b ALOS-2, c ascending Sentinel-1, and d descending Sentinel-1 images. Two deformation regions at the northeast and southeast of the volcano are circled by solid black lines in b‒d. PNEF and PSEF are the two points selected for plotting the displacement time series in Fig. 9. Black
Discussion
Validation of the InSAR measurements
Quantifying the errors of InSAR measurements is diffi-cult, primarily because the tropospheric and ionospheric phase delays cannot be completely circumvented (e.g., Remy et al. 2015). In this study, we used linear regres-sion to reduce the tropospheric delay correlated with topography, which may also partially remove the topog-raphy dependent deformation (Zebker et al. 1994; Beau-ducel et al. 2000). The displacement time series at points PNEF and PSEF from some SAR images (e.g., Fig. 9b, d, e) slightly exhibit a seasonal fluctuation, probably due to unmodelled seasonal tropospheric delays.
We validated our InSAR observations with GNSS measurements from three continuous GNSS stations (KAWG, KAHG, and AVOG in Fig. 1). Additional file 1: Figure S6 shows the displacement time series in
east–west, north–south, and vertical directions at these three GNSS sites. The displacements at KAHG and AVOG cover the whole period of our InSAR observa-tion, while the records at KAWG are unavailable after January 2017 due to a power outage. To compare the GNSS measurements with our InSAR observations, we calculated the vertical velocities of KAHG and KAWG (Fig. 10) between October 2014 and March 2018 rela-tive to AVOG. We did not include the horizontal dis-placements of the GNSS stations for comparison, because the relative horizontal displacements between KAHA/KAWG and AVOG are much smaller than verti-cal displacements (see Fig. 1). The mean vertical veloci-ties at KAHG and KAWG are − 5.6 and − 1.1 mm/ year (Fig. 10), respectively, which are comparable with our InSAR observations with a maximum difference of 3.2 mm/year (Table 2). The GNSS measurements Fig. 8 LOS velocities along the two profiles P1P1′ and P2P2′ (Fig. 7a) that encompass NEF and SEF, respectively. LOS velocities along P1P1′ from
the a ALOS-2, b ascending Sentinel-1, and c descending Sentinel-1 images. d–f Similar to a–c but for the profile P2P2′. Note the positive velocity
also confirm that the deformation mainly took place on the eastern flank of the volcano. We then projected the 3D displacements from KAHG at the east side of the volcano into the radar LOS direction to compare with InSAR measurements. The comparisons (Fig. 11) indicate that the displacement time series from both ascending Sentinel-1 (path 39) and descending ALOS-2 (path 19) are consistent with the GNSS measurements.
Comparison with historical deformation records at Asama volcano
Compared with the historical deformation patterns recorded at Asama volcano, our InSAR observations do not reveal an apparent transition between inflation and deflation. The temporal evolution of displacements from InSAR exhibits a linear trend at both the NEF and SEF of the volcano (“Deformation field” section). One possible reason for the constant temporal patterns in the observed deformation could be the dominance of shallow mechanisms (e.g., thermal contraction, flank instability) rather than deeper magma pressurization/ Fig. 9 Time series of LOS changes at the two selected points PNEF and PSEF (Fig. 7). a‒c Time series at PNEF from the ALOS-2, ascending Sentinel-1,
and descending Sentinel-1 images. d‒f Similar to a–c but for the point PSEF. Error bars are standard deviations estimated over the points located
within a window with size of 3 × 3 pixels
Table 2 Velocities in the LOS, east–west, and vertical components at four representative points
PNEF and PSEF are located at the center of NEF and SEF (Fig. 7a), respectively; KAHG and KAWG are GNSS stations located at the edge of the Kamayama summit crater
(Fig. 1). All the values are in mm/year
Points ALOS-2
(path 19) Sentinel-1B(path 39) Sentinel-1A(path 119) East–west Vertical
PNEF − 5.5 ± 0.7 − 4.2 ± 0.8 − 5.2 ± 1.4 − 0.8 ± 0.3 − 6.0 ± 0.2
PSEF 2.2 ± 0.9 − 5.4 ± 1.3 1.9 ± 0.7 6.7 ± 0.08 − 2.1 ± 0.05
KAHG − 7.1 ± 1.3 − 8.5 ± 2.9 − 4.9 ± 2.0 2.1 ± 2.4 − 8.8 ± 1.6
KAWG − 1.2 ± 0.7 1.6 ± 1.2 0.8 ± 0.5 − 1.7 ± 2.0 0.9 ± 1.3
depressurization cycles. Moreover, these ground-based measurements were primarily conducted far from the summit, while our InSAR measurements mainly cover the summit region and the upper flanks. The deforma-tion induced by infladeforma-tion or defladeforma-tion of the magma sources under Mt Asama may be spatially broad and are insensitive to our application of InSAR.
Possible mechanism for the observed deformation
As shown in “Results” section, we observed two deformed regions at the NEF and SEF of Asama vol-cano, respectively. In this section, we will inspect possible mechanisms to account for the observed deformation and highlight the importance of continu-ous deformation monitoring for mitigating future vol-canic hazard at Mt Asama.
Possible mechanism for the deformation at NEF
The NEF of Asama volcano exhibits continuous subsid-ence during the whole period. Recent studies have shown that continuous subsidence at active volcanoes may be explained by several mechanisms such as magma with-drawal (e.g., Lu et al. 2010), consolidation of erupted deposits (e.g., Grapenthin et al. 2010), viscoelastic relaxa-tion of the host rock (Yamasaki et al. 2018), thermal con-traction of lava deposits or intruded magma body (e.g., Tallarico 2003; Wang and Aoki 2019), and the pore pres-sure drop associated with hydrothermal fluid circula-tions (Wauthier et al. 2018). We first excluded the magma withdrawal and viscoelastic relaxation, because these two mechanisms generally induce broadly symmetric defor-mation around the magma source, inconsistent with the observed deformation. Also, these two mechanisms pro-duce deformation with a spatial scale broader than what we observe in this study.
Thermal contraction of the lava flow may be respon-sible for the observed subsidence. The geological map indicates that the NEF is covered by a lava flow region during the 1783 eruption. Yasui and Koyaguchi (2004) estimated the thickness of lava deposits at NEF ranging from about 20 m at the flank to about 90 m near the sum-mit. The amount of observed deformation is correlated with the thickness of the lava deposit (Fig. 8). The dura-tion of thermoelastic contracdura-tion depends on the volume and depth of the source as well as the thermal diffusivity of the surrounding crust (Furuya 2005). Recent studies at Usu volcano in Japan have shown that it takes more than 160 years for the surface subsidence to become smaller than 1 mm/year if we assume a heat source with a vol-ume of 5 × 10⁶ m3 at a depth of about 100 m, a tempera-ture of 1000 K, and thermal diffusivity of 1 × 10⁻⁵ m2/s. If we assume that the average thickness of the lava deposits is 50 m at the northeast summit of Asama volcano, the volume of the heat source is similar to the case above. We thus suggest that the thermoelastic contraction of the 1783 lava flow is unlikely to fully explain the subsid-ence at NEF of Asama, where subsidsubsid-ence with rates up to − 10 mm/year is observed. Moreover, considering that meteorological precipitation and groundwater flow would accelerate the cooling process (Chaussard 2016; Wang and Aoki 2019), some other mechanism must also contribute to the observed subsidence at NEF of Asama.
than the recent intrusions due to slow cooling and thus prevent the magma in the deep reservoir from intruding upward directly but along the conduit toward the current crater (Fig. 11). This internal structure of Asama volcano results in a flow of hydrothermal fluid from depth to the east side of the volcano, where Usui et al. (2017) reported a porous layer with higher water content at a depth of ~ 1 km above sea level. Due to the lack of independ-ent constraints from, say, the pressure, temperature, or fluid flux at Asama volcano, we were not able to conduct detailed modeling of the observed deformation to infer the properties of the hydrothermal system beneath the volcano. Assuming that the surface subsidence is entirely due to the loss of pore volume in the porous layer, the relationship between vertical subsidence ( z ) and poros-ity loss can be expressed as (Todesco et al. 2014).
where z0 is the thickness of the porous rock layer, ε0 and ε are the initial porosity and that after the porosity loss. We can estimate that a 1% loss of porosity in rock layer with a thickness of 50 m would cause surface subsid-ence of 213‒495 mm with a typical initial porosity value of 0.3‒0.5. Therefore, we argue that compaction of a porous layer at the east side of Asama volcano could be a possible reason for the observed subsidence at the NEF. Morita et al. (2016) reported that massive degassing of CO2 was mainly observed at the eastern part of the sum-mit of Asama volcano and suggested that the permeable
(5)
�z=z0(ε0−ε)/(1−ε)
zones connected to the deep hydrothermal fluid layer are responsible for the substantial degassing. The pore pres-sure drops may be triggered by changes in the feeding rate of magmatic gases at the base of the hydrothermal system or changes in permeability of the porous layer (Wauthier et al. 2018).
Possible mechanism of the deformation at SEF
We observed both vertical and horizontal displace-ments at the SEF of Asama volcano (“Results” sec-tion). LOS changes from the ascending path are much more apparent than from the descending path (Fig. 7), indicating that the surface moves mainly to the south-east in the slope direction. Considering the average slope angle at SEF of about 20°, we speculate that the displacements at SEF are due to slope instability. The geological map shows that SEF is covered by old lava deposits of Hotokeiwa volcano, which was active about 11,000 years ago. The linear deformation trend at SEF (Fig. 8d–f) indicates that the deformation there is likely a constant process at least in the latest decades or so although our InSAR observations only cover about 4 years.
Ongoing long-term flank motion at active volcanoes has been reported globally (e.g., Borgia et al. 2000; Di Traglia et al. 2014; Poland et al. 2017; Schaefer et al. 2019). Observations of flank instability at large basaltic volcanoes suggested that a weak substrate beneath the sliding surface should exist to accommodate persistent motion (Poland et al. 2017). Moreover, rates of flank motion are affected by several factors such as the mag-nitude of magma supply rate, the thickness of the sub-strate, and gravitational spreading of the edifice (Poland et al. 2017). However, the rock types at Hotokeiwa are dominated by dacite to rhyolite (Yasui 2018), which are much more viscous than basaltic, and little is known about the internal structure and deposit thicknesses of Hotokeiwa volcano. Therefore, inferring the prop-erties of the sliding substrate is unrealistic from only our InSAR observations. Nonetheless, considering low magmatic activities at Asama without large surface deformation (“Comparison with historical deformation records at Asama volcano” section), we suggest that the gravitational loading on the SEF plays a key role in affecting the slope motion. The spreading of small hori-zontal velocity (< 10 mm/year) at the SEF also indicates that the depth of the sliding surface is deep seated. In contrast, surficial flank motions such as remobilization of volcanoclastic material and material erosion are typi-cally localized and much faster (Schaefer et al. 2019). Fig. 12 A schematic view of potential magma pathway at Asama
Persistent deep-seated flank motion at active volca-noes is less likely to evolve into large-volume landslides, because elastic stress can be relaxed due to the very slow deformation rate (De Vries and Borgia 1996). This is jus-tified by the absence of scarps or benches on the surface of the SEF at Mt Asama and no recording of large slope failure there. However, a sudden trigger to failure through the interaction of volcanic activity and slope instability is possible. Observations of flank instability at Strom-boli volcano, Italy have shown that increase in magmatic pressurization may promote the sliding rate and eventu-ally result in catastrophic failure along the preexisting shallow substrate (Di Traglia et al. 2014). Deep-seated flank motions evolving into debris avalanches can typi-cally result in failure volume of more than 1 × 10⁷ m3, such as the debris avalanche at Mount St Helens in 1980 with volume of 2.5 × 10⁹ m3 (Glicken 1996), and at Sou-friere Hills volcano in 2003 with volume of 2.1 × 10⁸ m3 (Herd et al. 2005). We thus argue that close monitoring of the flank instability at the SEF of Asama volcano should be taken in the future, given the significant threat of the SEF to the infrastructure and communities downstream.
Conclusions
By combining persistent and distributed scatterers, we successfully obtained the surface deformation of Asama volcano for the first time with SAR satellites between 2014 and 2018. Dense measurement points on the sum-mit and flanks reveal two deformation regions, which are located at the northeast and southeast flanks of the vol-cano with areas of about 3.68 km2 and 2.14 km2, respec-tively. The northeast flank exhibits vertical subsidence of up to − 10 mm/year near the summit. The southeast flank exhibits both vertical and eastward displacements of about − 2.1 and 6.7 mm/year, respectively. Temporal evolution of displacements at both the two deformation regions shows a nearly linear trend over the observation period, which is confirmed by the GNSS measurements.
We interpreted that the vertical subsidence at the northeast flank of Mt Asama is mainly due to the pore pressure drop of a porous layer related to the hydrother-mal activity of the volcano. Although the northeast flank is on the lava deposits of the 1783 eruption, the thermal contraction is likely minor after more than 200 years since lava emplacement. Considering the presence of both vertical and horizontal displacements at the south-east flank, we argue that flank instability is responsible for the deformation there. Continuous monitoring of the southeast flank of Asama volcano is necessary consider-ing an existconsider-ing weaker layer at a shallow depth may be responsible for flank instability and be stimulated by a future eruption.
Supplementary information
Supplementary information accompanies this paper at https ://doi. org/10.1186/s4062 3-019-1104-9.
Additional file 1. Additional figures and tables.
Abbreviations
ADI: Amplitude dispersion index; DEM: Digital elevation model; DS: Distributed scatterers; GNSS: Global navigation satellite system; InSAR: Interferometric synthetic aperture radar; LOS: Line of sight; NDVI: Normalized Difference Vegetation Index; NEF: Northeast flank; PS: Persistent scatterers; SEF: Southeast flank; SHPs: Statistically homogeneous pixels; StaMPS: Stanford Method for Persistent Scatterers; TRAIN: Toolbox for Reducing Atmospheric InSAR Noise; VEI: Volcanic Explosivity Index.
Acknowledgements
This work is supported by Integrated Program for Next Generation Volcano Research and Human Resource Development Japan. The authors would thank Zhenhong Li for providing the GACOS atmospheric phase delay products. Parts of the figures were created by Generic Mapping Tools (Wessel et al. 2013).
Authors’ contributions
XW processed the SAR images and conducted the result analyzing, as well as written the draft paper. YA helped analyze and interpret the deformation, as well as revised the manuscript. JC contributed to the development of the codes for SAR data processing. All authors read and approved the final manuscript.
Funding
XW is supported by the National Natural Science Foundation of China (Grant No. 41804009).
Availability of data and materials
The Sentinel-1 SAR images are provided by the European Space Agency, which can be freely downloaded from https ://scihu b.coper nicus .eu/. The ALOS-1/2 SAR data are shared among PIXEL (PALSAR Interferometry Consortium to Study our Evolving Land surface), and provided by the Japan Aerospace Exploration Agency (JAXA) under a cooperative research contract with the Earthquake Research Institute, The University of Tokyo. The ownership of PALSAR and PALSAR-2 data belongs to the Ministry of Economy, Trade, and Industry, and JAXA.
Ethics approval and consent to participate
Not applicable.
Consent for publication
Not applicable.
Competing interests
The authors declare that they have no competing interests.
Author details
1 Earthquake Research Institute, The University of Tokyo, Tokyo, Japan. 2 Department of Surveying and Geo-Informatics, Faculty of Geosciences
and Environmental Engineering, Southwest Jiaotong University, Chengdu, China. 3 Institute of Space and Earth Information Science, The Chinese
Univer-sity of Hong Kong, Hong Kong, China.
Received: 22 July 2019 Accepted: 1 November 2019
References
Aramaki S (1963) Geology of Asama volcano. J Fac Sci Univ Tokyo 2:229–443 Beauducel B, Briole P, Froger JL (2000) Volcano-wide fringes in ERS synthetic aperture radar interferograms of ETNA (1992–1998): deformation or tropospheric effect? J Geophys Res 105:16391–16402
Bekaert DPS, Walters RJ, Wright TJ, Hooper AJ, Parker DJ (2015) Statistical comparison of InSAR tropospheric correction techniques. Remote Sens Environ 170:40–47. https ://doi.org/10.1016/j.rse.2015.08.035
Borgia A, Delaney PT, Denlinger RP (2000) Spreading volcanoes. Annu Rev Earth Planet Sci 28:539–570. https ://doi.org/10.1146/annur ev.earth .28.1.539
Cecchi GC (1991) Error analysis of the parameters of a least-squares deter-mined curve when both variables have uncertainties. Meas Sci Technol 2:1127–1128. https ://doi.org/10.1088/0957-0233/2/12/001
Chaussard E (2016) Subsidence in the Parícutin lava field: causes and implica-tions for interpretation of deformation fields at volcanoes. J Volcanol Geoth Res 320:1–11. https ://doi.org/10.1016/j.jvolg eores .2016.04.009 Cigna F, Bateson LB, Jordan CJ, Dashwood C (2014) Simulating SAR
geo-metric distortions and predicting Persistent Scatterer densities for ERS-1/2 and ENVISAT C-band SAR and InSAR applications: nationwide feasibility assessment to monitor the landmass of Great Britain with SAR imagery. Remote Sens Environ 152:441–466. https ://doi.org/10.1016/j. rse.2014.06.025
Crosetto M, Monserrat O, Cuevas-González M, Devanthéry N, Crippa B (2016) Persistent scatterer interferometry: a review. ISPRS J Photogram Remote Sens 115:78–89. https ://doi.org/10.1016/j.isprs jprs.2015.10.011
Dee DP, Uppala SM, Simmons AJ, Berrisford P, Poli P, Kobayashi S, Vitart F (2011) The ERA-Interim reanalysis: configuration and performance of the data assimilation system. Quart J R Meteorol Soc 137:553–597. https ://doi. org/10.1002/qj.828
De Vries BVW, Borgia A (1996) The role of basement in volcano deformation. Geol Soc 110:95–110. https ://doi.org/10.1144/GSL.SP.1996.110.01.07 Di Traglia F, Nolesini T, Intrieri E, Mugnai F, Leva D, Rosi M, Casagli N (2014) Review of ten years of volcano deformations recorded by the ground-based InSAR monitoring system at Stromboli volcano: a tool to mitigate volcano flank dynamics and intense volcanic activity. Earth Sci Rev 139:317–335. https ://doi.org/10.1016/j.earsc irev.2014.09.011
Efron B, Tibshirani R (1986) Bootstrap methods for standard errors, confidence intervals, and other measures of statistical accuracy. Stat Sci. 1:54–77. https ://doi.org/10.1214/ss/11770 13815
Ferretti A, Prati C, Rocca F (2001) Permanent scatterers in SAR interferometry. IEEE Trans Geosci Remote Sens 39:8–20. https ://doi.org/10.1109/36.89866 1
Ferretti A, Fumagalli A, Novali F, Prati C, Rocca F, Rucci A (2011) A new algorithm for processing interferometric data-stacks: squeeSAR. IEEE Trans Geosci Remote Sens 49:3460–3470. https ://doi.org/10.1109/ tgrs.2011.21244 65
Furuya M (2005) Quasi-static thermoelastic deformation in an elastic half-space: theory and application to InSAR observations at Izu-Oshima vol-cano, Japan. Geophys J Int 161:230–242. https ://doi.org/10.1111/j.1365-246X.2005.02610 .x
Glicken H (1996) Rockslide-debris avalanche of May 18, 1980, Mount St. Helens volcano, Washington. US Geological Survey (Open File Report), 96‒677. https ://doi.org/10.3133/ofr96 677
Grapenthin R, Ófeigsson BG, Sigmundsson F, Sturkell E, Hooper A (2010) Pres-sure sources versus surface loads: analyzing volcano deformation signal composition with an application to Hekla volcano, Iceland. Geophys Res Lett. https ://doi.org/10.1029/2010G L0445 90
Hayakawa Y (2006) Aerial view of Asama Volcano from the NE. J Geogr. https :// doi.org/10.5026/jgeog raphy .115.2_Plate 1 (in Japanese)
Herd RA, Edmonds M, Bass VA (2005) Catastrophic lava dome failure at Sou-frière Hills volcano, Montserrat, 12–13 July 2003. J Volcanol Geotherm Res. 148:234–252
Hooper A (2008) A multi-temporal InSAR method incorporating both persis-tent scatterer and small baseline approaches. Geophys Res Lett. https :// doi.org/10.1029/2008g l0346 54
Hooper A, Zebker H, Segall P, Kampes B (2004) A new method for measuring deformation on volcanoes and other natural terrains using InSAR persis-tent scatterers. Geophys Res Lett. https ://doi.org/10.1029/2004g l0217 37 Hooper A, Bekaert D, Spaans K, Arıkan M (2012) Recent advances in SAR inter-ferometry time series analysis for measuring crustal deformation. Tec-tonophysics 514–517:1–13. https ://doi.org/10.1016/j.tecto .2011.10.013
Jiang M, Ding X, Hanssen RF, Malhotra R, Chang L (2015) Fast statistically homogeneous pixel selection for covariance matrix estimation for mul-titemporal InSAR. IEEE Trans Geosci Remote Sens 53:1213–1224. https :// doi.org/10.1109/tgrs.2014.23362 37
Kazahaya R, Aoki Y, Shinohara H (2015) Budget of shallow magma plumb-ing system at Asama volcano, Japan, revealed by ground deformation and volcanic gas studies. J Geophys Res 120:2961–2973. https ://doi. org/10.1002/2014J B0117 15
Kinoshita Y, Furuya M, Hobiger T, Ichikawa R (2012) Are numerical weather model outputs helpful to reduce tropospheric delay signals in InSAR data? J Geodesy 87:267–277. https ://doi.org/10.1007/s0019 0-012-0596-x Lu Z, Dzurisin D, Biggs J, Wicks C, McNutt S (2010) Ground surface deformation
patterns, magma supply, and magma storage at Okmok volcano, Alaska, from InSAR analysis: 1. Intereruption deformation, 1997–2008. J Geophys Res. https ://doi.org/10.1029/2009j b0069 69
Morita M, Mori T, Kazahaya R, Tsuji H (2016) Diffuse carbon dioxide emis-sions from hidden subsurface structures at Asama volcano, Japan. Bull Volcanol. https ://doi.org/10.1007/s0044 5-016-1008-5
Murase M, Ono K, Ito T, Miyajima R, Mori H, Aoyama H, Fujii N (2007) Time-dependent model for volume changes in pressure sources at Asama volcano, central Japan due to vertical deformations detected by precise leveling during 1902–2005. J Volcanol Geoth Res 164:54–75. https ://doi. org/10.1016/j.jvolg eores .2007.04.001
Murray KD, Bekaert DPS, Lohman RB (2019) Tropospheric corrections for InSAR: statistical assessments and applications to the Central United States and Mexico. Remote Sens Environ 232:111326. https ://doi.org/10.1016/j. rse.2019.11132 6
Newhall CG, Self S (1982) The Volcano Explosivity Index (VEI): an estimate of explosive magnitude for historical volcanism. J Geophys Res 87:1231– 1238. https ://doi.org/10.1029/JC087 iC02p 01231
Osmanoğlu B, Sunar F, Wdowinski S, Cabral-Cano E (2016) Time series analysis of InSAR data: methods and trends. ISPRS J Photogram Remote Sens 115:90–102. https ://doi.org/10.1016/j.isprs jprs.2015.10.003 Papoulis A (1965) Probability, random variables and stochastic processes.
McGraw-Hill, New York
Parizzi A, Brcic R (2011) Adaptive InSAR Stack Multilooking exploiting ampli-tude statistics: a comparison between different techniques and practical results. IEEE Geosci Remote Sens Lett 8:441–445. https ://doi.org/10.1109/ lgrs.2010.20836 31
Pettitt AN (1976) A two-sample Anderson-Darling rank statistic. Biometrika 63:161–168
Pinel V, Hooper A, De la Cruz-Reyna S, Reyes-Davila G, Doin MP, Bascou P (2011) The challenging retrieval of the displacement field from InSAR data for andesitic stratovolcanoes: case study of Popocatepetl and Colima Volcano, Mexico. J Volcanol Geoth Res 200:49–61. https ://doi. org/10.1016/j.jvolg eores .2010.12.002
Pinel V, Poland MP, Hooper A (2014) Volcanology: lessons learned from syn-thetic aperture radar imagery. J Volcanol Geoth Res 289:81–113. https :// doi.org/10.1016/j.jvolg eores .2014.10.010
Poland MP, Peltier A, Bonforte A, Puglisi G (2017) The spectrum of persistent volcanic flank instability: a review and proposed framework based on Kīlauea, Piton de la Fournaise, and Etna. J Volcanol Geoth Res 339:63–80. https ://doi.org/10.1016/j.jvolg eores .2017.05.004
Rouse JW, Haas RH, Scheel JA, Deering, DW (1974) Monitoring vegetation systems in the great plains with ERTS. In: Proceedings, 3rd Earth Resource Technology Satellite (ERTS) Symposium 1, p. 48‒62
Remy D, Chen Y, Froger JL, Bonvalot S, Cordoba L, Fustos J (2015) Revised interpretation of recent InSAR signals observed at Llaima volcano (Chile). Geophys Res Lett 42:3870–3879. https ://doi.org/10.1002/2015g l0638 72 Schaefer LN, Di Traglia F, Chaussard E, Lu Z, Nolesini T, Casagli N (2019) Moni-toring volcano slope instability with Synthetic Aperture Radar: a review and new data from Pacaya (Guatemala) and Stromboli (Italy) volcanoes. Earth Sci Rev 192:236–257. https ://doi.org/10.1016/j.earsc irev.2019.03.009 Shamshiri R, Nahavandchi H, Motagh M, Hooper A (2018) Efficient ground
Takeo M, Aoki Y, Ohminato T, Yamamoto M (2006) Magma supply path beneath Mt. Asama Volcano, Japan. Geophys Res Lett 33:15310. https :// doi.org/10.1029/2006g l0262 47
Tallarico A (2003) Modeling long-term ground deformation due to the cooling of a magma chamber: case of Basiluzzo island, Aeolian Islands, Italy. J Geophys Res. https ://doi.org/10.1029/2002j b0023 76
Tizzani P, Berardino P, Casu F, Euillades P, Manzo M, Ricciardi G, Lanari R (2007) Surface deformation of Long Valley caldera and Mono Basin, California, investigated with the SBAS-InSAR approach. Remote Sens Environ 108:277–289. https ://doi.org/10.1016/j.rse.2006.11.015
Todesco M, Costa A, Comastri A, Colleoni F, Spada G, Quareni F (2014) Vertical ground displacement at Campi Flegrei (Italy) in the fifth century: rapid subsidence driven by pore pressure drop. Geophys Res Lett 41:1471– 1478. https ://doi.org/10.1002/2013G L0590 83
Tsunematsu N, Nagai T, Murayama T, Adachi A, Murayama Y (2008) Volcanic ash transport from mount Asama to the Tokyo metropolitan area influenced by large-scale local wind circulation. J Appl Meteorol Climatol 47:1248–1265. https ://doi.org/10.1175/2007j amc16 44.1
Usui Y, Ogawa Y, Aizawa K, Kanda W, Hashimoto T, Koyama T, Kagiyama T (2017) Three-dimensional resistivity structure of Asama Volcano revealed by data-space magnetotelluric inversion using unstructured tetrahedral ele-ments. Geophys J Int 208:1359–1372. https ://doi.org/10.1093/gji/ggw45 9 Wang X, Aoki Y (2019) Posteruptive thermoelastic deflation of intruded
Magma in Usu Volcano, Japan, 1992–2017. J Geophys Res 124:335–357. https ://doi.org/10.1029/2018J B0167 29
Wauthier C, Smets B, Hooper A, Kervyn F, d’Oreye N (2018) Identification of subsiding areas undergoing significant magmatic carbon dioxide degas-sing, along the northern shore of Lake Kivu, East African Rift. J Volcanol Geoth Res 363:40–49. https ://doi.org/10.1016/j.jvolg eores .2018.08.018 Wegmüller U, Werner CL (1997) Gamma SAR processor and
interferom-etry software, Proc. the 3rd ERS Symposium, ESA, Florence, Italy, pp. 1686‒1692
Wessel P, Smith WHF, Scharroo R, Luis J, Wobbe F (2013) Generic Map-ping Tools: improved Version Released. Eos Trans Am Geophys Union 94:409–410. https ://doi.org/10.1002/2013E O4500 01
Wright TJ, Parsons BE, Lu Z (2004) Toward mapping surface deforma-tion in three dimensions using InSAR. Geophys Res Lett. https ://doi. org/10.1029/2003G L0188 27
Yamasaki T, Kobayashi T, Wright TJ, Fukahata Y (2018) Viscoelastic crustal deformation by magmatic intrusion: a case study in the Kutcharo caldera, eastern Hokkaido, Japan. J Volcanol Geoth Res 349:128–145. https ://doi. org/10.1016/j.jvolg eores .2017.10.011
Yasui M (2018) Textures of the Eruptive Products of Asama-Maekake Volcano from the 12th Century: Indicator of Eruptive Processes. Proceedings of the Institute of Natural Sciences, Nihon University. pp. 37-50
Yasui M, Koyaguchi T (2004) Sequence and eruptive style of the 1783 eruption of Asama Volcano, central Japan: a case study of an andesitic explosive eruption generating fountain-fed lava flow, pumice fall, scoria flow and forming a cone. Bull Volcanol 66:243–262. https ://doi.org/10.1007/s0044 5-003-0308-8
Yu C, Li Z, Penna NT, Crippa P (2018) Generic atmospheric correction model for interferometric synthetic aperture radar observations. J Geophys Res 123:9202–9222. https ://doi.org/10.1029/2017J B0153 05
Zebker HA, Werner CL, Rosen PA, Hensley S (1994) Accuracy of topographic maps derived from ERS-1 interferometric radar. IEEE Trans Geosci Remote Sens 32:823–836. https ://doi.org/10.1109/36.29801 0
Publisher’s Note