Woody Species Structure and Regeneration Status in Kafta-Sheraro
National Park Forest, Tigray Region, Ethiopia
Fitsum Temesgen1*, Bikila Warkineh2
1Addis Ababa University, Center of Environmental Sciences, Addis Ababa, Ethiopia 2Addis Ababa University, Center of Environmental Sciences, Addis Ababa, Ethiopia
* Corresponding Author: fitsetee21@gmail.com
Abstract
The natural vegetation study was conducted in Kafta-sheraro national park (KSNP) North,
Ethiopia to explore floristic composition, structure and regeneration of woody species in the home
of African elephant. In the park, the above information is not well documented which is necessary
for conservation. Data were collected From August to December 2018. The vegetation data were
collected from 161 quadrats of size 20m×20m, 5mx5m for shrub ̸ tree, sapling and seedling
respectively. Individual trees and shrubs DBH >=2.5cm and height >=2m were measured using
Tape meter and Clinometer respectively. DBH, frequency, density, basal area, and IVI were used
for vegetation structure. A total of 70 woody species 46 (65.7%) trees, 18 (25.7%) shrubs and 6
(8.6%) tree ̸ shrub) were identified. The total basal area and density of 79.3 m2 ha-1, and 466 ±12.8
(S.E.) individuals ha-1 were calculated for 64 woody species. Fabaceae was the most dominant
family occupied 16 species (23.0%) followed by Combretaceae 8 species (11.4%). Acacia
mellifera and Combretum hartmannianum were the most dominant and frequent species.
Abnormal patterns of selected woody species were dominantly identified. Regenerating status all
the woody plant species was categorized as “Fair” (18.75%), “Poor” (7.81 %) and “None”
(73.44%).However, there is good initiation for conservation of the park; still the vegetation of the
park was threatened by firewood collection, charcoal production, fire, intensive farming, mining
and over grazing. Therefore, the study area as the habitat for the population of the African elephant;
the KSNP should be recommended the highest conservation priority and studied the soil seed bank
of species having poor regeneration condition.
Key words: Kafta-sheraro national park; woody species structure; regeneration status
1. Introduction
Ethiopia is considered as one of the top twenty five biodiversity richest countries in the world
(WCMC, 1994). It is estimated to around 6000 species of higher plants, of which about 10%
endemic plants) (Ensermu and Sebsebe, 2014).The flora is very heterogeneous and has a rich
endemic element owing to the diversity in climate, vegetation and terrain. While six endangered
endemic plant species are found in Ethiopia especially in the Ogaden region of the ecosystem only,
this is floristically the richest in endemism of species in the country (Ensermu et al., 1992).
Population structure is the distribution of individuals of each species in arbitrarily to provide the
overall regeneration profile of the forest based on tree density, height, frequency, diameter at breast
height, species importance value and basal area (Getachew et al., 2002; Shibru and Balcha, 2004).
Examination of patterns of species population structure could provide valuable information about
their regeneration and/or recruitment status as well as viability status of the population that could
further be employed for devising evidence-based conservation and management strategies (Abiyou
et al., 2011).
Regeneration is a central component of forest ecosystem dynamics and restoration of degraded
forest lands. Sustainable forest utilization is only possible if adequate information on the
regeneration dynamics and factors influencing important canopy tree species is available
(Getachew et al., 2010). The regeneration status of species in a community can be accessed from
the total population dynamics of seedlings and saplings in the forest community (Getachew et al.,
2002; Duchok et al., 2005). The overall pattern of population dynamics of seedlings, saplings and
adults of a plants species can exhibit the regeneration profile, which is used to determine their
regeneration status (Tamrat, 1994). A population with sufficient number of seedlings and saplings
depicts satisfactory regeneration behavior (Pokhriyal et al. 2010), while inadequate number of
seedlings and saplings of the species in a forest indicates poor regeneration condition (Tripathi and
Khan, 2007). Moreover, Regeneration status of a forest is poor if number of seedlings and saplings
are much less than mature individuals (Kedir et al., 2015).The anthropogenic disturbances (illegal
fire, over grazing, intensive farming and firewood collection) revealed high degradation of
population structure and regeneration status of the trees in the studied forest ecosystem (Getaneh
et al., 2019). Assessment of soil seed banks, seedling banks and population structure has some
practical importance in forest conservation and management (Haileab et al., 2011).
Most of the vegetation resources of the world are concentrated in protected areas (IUCN,
(Yalden and Largen, 1992). Protected areas play a vital role in biodiversity conservation (Molla et
al., 2010). However, the vegetation resources of Ethiopian protected area are being destroyed at
an alarming rate, because of habitat degradation or loss, fragmentation due to livestock
encroachment, illegal settlement, agricultural expansion, deforestation, burning of vegetation for
cultivation and mining, land-use and border conflicts of local communities. Moreover, vegetation
cover is being converted for subsistence and commercial agriculture, timber used for fuel wood
and construction, protected grasslands used for livestock grazing, and wetland destruction leads to
the decline of vegetation and vegetation resource (Malede and Girma, 2015; Getachew and
Weldemariam, 2016 ).
Kafta-Sheraro National Park (KSNP) is a newly established as a park while formerly named Shire
wildlife reserve in Tigray region which was established in 1965e.c (Source: information obtained
from local informants). The park is rich in natural vegetation and great wildlife resources
particularly the home of mega herbivores of African elephant. Therefore, for effective
management and conservation of the park, there is an urgent need to develop a sound management
plan, and this required detailed base line information on the general stand structure and seedling
and sapling status of woody species. However, KSNP currently lacks scientific and essential base
line information on vegetation that is fundamental for sustainable management and conservation
of the park tree species. The aim of this study focused on stand structure and regeneration status
of the woody species.
2. Materials and Methods
2.1 Study Site
Kafta-Shirero national park is located in Kafta-humera and Tahtay-adeyabo weredas of Western
and North-western Zones of Tigray region 1356km far from Addis Ababa and 490km of Mekelle
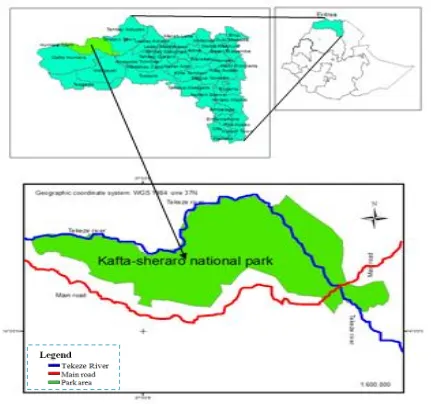
City. The park is situated in the northwest of Ethiopia between latitude 140 05’-140 27’ N and
longitude 360 42’-37039’ E. The park bordered by Eritrea in the north through Tekeze River
(Figure 1). The elevation of the park varies from 539 to 1130 m.a.s.l. The landforms of the areas
are heterogeneous in nature and consist of flat plain, undulating to rolling, some isolated hills and
Figure 1: Location of the study site
Climate: The mean monthly temperature ranges from 28.35°C to 35.1°C. The coolest
temperatures occur from July to September while the warmest temperatures occur from March to
May. The maximum mean monthly temperature ranges from March to May while the minimum
ranges both in August and January, respectively. The rainfall pattern is bimodal with two distinct
seasons. The short rains occur during May to mid June and September whereas the long rains occur
during July and August. The nearby stations of Humera and shiraro district of meteorological
Figure 2: Mean monthly Rainfall and Temperature of Humera and Shiraro Meteorological Center from 1966-2016 (Ethiopian National Meteorological Agency, 2018)
2.2 Sampling design
A reconnaissance survey was taken from August, 18 to 25-2018 in order to have an impression of
the forest sites and systematic sampling design was applied following (Kent and Coker, 1992).
According to Cain, (1959,1938) and McIntosh, (1985) species-area curve (minimal area)
concept; the plot size was decided. Then a quadrats size of 20mx20m (400m2) were established
along a line-transects following (Muller-Dombois and Ellenberg, 1974; Kumlachew and Tamrat,
2002; Getaneh et al., 2019). A total of 161 plots and adjacent 32 transects were placed at a distance
of 200m and 300m apart respectively following (Kflay and Kitessa, 2014; Tiwari et al., 2010). All
transects and plots located on the ground using compass and GPS navigation system.
2.3 Data collection
The detail vegetation data were collected during flowering and fruiting season from August,
26-30 December, 2018. Trees and shrubs: In each the main sample plots (400m2); individual plants
(stems) of all tree and shrub species with diameter at breast height (DBH) ≥2.5 cm abudndance
were counted and recorded their circumferance (diameter). Height of individual trees and shrubs
>2m were recorded for every woody individual plants having DBH >=2.5 cm (Gemedo et al.,
2006; Hasan et al., 2011; Tesfaye et al., 2017b). Diameter and height were measured using tape
meter and clinometer respectively. Trees with multiple stems arising from the ground level were
measured individually and developed a common DBH of all stems by summing up their square
roots following (Brundrett et al., 1996).
0 50 100 150 200 250 300 0 5 10 15 20 25 30 35 40
Jan Feb Mar Apr May June July Aug Sept Oct Nov Dec
Sapling and seedlings: To collect data on abundance of sapling and seedling of each woody plant
species, sub-plots of 5 m x 5 m (25m2) were set up within the main plot. Height of each samplings
and seedlings measured using tape meter.Saplings are young woody plants with DBH < 2.5 and
height >1m<2m where as seedlings as woody plants with DBH < 2.5 cm and height ≤ 1m (Chauhan
et al., 2008a; Abyot et al., 2014).
Plant species identification: wasstarted in the field by recording the local name through asking
to local elders and referring the scientific name identification using Flora of Ethiopia and Eritrea
Volume-1 toVolume-8 (Hedberg and Edwards, 1989; Edwards et al., 1995; Phillips, 1995;
Edwards et al., 1997; Hedberg et al., 2003; Mesfin Tadesse, 2004; Hedberg et al., 2006, 2009a,
2009b). Specimens of identified and unidentified species were collected, pressed and dried
properly, following standard Herbarium procedures, and taken to the National Herbarium (ETH)
at Addis Ababa University for further confirmation and for identification of specimens of those
species which could not be identified in the field.
2.4 Data analysis
a. Woody species structure
Diameter at breast height, height, basal area, tree density, frequency and important value index
describes woody vegetation structure of a given forest. The following formula were utilized in
Microsoft Excel spreadsheet programme and presented in descriptive statistics.
Diameter at breast height (DBH): diameter of woody species arbitrarily arranged in diameter
class intervals by referring (Mligo, 2015; Tesfay et al., 2019). Diameter of trees ̸ shrub plant
species of KSNP was classified into nine classes of 10cm interval (2.5-10,10.1-20, 20.1-30,
30.1-40, 40.1-50, 50.1-60, 60.1-70, 70.1-80 and >80.1cm).
Height: height of individuals’ trees ̸ shrub plant species were arbitrarily defined by height class
intervals (Tesfaye et al., 2013; Ermias et al., 2010). Height of KSNP was classified into seven
classes of 5m interval (<=4, 4.1-9, 9.1-14, 14.1-19, 19.1-24, 24.1-29 and >29.1).The densities of
individuals falling in the DBH or height classes were summed up.
Frequency of species: is defined as the probability or chance of finding a species in a given sample area (Kent and Coker, 1992).
Frequency (F) = ( 𝑁𝑢𝑚𝑏𝑒𝑟 𝑜𝑓 𝑝𝑙𝑜𝑡𝑠 𝑖𝑛 𝑤ℎ𝑖𝑐ℎ 𝑎 𝑠𝑝𝑒𝑐𝑖𝑒𝑠 𝑜𝑐𝑐𝑢𝑟𝑠
𝑡𝑜𝑡𝑎𝑙 𝑛𝑢𝑚𝑏𝑒𝑟 𝑜𝑓 𝑝𝑙𝑜𝑡𝑠 𝑙𝑎𝑖𝑑 𝑜𝑢𝑡 𝑖𝑛 𝑡ℎ𝑒 𝑠𝑡𝑢𝑑𝑦 𝑠𝑖𝑡𝑒)𝑥100 (1)
Relative frequency (RF) = (𝑓𝑟𝑒𝑞𝑢𝑒𝑛𝑐𝑦 𝑜𝑓 𝑎 𝑠𝑖𝑛𝑔𝑙𝑒 𝑠𝑝𝑒𝑐𝑖𝑒𝑠
Finally frequency was summarized by class interval following Lamprecht (1989). The frequency
of KSNP was arranged into seven classes of 15 % intervals (<=5, 5.1-20, 20.1-35, 35.1-50,
50.1-65, and 65.1-80 and >80.1%).
Density of species: is a count of the numbers of individuals of each species within the quadrat
(Kent and Coker, 1992). The sum of individuals per species is analyzed in terms of species density
ha-1 (Mueller-Dombois & Ellenberge, 1974; Martin, 1995).
Density (D) = 𝑛𝑢𝑚𝑏𝑒𝑟 𝑜𝑓𝑎𝑏𝑜𝑣𝑒𝑔𝑟𝑜𝑢𝑛𝑑 𝑠𝑡𝑒𝑚𝑠 𝑜𝑓 𝑎 𝑠𝑝𝑒𝑐𝑖𝑒𝑠
𝑁𝑢𝑚𝑏𝑒𝑟 𝑜𝑓 𝑞𝑢𝑎𝑑𝑟𝑎𝑡 ∗ 𝑞𝑢𝑎𝑑𝑟𝑎𝑡 𝑎𝑟𝑒𝑎 (3)
Relative density (RD) =𝐷𝑒𝑛𝑠𝑖𝑡𝑦 𝑜𝑓 𝑎 𝑠𝑖𝑛𝑔𝑙𝑒 𝑠𝑝𝑒𝑐𝑖𝑒𝑠
𝑇𝑜𝑡𝑎𝑙 𝑑𝑒𝑛𝑠𝑖𝑡𝑦 𝑜𝑓 𝑎𝑙𝑙 𝑠𝑝𝑒𝑐𝑖𝑒𝑠 (4) Density was arranged by class intervals following (Tesfay et al., 2019) dry forest study. KSNP
forest was classified in to five density class intervals: <=2, 2.1-10, 10.1-50, 50.1-100 and >100.1
stems ha-1.
Basal area: is the area outline of a plant near ground surface and expressed in m2 ha-1 (Kent and Coker, 1992; Martin, 1995).
Basal area (BA) =𝜋𝑑 2
4 Where, π = 3.14 and d =DBH (m) (5) Dominance: the degree of coverage of species as an expression of the space at ground level
(Mueller-Dombois and Ellenberge, 1974)
Dominance = the mean basal area per species * abundance (no) of the species (6)
Relative dominance (RDO) = (𝑑𝑜𝑚𝑖𝑛𝑎𝑛𝑐𝑒 𝑜𝑓 𝑎 𝑠𝑖𝑛𝑙𝑒 𝑠𝑝𝑒𝑐𝑖𝑒𝑠
𝑡𝑜𝑡𝑎𝑙 𝑑𝑜𝑚𝑖𝑛𝑎𝑛𝑐𝑒 𝑜𝑓 𝑎𝑙𝑙 𝑠𝑝𝑒𝑐𝑖𝑒𝑠)𝑥100 (7)
Importance Value Index (IVI): Indicating the relative ecological importance of a given woody species a particular site (Kent and Coker, 1992; Martin, 1995).
IVI= Relative density (RD) + Relative frequency (RF) + Relative dominance (RDO) (8)
b. Woody species regeneration
The regeneration status of KSNP woody species was computed by comparing seedling and sapling
with matured trees density data by applied (Khumbongmayum et al., 2006 ; Dhaulkhandi et al.,
2008; Chauhan et al., 2008a; Chauhan et al., 2008b; Tiwari et al., 2010) techniques.
If seedling > sapling > mature tree (“good”regenerating); mature tree > sapling > seedling (“fair”
regenerating); if a species survives only in the sapling stage (“poor” regenerating) (even saplings
<, >, or = to mature);if a species is absent both in sapling and seedling stages but present as mature
(“none”regenerating); if a species has no mature, but only sapling and/or seedling stages (“new”
3. Result
3.1 Floristic Composition
A total of 70 woody species belonging to 50 genera and 34 families were identified in
Kafta-sheraro national park (KSNP) forest. From these species, 46 (65.7%) trees, 18 (25.7%) shrub, 6
(8.6%) tree/shrub. Fabaceae was the most dominant family occupied 16 species (23.0%) followed
by Combretaceae 8 species (11.4%); Tiliaceae and Rhamnaceae 4 species (11.42%); Capparaceae
and Anacardiaceae 3 species each (8.58%); Burseraceae, Ebenaceae, Asclepiadaceae and
Apocynaceae 2 species each (11.44 % from total) and the rest 24 families represented one species
each (34.23% from total species) (Appendix 1). Out of 70 species 64 were used for next analysis
and six species were outside plots utilized for composition list only.
3.2 Density and frequency
The total density KSNP woody species was 466+12.8 stems ha-1. Acacia mellifera was the most
abundant species with abundance value of 446 individuals and a density of 69.7 stems ha-1. Acacia
mellifera, Combretum hartmannianum, Balanites aegyptiaca, Acacia oerfota, Boswellia
papyrifera and Acacia Senegal were above 150 individuals while Dicrostachy scinerea and
Combretum molle have densities 100 stems ha-1and above. The relative density ranged between
0.03 and 15%, the highest being forAcacia mellifera (Table 1). The woody species density was
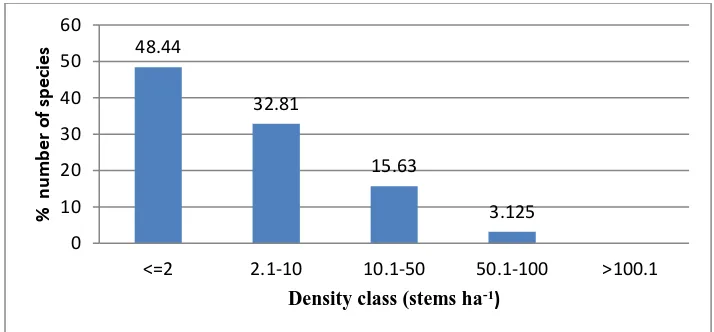
classified in to five class intervals: <=2, 2.1-10, 10.1-50, 50.1-100 and >100.1 stems ha-1. 48.4%
and 3.13% species occupied density class <=2 and 50.1-100 respectively (Figure 3).
Figure 3:Density of all woody plant species by size classin KSNP
48.44
32.81
15.63
3.125 0
10 20 30 40 50 60
<=2 2.1-10 10.1-50 50.1-100 >100.1
%
n
u
m
b
e
r
o
f sp
e
ci
e
s
The most frequent woody species in the study area were Acacia mellifera (71.4%), followed by
Combretum hartmannianum (59%), Terminalia brownii (57.8%), Balanites aegyptiaca(46.0%),
Acacia senegal (42.2%) and Acacia oerfota (35.4%),Boswellia papyrifera (29.8%),Dicrostachy
scinerea (29.2). While Acacia albida, Parkinsonia aculeate andOtostegia ellenbeckii each having
frequency (0.62%) was rarely observed. The relative frequency of species was between 0.09 and
10.6% with similar orders as their frequencies (Table 1). KSNP were arranged in six frequency
classes: (1=65.1-80, 2= 50.1-65, 3=35.1-50, 4=20.1-35%, 5=5.1-20, and 6= <5%). The woody
plant species dominantly concentrated in frequency class 6 (<5%). In 1(65.1-80%) frequency class
the number of species was one (Figure 4).
Figure 4: Woody plant species frequency classes’ distribution of KSNP (1=65.1-80, 2= 50.1-65, 3=35.1-50, 4=20.1-35%, 5=5.1-20, and 6= <5%).
3.3 Basal area (BA)
The total basal area of KSNP of woody species with DBH ≥ 2.5 cm was 79.3m2ha-1. Interms of
species Adansonia digitata contributed the highest basal area (35.5 m2ha-1) followed by Sterculia
Africana (7.86 m2ha-1), Tamarindus indica (5.52 m2ha-1), Anogeissus leiocarpus (4.09m2ha-1),
Ficus sycomorus (3.63m2ha-1), Acacia lahai (3.57 m2ha-1), Balanites aegyptiaca (2.90 m2ha
-1),Ziziphus spina-christi (2.87 m2ha-1) (Table 1).The lowest value was recorded in shrub species
of Senna sinqueana (0.002 m2ha-1), Buddleja polystachya (0.003m2ha-1) .
3.4 Importance value index (IVI)
The importance value index of woody species in KSNP ranged from 0.13 to 30.8.The highest IVI
was documented for Adansonia digitata (30.8). Balanites aegyptiaca, Acacia mellifera,
Terminalia brownii and Combretum hartmannianum, Anogeissus leiocarpus, Tamarindus indica,
0 10 20 30 40 50 60
1 2 3 4 5 6
1.56 3.13 4.69
7.81
25
57.81
%
nu
m
ber
o
f
species
Ziziphus spina-christi, Sterculia Africana, Acacia Senegal, Boswellia papyrifera and Acacia
oerfota had IVI value above ten were the most important species (Table 1).
Table 1: Woody species structure and importance value in Kafta-Sheraro National Park: (AD=Average diameter (cm), AB =Abundance (individual stems), D=Density (Abundance ha-1), RD= Relative density (%), F=Frequency (%), RF=Relative frequency (%), BA=Basal Area (m2ha
-1), DO=Dominance, RDO=Relative dominance (%), IVI=Importance value index (%))
Species AD AB D RD F RF BA DO RDO IVI
Acacia senegal 4.6 159 24.8 5.33 42.2 6.26 0.05 0.301 0.222 11.8
Combretum hartmannianum 9.4 342 53.4 11.5 59 8.74 0.19 2.584 1.911 22.1
Dalbergia melanoxylon 8.4 46 7.19 1.54 17.4 2.58 0.14 0.262 0.194 4.31
Balanites aegyptiaca 38 188 29.4 6.3 46 6.81 2.9 19.59 14.49 27.6
Acacia oerfota 4.1 169 26.4 5.67 35.4 5.24 0.03 0.222 0.164 11.1
Dicrostachy scinerea 3.9 143 22.3 4.79 29.2 4.32 0.03 0.17 0.126 9.24
Grewia bicolor 2.5 31 4.84 1.04 9.94 1.47 0.01 0.016 0.012 2.52
Anogeissus leiocarpus 45 71 11.1 2.38 24.8 3.68 4.09 11.62 8.591 14.7
Sterculia africana 62 42 6.56 1.41 14.9 2.21 7.86 13.2 9.763 13.4
Acacia seyal 5.5 34 5.31 1.14 9.94 1.47 0.06 0.08 0.059 2.67
Maytenus senegallensis 5.6 6 0.94 0.2 2.48 0.37 0.06 0.015 0.011 0.58
Acacia mellifera 4.2 446 69.7 15 71.4 10.6 0.03 0.623 0.46 26
Adansonia digitata 134 27 4.22 0.91 10.6 1.56 35.5 38.31 28.33 30.8
Acacia albida 17 2 0.31 0.07 0.62 0.09 0.56 0.045 0.033 0.19
Jasminum abyssinicum 5.2 8 1.25 0.27 2.48 0.37 0.05 0.017 0.012 0.65
Ziziphus spina-christi 38 87 13.6 2.92 23 3.4 2.87 9.989 7.387 13.7
Tamarindus indica 52 59 9.22 1.98 19.9 2.94 5.52 13.03 9.634 14.6
Casuarina equisetifolia 5.2 69 10.8 2.31 15.5 2.3 0.05 0.149 0.11 4.72
Capparis decidua 4.6 4 0.63 0.13 1.24 0.18 0.04 0.007 0.005 0.32
Grewia villosa 3.6 11 1.72 0.37 4.97 0.74 0.02 0.011 0.008 1.11
Salvadora persica 2.8 5 0.78 0.17 1.86 0.28 0.01 0.003 0.002 0.45
Ζiziphus mauritiana 9.8 4 0.63 0.13 1.24 0.18 0.19 0.03 0.022 0.34
Feretia apodanthera 7.5 3 0.47 0.1 2.48 0.37 0.11 0.013 0.01 0.48
Hyphaene thebaica 17 96 15 3.22 21.1 3.13 0.61 2.352 1.74 8.09
Calotropis procera 6.9 14 2.19 0.47 5.59 0.83 0.11 0.064 0.047 1.34
Boswellia papyrifera 11 178 27.8 5.97 29.8 4.42 0.25 1.794 1.327 11.7
Terminalia brownii 36 205 32 6.87 57.8 8.56 2.06 13.28 9.82 25.2
Grewia flavescens 5.5 13 2.03 0.44 6.21 0.92 0.06 0.033 0.025 1.38
Moringa stenopetala 5.8 4 0.63 0.13 1.24 0.18 0.11 0.018 0.013 0.33
Acacia lahai 42 6 0.94 0.2 2.48 0.37 3.57 0.857 0.634 1.2
Diospyros mespiliformis 13 30 4.69 1.01 9.32 1.38 0.35 0.42 0.311 2.7
Burkea africana 37 21 3.28 0.7 7.45 1.1 2.67 2.243 1.659 3.47
Ficus sycomorus 43 2 0.31 0.07 1.24 0.18 3.63 0.291 0.215 0.47
Combretum glutinosum 8 27 4.22 0.91 5.59 0.83 0.13 0.136 0.1 1.83
Combretum molle 6 117 18.3 3.92 11.2 1.66 0.07 0.335 0.247 5.83
Nerium oleander 2.5 3 0.47 0.1 1.24 0.18 0.01 0.002 0.001 0.29
Cadaba farinosa 5.4 6 0.94 0.2 1.24 0.18 0.06 0.014 0.01 0.4
Leptadenia lanceolata 4.6 3 0.47 0.1 1.86 0.28 0.03 0.004 0.003 0.38
Terminalia laxiflora 8.7 10 1.56 0.34 1.24 0.18 1.05 0.419 0.31 0.83
Species AD AB D RD F RF BA DO RDO IVI
Grewia mollis 4.8 4 0.63 0.13 1.86 0.28 0.04 0.007 0.005 0.42
Lannea microcarpa 11 23 3.59 0.77 8.7 1.29 0.25 0.232 0.172 2.23
Commiphora boranensis 7.2 32 5 1.07 4.35 0.64 0.72 0.922 0.682 2.4
Stereospermum kunthianum 6.9 21 3.28 0.7 6.21 0.92 0.1 0.08 0.059 1.68
Pittosporum viridiflorum 9 17 2.66 0.57 3.73 0.55 0.42 0.047 0.034 1.16
Boscia angustifolia 6.4 7 1.09 0.23 1.86 0.28 0.08 0.022 0.016 0.53
Acacia sp. 11 11 1.72 0.37 2.48 0.37 0.25 0.109 0.08 0.82
Ziziphus mucronata 2.9 17 2.66 0.57 6.21 0.92 0.02 0.011 0.008 1.5
Acacia polyacantha 5.9 46 7.19 1.54 4.35 0.64 0.07 0.126 0.093 2.28
Acacia etbaica 11 5 0.78 0.17 1.24 0.18 0.22 0.045 0.033 0.38
Acacia tortilis 12 8 1.25 0.27 1.86 0.28 0.27 0.088 0.065 0.61
Parkinsonia aculeata 8.4 1 0.16 0.03 0.62 0.09 0.14 0.006 0.004 0.13
Ricinus communis 4.1 4 0.63 0.13 0.62 0.09 0.03 0.005 0.004 0.23
Melia azedarach 4.6 3 0.47 0.1 1.24 0.18 0.04 0.005 0.004 0.29
Carissa edulis 5.4 11 1.72 0.37 1.86 0.28 0.07 0.033 0.024 0.67
Combretum sp. 8.9 27 4.22 0.91 2.48 0.37 0.16 0.174 0.129 1.4
Sclerocarya birrea 19 15 2.34 0.5 3.11 0.46 0.7 0.419 0.31 1.27
Terminalia sp. 7.6 7 1.09 0.23 1.24 0.18 0.11 0.032 0.024 0.44
Diospyros abyssinica 8 14 2.19 0.47 2.48 0.37 0.30 0.226 0.167 1
Brucea antidysentrica 15 3 0.47 0.1 1.24 0.18 0.12 0.053 0.039 0.32
Plumbago zeylanica 2.5 5 0.78 0.17 1.86 0.28 0.01 0.002 0.002 0.45
Otostegia ellenbeckii 2.5 2 0.31 0.07 0.62 0.09 0.004 0.008 0.006 0.16
Senna sinqueana 2.5 1 0.16 0.03 0.62 0.09 0.002 0.007 0.005 0.13
Buddleja polystachya 2.6 2 0.31 0.07 1.24 0.18 0.003 0.011 0.008 0.26
Total - 2984 466 100 - 100 79.3 - 100 300
3.5 Population structure of KSNP forest and selected tree species
The general DBH and height class distribution of woody species density in the KSNP showed an
Inverted-J shaped structure. The distribution of trees and shrubs was categorized into nine DBH
class: (2.5-10cm; 10.1-20cm; 20.1-30cm; 30.1-40cm; 40.1-50cm, 50.1-60cm; 60.1-70cm;
70.1-80cm and >80.1cm). The majority of individuals are distributed in the first DBH class 2.5-10cm
(Figure 5a). Three species of twenty individuals of Anogeissus leiocarpus, Sterculia Africana,
Adansonia digitata had a DBH of 70 cm and above.
In KSNP the highest DBH was recorded for fourteen individuals of Adansonia digitata
(110-146cm). While Tree height distribution was classified in seven classes: <=4m; 4.1-9m; 9.1-14m;
14.1-19m; 19.1-24m; 24.1-29m and >29.1m.There is higher number of trees/shrubs individuals
in the height class below 14m which accounts 81% of the total population height classes.
mespiliformis and Balanites aegyptiaca had 39 individuals having above 15m height. The highest
height was recorded for Anogeissus leiocarpus (30m) (Figure 5b).
Figure 5: Woody species diameter (a) and height (b) classes of Kafta-sheraro National Park
The analysis of population structure of Kafta-sheraro national park individual tree species in nine
DBH classes dominantly showed eight patterns of population structure. First pattern consists of
individual species concentrated only in the first DBH class (2.5-10cm) but absent in the rest classes
and represented by Acacia mellifera (F.g.6a). Species in this group are Acacia senegal,Dalbergia
melanoxylon, Acacia oerfota, Dicrostachy scinerea and Acacia seyal. Second pattern occupied
both first (2.5-10cm) and second (10.1-20cm) DBH classes and represented by Combretum
hartmannianum and Boswellia papyrifera (F.g.6b). Third pattern was an Inverted-J shaped in
which the highest number of individuals was present in lower DBH classes and species Anogeissus
leiocarpus only (F.g.6c). Fourth pattern was J-shaped in which a higher proportion of individuals
were present at higher DBH classes and the trend decreased towards lower DBH classes. Species
of this pattern was Ziziphus spina-christi and Tamarindus indica (F.g.6d).Fifth pattern was bell
shaped in which a higher proportion of species were present in intermediate DBH classes and the
trend decreased in lower and higher DBH classes. Species in this category were Balanites
aegyptiaca and Terminalia brownii (F.g.6e). Sixth pattern occurred in the second DBH class
(10.1-20cm) and the only representative species is Diospyros mespiliformis (F.g.6f). Seventh
pattern shows irregular distribution over diameter classes. Some DBH classes had small number
of individuals while other DBH classes had large number of individuals and even some were
in the large class. Adansonia digitata was the only representative species that occur in the ninth
(>80.1cm) DBH class (F.g.6h).
3.6 Regeneration status of KSNP woody species
A total of 378 individuals of seedling 68 (2.023%) and saplings 310 (9.22%) belonging to 64
woody species were counted from all quadrats. Twelve woody species had sapling and seedling,
five species had only sapling while 47 species lack both stages. Woody species having seedling
were Acacia senegal, Combretum hartmannianum, Balanites aegyptiaca, Acacia oerfota,
Dicrostachy scinerea, Acacia mellifera,Ziziphus spina-christi,Casuarina equisetifolia, Hyphaene
thebaica,Boswellia papyrifera, Terminalia brownii and Acacia polyacantha (Appendix 1). The
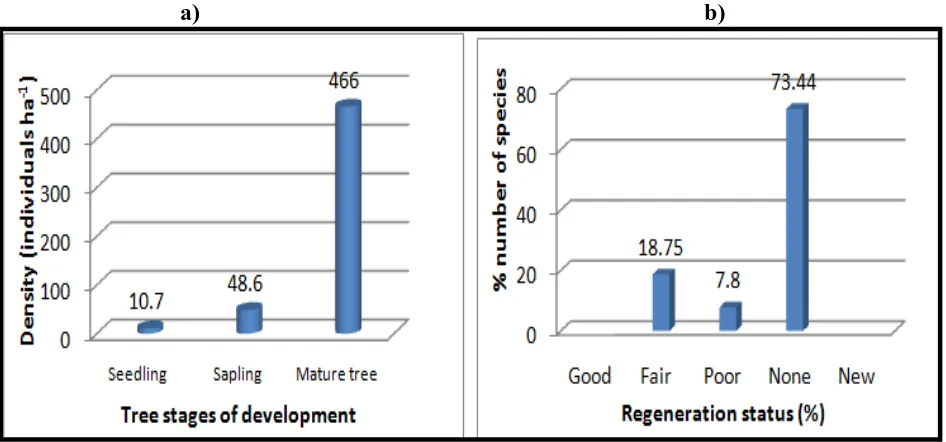
total density of seedling and sapling had 10.7 and 48.6 individuals’ ha-1 respectively (Figure 7a).
Relatively higher sapling density was exhibited by species like Hyphaene thebaica (16.1%)
followedBalanites aegyptiaca (15.8%), Dicrostachy scinerea (13.17%),Casuarina equisetifolia
(8.64%),and Acacia Senegal (7.82%) (Appendix 1).
In Kafta-sheraro national park forest 18.75% of tree ̸ shrub species showed ‘fair regenerating’
while 7.8 % and 73.45% showed ‘poor regenerating’ and ‘none regenerating’ condition
respectively. But “good” and “new” regenerating status of the tree species was absent (Figure 7b).
Dalbergia melanoxylon, Acacia seyal,Grewia villosa,Combretum molle and Plumbago zeylanica
had ‘poor’ regenerating woody species.
a) b)
Figure 7: Density of seedling, sapling & mature tree species (a) and regeneration status of
4. Discussion
4.1 Woody species structure
Density: Species-abundance measures are ways of expressing not only the relative richness but
also evenness and assessing diversity (Barnes et al., 1998).The total density of woody species of
the study was 466+12.8 individuals ha-1 (64 species) which is lower than Babile elephant
sanctuary:1319 individuals’ ha-1 (67 species) (Anteneh et al., 2011); Nechisar Park: 887 stems ha -1 (118 species) (Samson et al., 2010); Yemrehane Kirstos Church forest (506.6 stems ha-1,
Amanuel and Gemedo, 2018); Zege Peninsula (3318 stems ha-1,(113 species) Alemnew et al.,
2007); (1845 stems ha-1, Abyot et al. 2014); Tara Gedam and Abebaye (3001 stems ha-1 and 2850
stems ha-1 (143 species) Haileab et al., 2011); Kahtasa forest (505 stems ha−1,Getaneh et al., 2019)
; Wof-Washa forest (698.8 stems ha−1) (Gebremicaelet al., 2013) in Ethiopia and in other tropical
forests (515 stems ha−1) (Chauhan et al., 2008a).The densities of tree species variation in forests
was reported due to variation in species composition, age structure (Ademoh et al., 2017) and the
degree of disturbance (Sharma and Chaudhry, 2018).
Acacia mellifera,Combretum hartmannianum, Terminalia brownii, Combretum molle,Balanites
aegyptiaca,Acacia oerfota,Boswellia papyrifera,Acacia Senegal,Dicrostachy scinerea occupied
above 50% of the total stem density and relatively those species had higher seedling and sapling
density in the study area. These species are probably due to their resistance to drought and
disturbance (Abiyot et al., 2017). The absence of seedlings in some of the canopy trees of Sterculia
africana and Adansonia digitata highly attributed to disturbance, seed predation, and habitat
unsuitability. Disturbance and seed predation have been played sound role in reducing the seedling
population of woody species (Alemayehu et al., 2009).
Frequency: contributes to indicate homogeneity and heterogeneity of vegetation of a given species
(Haileab et al., 2005). The study site has high species heterogeneity; because of higher percentage
numbers of species were found in the lower frequency class than higher class.
According to lamprecht(1989) low value in lower frequency and high value in higher frequency
class indicate similar species composition. To the reverse low percentage number of species in the
higher frequency and low percentage number of species in the higher frequency classes reported a
high degree of floristic heterogeneity (Simon and Girma, 2004; Abyot et al., 2014; Amanuel and
habitat differences, habitat preferences among the species, species characteristics for adaptation,
degree of exploitation and conditions for regeneration (Haileab et al., 2011). In KSNP important
portions of the species were rare. Therefore, the study site has existence of high floristic
heterogeneity.
Basal area: The basal area of all Kafta-sheraro national park woody vegetation (79.3m2ha-1) is
much higher than dry land areas of Ethiopia forests and other countries. NNP (49.45m2ha-1,
Samson et al., 2010); Babile elephant sanctuary (17.8 m2 ha-1; Anteneh et al., 2011);(19.3m2ha-1,
Abyot et al., 2014); Grat-Kahsu (8.25 m2 ha-1 ,Tesfay et al., 2019); Abebaye forest (49.45m2ha-1,
Haileab et al., 2011) (72 m2 ha−1, Amanuel and Gemedo, 2018); virgin tropical forests in Africa
(23-37 m2 ha-1, Lamprecht, 1989); Katerniaghat Wildlife Sanctuary (35.9 m2ha-1 ,Tripathi &
Singh., 2009); Gibbon Wildlife Sanctuary (9.62 m2ha-1: Sarkar and Devi, 2014); Chilimo Forest
(30 m2ha-1 ,Tamrat, 1993), Adelle Forest :26 m2ha-1 and Boditi Forest:23 m2ha-1) (Haile et al.,
2008); Jibat (59.79m2ha-1,Tesfaye et al., 2013); Komto forest (Fekadu et al., 2012); Bhadra
Wildlife Sanctuary(18.09 m2 ha-1, Krishnamurthy et al., 2010); Metema (42.54, m2 ha-1 ,Haile et
al., 2012a). But it was less than moist forests; Wof-Washa Forest (102 m2ha-1,Tamrat, 1993);
Berbere forest (87.49 m2ha-1,Tesfaye et al., 2017b); Belete forest (103.5 m2ha-1, Kflay & Kitessa,
2014); Tara Gedam ( 115.36 m2 ha-1, Haileab et al., 2011) and Kimphe lafa forest (114.4 m2 ha-1
,Kedir et al., 2015).
The highest basal area from individual tree species in the study was contributed by Adansonia
digitata (35.5 m2 ha-1) while the highest density was Acacia mellifera species (69.7 individuals ha
-1). This indicates that species with the highest basal area do not necessarily have the highest density
and the vi-versa is also true. This was indicated that size difference between species is common in
natural vegetation (Tamrat, 1994; Simon and Girma, 2004).
Importance Value Index: is useful to compare the ecological significance of species (Lamprecht,
1989; Premavani et al., 2014). Important value index is the degree of dominancy and abundance
of a given species in relation to the other species in the area (Kent & Coker, 1992). The importance
value index (IVI) of woody species in the study area was generally comparable to other areas of
woody vegetation (Haileab et al., 2011; Desalegn et al., 2013; Abiyot et al., 2017). For example,
in Jibat forest Ilex mitis species had the highest value (27.7%) (Tesfaye et al., 2013);34.6% (Kflay
list. Some of the least IVI record was Maytenus senegallensis, Acacia albida, Jasminum
abyssinicum, Salvadora persica, Ζiziphus mauritiana, Feretia apodanthera. Moreover, least
important species are usually found in open woodlands and savanna (Hedberg & Hedberg, 2003).
The IVI values can also be used to prioritize species for conservation, and species with high IVI
value need less conservation efforts, whereas, those having low IVI value need high conservation
effort. Lower IVI may indicate woody species are threatened and need immediate conservation
measure (Anteneh et al., 2011;Temesgen et al., 2015). Low IVI value and poor regeneration status
of species in a forest need to be prioritized for conservation (Haileab et al., 2011).
Population structure: DBH and height are important indicators of forest reproduction and health
status (Schulz et al., 2009). The general pattern DBH of KSNP showed an inverted J-shaped
distribution where species frequently had the highest frequency in low diameter classes and a
gradual decrease towards the higher class. Inverted J shape pattern is normal population structure
and shows the existence of species in healthier condition.Similar results were reported by (Abate
et al. 2006;Haile et al., 2008; Ermias et al., 2008; Leul et al., 2010; Samson et al., 2010; Tesfaye
et al., 2013; Kflay and Kitessa, 2014; Mligo., 2015; Tesfaye et al., 2017b; and Tesfay et al., 2019).
However, the general pattern does not clearly show trends of population dynamics and recruitment
processes of a single species (Abyot et al., 2014; Getaneh et al., 2019). Other seven discontinuous
(there were complete absences of individuals in some class and fairly representative of the
individual in other class) patterns showed in KSNP. Irregular distribution pattern were reported by
(Mekuria et al., 1999, Getachew et al., 2002, Haile et al., 2008, Ensermu & Teshome, 2008; Haile
et al., 2012a; Melkamu and Abdella, 2019).Moreover,assessing the population structure has been
helped to provide initial idea about the status of regeneration pattern of woody plants (Swamy et
al., 2000).
4.2 Regeneration status of woody plants
Reports stated that the regeneration status of the given natural vegetation is considered as none
regenerating if a species is absent both in sapling and seedling stages but present as mature
(Khumbongmayum et al., 2006; Dhaulkhandi et al., 2008; Tiwari et al., 2010). Therefore, the
regeneration status of Kafta-sheraro national park was considered as none regenerating since
mature (88.76%) > sapling (9.22%) > seedling (2.02%). The regeneration and recruitment
condition of woody species is one of the major factors that are useful to assess their conservation
population of seedlings, saplings and adults, indicates successful regeneration of forest species
(Saxena and Singh, 1984). However, climatic factors and biotic interference influence the
regeneration of species in any vegetation (Henleet al., 2004; Dhaulkhandi et al., 2008). The tree
species, which had no seedlings and saplings exhibited discontinuous population structures
(Getaneh et al., 2019).
The “poor” and “none” regenerating categories which constitute around 81.25% of the woody
plant in KSNP have many important and useful tree species. For example trees ̸ shrub species
namely: Sterculia africana, Acacia seyal, Adansonia digitata, Hyphaene thebaica, Burkea
Africana and Grewia flavescens are source of feed for African elephant some plants in the study
like Boswellia papyrifera, have economic value. Poor and none regenerating category of woody
species was reported in Berbere forest (32.26%, Tesfaye et al., 2017b); Grat-Kahsu (26.56%,
Tesfay et al., 2019); Gibbon Wildlife Sanctuary(25%, Sarkar & Devi, 2014);Wof-Washa (48%,
Gebremicael et al., 2013).
The regeneration status of the tree species of KSNP dominantly falls in “poor” and “not regenerating” status. Such situation might have been occurred through the existing disturbance
like, over grazing (Emiru et al., 2007; Kuijper et al., 2010; Norden et al., 2011), firewood
collection, fire, mining and poor biotic potential of tree species which either affect the fruiting or
seed germination or successful conversion of seedling to sapling stage and similarly reported in
Ethiopia (Haileab et al., 2011; Gebremicael et al., 2013;Tesfaye et al., 2017b; Getaneh et al.,
2019;Melkamu and Abdella, 2019) and in other tropical dry forests (Ceccon et al., 2006; Anitha
et al., 2010). Moreover, individuals in young stages of any species are more vulnerable to any kind
of environmental stress and anthropogenic disturbance (Nagamatsu et al., 2002; Getachew et al.,
2002). Poor regenerating leads poor reproduction and hampered regeneration either due to the fact
that most trees are not producing seeds as a result of their old age or there has been loss of seeds
by predators after reproduction (Bhuyan et al., 2003; Khumbongmayum et al., 2006;Mwavu and
Witkowski, 2009). Absence of seedlings and saplings of tree species indicates urgent need for
targeted forest management plan to enhance regeneration (Abyot et al., 2014; Getaneh et al.,
2019). High herbaceous cover played a major role in preventing successful seed germination,
seedling establishment, growth and survival (Kobe and Vriesendorp, 2011).
Surveying on structure, and regeneration status of tree species would be provided baseline
information and an instrument for the development of successful conservation strategies in KSNP
forest. Population structure of most common species of trees and shrubs revealed different patterns
of population structure, addressing a high variation among species population dynamics within the
forest and an indication for low regeneration.Theadditional patterns were indicated the absence
of populations in various DBH classes. This clearly shows tree species in different stage of
development are abnormal population structure status. The regeneration status of the tree species
of the study site dominantly showed “poor” and “none” regeneration status but 18% trees/shrubs
species, falls under “fair” regenerating” status. Variation in population structure and regeneration
status indicates that long time past disturbance of species and the whole resources of the park. The
IVI values reveal the most ecologically important woody species in the forests are in poor
regeneration status due to human disturbance, particularly livestock grazing, fire and cultivation.
Therefore, the regeneration status of the woody plant species in the park generally categorized
under poor and none regenerating condition; research development is needed on soil seed bank
and propagation method of each tree species to stimulate regeneration specifically on species of
Sterculia Africana,Adansonia digitata,Tamarindus indica, Acacia seyal and Burkea Africana.
The park as the habitat for different types of wildlife particularly for the population of African
elephant; government and community must give conservation and management priority for species
with IVI less than 1%, species with no seedling, and families represented by only one species.
Design conservation strategies for those economically important tree species like Boswellia
papyrifera which are needed for their effective productivity and this contributes to the conservation
and development of other related tree species in the park.
Acknowledgement
We would like to thank the Ethiopian wildlife conservation authority (Enhanced Management
and Effectiveness of Ethiopia’s Protected Area Estate Project) which has supported financially
starting from vegetation data collection to paper accomplishment. We are also deeply gratitude to
Kafta-sheraro national park SCOUTS for their unlimited assistance during four months field work.
Without their devoted assistance, the field data collection in such remote and harsh environment
would have been impossible.
Abate Ayalew, Tamerat Bekele and Sebsebe Demissew, (2006). The Undifferentiated Afromontane forest of Denkoro in the central highland of Ethiopia: A floristic and Structural Analysis. Ethiopian Journal of Science, 29(1):45-56.
Abiyot Berhanu, Sebsebe Demissew, Zerihun Woldu and Motuma Didita, (2017). Woody species composition and structure of Kuandisha Afromontane forest fragment in northwestern, Ethiopia.
Journal of Forestry Research, 28:343-355.
Abiyou Tilahun, Teshome Soromessa, Ensermu Kelbessa and Abyot Dibaba, (2011). Floristic Composition and Community Analysis of Menagesha Amba Mariam Forest (Egdu Forest) in Central Shewa, Ethiopia. Ethiopian Journal of Biological Science, 10:111-136.
Abyot Dibaba, Teshome Soromessa, Ensermu Kelbessa and Abiyou Tilahun, 2014. Diversity, Structure and Regeneration Status of the Woodland and Riverine Vegetation of Sire Beggo in Gololcha District, Eastern Ethiopia. Momona Ethiopian Journal of Science (MEJS), 6(1):70-96.
Ademoh, F. O., J. I. Muoghalu, and B. Onwumere. 2017. “Temporal Pattern of Tree Community Dynamics in a Secondary Forest in Southwestern Nigeria, 29 Years after a Ground Fire.” Global Ecology and Conservation, 9:148-170.
Alemayehu Wassie, Sterck, F.J., Demel Teketay and Bongers, F. (2009). Effects of livestock exclusion on tree regeneration in Church forests of Ethiopia. Forest Ecology and Management, 257:765-772. Alemnew alelign, Demel teketay, Yonas yemshaw & Sue edwards, 2007. Diversity and status of
regeneration of woody plants on the peninsula of Zegie, northwestern Ethiopia. Tropical Ecology,
48(1):37-49.
Amanuel Ayanaw and Gemedo Dalle,(2018). Woody Species Diversity, Structure, and Regeneration Status of Yemrehane Kirstos Church Forest of Lasta Woreda,North Wollo Zone, Amhara Region, Ethiopia. International Journal of Forestry Research, 5302523, 8p.
Anitha, K., Joseph, S. Chandran, R. J. Ramasamy, E. and Prasad, S. N. 2010. “Tree Species Diversity and Community Composition in a Human-dominated Tropical Forest of Western Ghats Biodiversity Hotspot, India.” Ecological Complexity, 7:217-224.
Anteneh Belayneh, Tamrat Bekele, Sebsebe Demissew, 2011. The natural vegetation of Babile elephant sanctuary, eastern Ethiopia: implications for biodiversityconservation. Ethiop. J. Biol. Sci. 10 (2), 137e152.
Barnes, B.V., Zak, D.R., Denton, S.R, and Spurr, S.H. 1998. Forest Ecology, 4th edition. New York: John
Wiley and Sons.
Bekele Taye, Getachew Berhan, Elias Taye Matheos, Ersado, Kumlachew, Yeshitela, 2002. Regeneration status of moist montane forests of Yayu Ethiopia: conservation, part I: Boginda, Bonga, Masha - Anderacha and forests. Walya, 22:45e60.
Bhuyan P., Khan M.L & Tripathi R.S. 2003. Tree diversity and population structure in undisturbed and human-impacted stands of tropical wet evergreen forest in Arunachal Pradesh, Eastern Himalayas India. Biodiversity Conservation, 12 (8):1753-1773.
Brundrett, M., Bougher, N., Dell, B., Grove T. and Malajczuk, N. (1996). Working with Mycorrhizas in forestry and agriculture. AClAR Monograph 32, 374 + x p.
Cain, P.D. 1959. Manual of Vegetation Analysis. Harper and Row, New York, 325p. Cain, S.A. (1938). The species-area curve. American Midland Naturalist, 19:573-581.
Ceccon, E., Huante, P. and Rincón, E. 2006. Abiotic Factors Influencing Tropical Dry Forests Regeneration. An International journal Brazilian Archives of Biology and Technology, 49 (2):305-312.
Chauhan, D., C. Dhanai, B. Singh, S. Chauhan, N. Todaria, and M. Khalid. 2008a. “Regeneration and Tree Diversity in Natural and Planted Forests in a Terai-Bhabhar Forest in Katarniaghat Wildlife Sanctuary, India.” Tropical Ecology, 49:53-67.
Desalegn Tadele, Ermias Lulekal, Destaw Damtie and Adane Assefa, (2013). Floristic diversity and regeneration status of woody plants in Zengena forest, a remnant montane forest patch in northwestern Ethiopia. Journal of Forestry Research, 25 (2):329-336.
Dhaulkhandi, M., Dobhal, A., Bhatt, S. and Kumar, M. (2008). “Community structure and regeneration potential of natural forest site in Gangotri, India.”Journal of Basic & Applied Sciences, 4:49-52. Duchok, R. K., Kent, A. D. and Khumbongmayum, A. (2005). Population Structure and Regeneration
Status of Medicinal Tree Illicium griffithii in Relation to Disturbance Gradients in Temperate Broad-Leaved Forest of Arunachal Pradesh. Current Science, 89: 673-676.
Edwards, S., Sebsebe Demissew and Hedberg, I. (1997). Flora of Ethiopia and Eritrea (vol. 6): Hydrocharitaceae to Arecaceae. Addis Ababa and Uppsala: The National Herbarium. 586p. Edwards, S., Sebsebe Demissew, Mesfin Tadesse and Hedberg, I. (1995). Flora of Ethiopia and Eritrea
(vol.2:1):Magnoliaceae to Flacourtiaceae. Addis Ababa and Uppsala: The National Herbarium. 532p.
Emiru Birhane, Demel Teketay and Pia Barklund, 2007. Enclosures to Enhance Woody Species Diversity in the Dry Lands of Eastern Tigray, Ethiopia. East African Journal of Sciences, 1(2):136-147.
Ensermu Kelbessa and Sebsebe Demissew (2014). Diversity of vascular plant taxa of the Flora of Ethiopia and Eritrea. Ethiop. J. Biol. Sci.13 (Supp.):37-45.
Ensermu Kelbessa and Teshome Soromessa (2008). Interfaces of regeneration, structure, diversity and uses of some plant species in Bonga forest: a reservoir for wild coffee gene pool. SINET: Ethiop. J. Sci.
31(2):121-134.
Ensermu Kelbessa, Sebsebe Demissew, Zerihun Woldu and Edwards, S. (1992). Some threatened endemic plants of Ethiopia. In: Botany 2000: East and Central Africa (Edwards, S. and Zemede Asfaw, eds). NAPERICA Monograph Series No. 2. Pp. 3555.
Ermias Lulekal, Ensermu Kelbessa, Tamrat Bekele, and Haile Yineger, (2008). Plant Species Composition and Structure of the Mana Angetu Moist Montane Forest, South-Eastern Ethiopia. Journal of East
African Natural History, 97(2):165-185.
Fekadu Gurmessa, Teshome Soromessa, and Ensermu Kelbessa, (2012). Structure and Regeneration status of Komto Afromontane Moist Forest, East Wellega Zone, West Ethiopia. Journal of Forestry Research, 23:205-216.
Gebremicael Fisaha, Kitessa. Hundera, and Gemedo Dalle. 2013. “Woody Plants’Diversity, Structural Analysis and Regeneration Status of Wof-Washa Natural Forest, North-east, Ethiopia.”African
Journal of Ecology, 51:599-608.
Gemedo, D.T., Maass, B.L. and Isselstein, J. (2006) Encroachment of woody plants and its impact on pastoral livestock production in the Borana Lowlands, Ethiopa. Afr. J. Ecol.44:237-246.
Getachew Tesfaye, Demel Teketay and Masresha Fetene (2002). Regeneration of fourteen tree species in Harenna forest, southeastern Ethiopia. Flora, 197:461-474.
Getachew Tesfaye, Demel Teketay and Masresha Fetene and Beck, E. 2010.“Regeneration of Seven Indigenous Tree Species in a Dry Afromontane Forest, Southern Ethiopia.” Flora-Morphology,
Distribution, Functional Ecology of Plants, 205:135-143.
Getachew Mulualem and Weldemariam Tesfahunegny, 2016. Review of Key Wildlife Threats Factors from Literature and Observation Perspectives: A Way forward for Sustainable Wildlife Genetic Resource Conservation Practices in Ethiopia. Journal of Zoology Studies, 3(5):01-12.
Getaneh Gebeyehu, Teshome Soromessa, Tesfaye Bekele & Demel Teketay (2019): Species composition, stand structure, and regeneration status of tree species in dry Afromontane forests of Awi Zone, northwestern Ethiopia, Ecosystem Health and Sustainability,17p.
Haile Adamu Wale, Tamrat Bekele, Gemedo Dalle (2012a). Floristic diversity, regeneration status and vegetation structure of woodlands in Metema area, Amhara National Regional State, North-western Ethiopia. Journal of Forestry Research, 23(3): 391-398.
Haileab Zegeye, Demel Teketay and Ensermu Kelbessa (2011). Diversity and regeneration status of woody species in Tara Gedam and Abebaye forests, northwestern Ethiopia. Journal of Forestry Research,
22(3):315-328.
Haileab, Zegeye, Demel, Teketay, Kelbessa, Ensermu, 2005. Diversity, regeneration status and socio-economic importance of the vegetation in the islands of Lake Ziway, South-central Ethiopia. Flora, 201,483e498.
Hasan Yusuf, Treydte, A. C., Sebsebe Demissew & Zerihun Woldu, 2011. Assessment of woody species encroachment in the grasslands of Nechisar National Park, Ethiopia. Afr. J. Ecol., 49:397-409. Hedberg, I. and Edwards, S. (1989). Flora of Ethiopia (Vol.3): Pittosporaceae to Araliaceae. Addis Ababa
and Uppsala: The National Herbarium.732p.
Hedberg, I. and Hedberg, O. (2003). Apiaceae. In: Inga Hedberg, Sue Edwards and Sileshi Nemomissa, (eds). Flora of Ethiopia and Eritrea (vol.4.1): Apiaceae to Dipsacaceae. Addis Ababa and Uppsala:The National Herbarium.1-45p.
Hedberg, I., Ensermu Kelbessa, Edwards, S., Sebsebe Demissew, Persson, E. (2006). Flora of Ethiopia and Eritrea (vol.5):Gentianaceae to Cyclocheilaceae. Addis Ababa and Uppsala: The National Herbarium. 690p.
Hedberg, I., Friis I. and Persson, E. (2009a). Flora of Ethiopia and Eritrea (vol.1): Lycopodiaceae to Pinaceae. Addis Ababa and Uppsala, The National Herbarium. Pp. 305.
Hedberg, I., Friis I. and Persson, E. (2009b). Flora of Ethiopia and Eritrea. General Part and Index to Volumes 1-7(vol.8). Addis Ababa and Uppsala: The National Herbarium.331p.
Henle, K., Davies, K. F., Kleyer, M., Margules, C., & Settele, J. (2004). Predictors of Spe-cies Sensitivity to Fragmentation. Biodiversity and Conservation,13:207-251.
Kedir Aliyi, Kitessa Hundera, and Gemedo Dalle, (2015). Floristic Composition, Vegetation Structure and Regeneration Status of Kimphe Lafa Natural Forest, Oromia Regional State, West Arsi, Ethiopia. Research & Reviews: Journal of Life Sciences, 5(1):19-32.
Kent, M. and Coker, P. (1992). Vegetation description and analysis. A practical approach. Wiley, New York. 363p.
Kflay Gebrehiwot, and Kitessa Hundera, (2014). Species composition, Plant Community structure and Natural regeneration status of Belete Moist Evergreen Montane Forest, Oromia Regional state, Southwestern Ethiopia. Momona Ethiopian Journal of Science, 6(1):97-101.
Khumbongmayum, M.L., Khan, M.L & Tripathi, R.S. 2006. Biodiversity conservation in sacred groves of Manipur, north-east India: Population structure and regeneration status of woody species.
Biodiversity and Conservation, 15:2439-2456.
Kobe, R. K., and C. F. Vriesendorp. 2011. “Conspecific Density Dependence in Seedlings Varies with Species Shade Tolerance in a Wet Tropical Forest.” Ecology Letters,14:503-510.
Krishnamurthy, Y.L. Prakasha, H.M. Nanda, A. Krishnappa, M. Dattaraja, H.S. Suresh, H.S. 2010. Vegetation structure and floristic composition of a tropical dry deciduous forest in Bhadra Wildlife Sanctuary, Karnataka, India. Tropical Ecology, 51(2):235-246.
Kuijper, D. P., J. P. Cromsigt, B. Jędrzejewska, S. Miścicki, M. Churski, W. Jędrzejewski, and I. Kweczlich. 2010.“Bottom-up versus Top-down Control of Tree Regeneration in the Białowieża Primeval Forest, Poland.”Journal of Ecology, 98:888-899.
Kumelachew Yeshitla and Tamrat Bekele,(2002). Plant community analysis and ecology of afromontane and transitional rainforest vegetation of Southwestern Ethiopia. SINET: Ethiop.J.Sci., 25 (2):155-175.
Lamprecht, H. (1989). Silviculture in the Tropics: Tropical forest ecosystems and their tree species possibilities and methods for their long-term utilization. Federal Republic of Germany, Eschborn. Leul Kidane, Tamrat Bekele and Sileshi Nemomissa,(2010). Vegetation Composition in
Hugumbirda-Gratkhassu National Forest Priority Area, South Tigray. MEJS, 2(2):27-48.
Martin, G.J. (1995). Ethnobotany: a Methods Manual. Chapman and Hall, London, UK,268p.
McIntosh, R.P. (1985). The background of ecology. Cambridge University Press, Cambridge, UK.
Mekuria Argaw, Demel Teketay and Olsson M. (1999). Soil seed flora, germination and regeneration pattern of woody species in an Acacia woodland of Rift Valley in Ethiopia. J.Arid Environment,
43:411-435.
Melkamu Terefe Asmare and Abdella Gure, 2019. Effect of exclosure on woody species diversity and population structure in comparison with adjacent open grazing land: the case of Jabi Tehnan district north western Ethiopia. Ecosystem Health and Sustainability, 5(1):98-109.
Mesfin Tadesse (2004). Asteraceae (Compositae).In: Hedberg I,Friis I,Edwards S,eds. Flora of Ethiopia and Eritrea (vol.4.2). Addis Ababa and Uppsala: The National Herbarium. 408p.
Mligo, C. (2015). The impact of livestock grazing on soil characteristics in Mount Kilimanjaro, Tanzania.
Journal of Geoscience and Environment Protection, 3:24-37.
Molla Mekonnen, Kindeya Gebrehiwet, Emiru Birhane & Sara Teweldeberhan, (2010). Impact of Interference on Species Diversity of Large Wild Mammals in Awash National Park, Ethiopia.
Journal of the Drylands, 3(1):181-188.
Mueller-Dombois, D. and Ellenberg, H. (1974). Aims and methods of vegetation ecology. New York: John Wiley & Sons.547p.
Mwavu, E.N and Witkowski, Ed. T.F. 2009. Population structure and regeneration of multiple-use tree species in a semi-deciduous African tropical rainforest: Implications for primate conservation.
Forest Ecology and Management, 258: 840-849.
Nagamatsu, D., Kenji, S., & Akiko, S. (2002). Seedling Establishment of Deciduous Trees in Various Topographic Positions. Journal of Vegetation Science, 13:35-44.
Norden, N., R. C. Mesquita, T. V. Bentos, R. L. Chazdon, and G. B. Williamson. 2011. “Contrasting Community Compensatory Trends in Alternative Successional Pathways in Central Amazonia.”
Oikos, 120:143-151.
Phillips, S (1995). Poaceae (Gramineae). In: Hedberg I. and Edwards S., Eds. Flora of Ethiopia and Eritrea. AddisAbaba, Ethiopia; Uppsala; Sweden.438p.
Pokhriyal. P., Uniyal, P., Chauhan, D.S. & Todaria, N.P. (2010). Regeneration status of tree species in forest of Phakot and Pathri Rao watersheds in Garhwal Himalaya. Current Science, 98:171-174. Premavani, D., NAIDU, M.T., Venkaiah, M., 2014. Tree species diversity and population structure in the
tropical forests of north central Eastern Ghats, India. Not. Sci. Biol. 6 (4),448e453.
Samson Shimelse, Tamrat Bekele and Alemayehu Mengistu, (2010). Floristic Diversity and Structure of Nechisar National Park, Ethiopia. Journal of the drylands, 3(1):165-180.
Sarkar, M. & Devi, A. (2014). Assessment of diversity, population structure and regeneration status of tree species in Hollongapar Gibbon Wildlife Sanctuary, Assam, Northeast India. Tropical Plant Research, 1(2):26-36.
Saxena, A. K., & Singh, J. S. (1984). Tree Population Structure of Certain Himalayan For-est Associations and Implications Concerning Their Future Composition. Vegetation,58:61-69.
Schulz, B.K., Bechtold, W.A. and Zarnoch, S.J. (2009). Sampling and estimation procedures for the vegetation diversity and structure indicator. General Technical Report PNW-GTR-781.United States Department of Agriculture, Forest Service.2p.
Sharma, V., and Chaudhry, S. 2018. “Vegetation Composition and Plant Diversity in Mining Disturbed Tropical Thorn Forest of Asola-Bhatti Wildlife Sanctuary, Northern India.”Taiwania, 63 (3):267-280.
Simon Shibru, & Girma Balcha, (2004). Composition, Structure and Regeneration Status of Woody Plant Species in Dindin Natural Forest, Southeast Ethiopia: An Implication for Conservation. Ethiopian Journal of Biological Science, 3:15-55.
Swamy, P.S. 2000. Plant species diversity and tree population structure of a humid tropical forest in Tamil Nadu, India. Biodiversity and Conservation, 9:1643-1669.
Tamrat Bekele, (1994). Phyosociology and Ecology of Humid Afromontane Forest on the Cen-tral Plateau of Ethiopia. Journal of Vegetation Science, 5:87-98.
Temesgen, Mekonen, Ayele Belayneh, Ashagrie Yeshanew,2015. Woody plant species diversity, structure and regeneration status of Woynwuha natural forest, North West Ethiopia. Asian J. Ethno
Pharmacol. Med. Foods, 01(01):3e15.
Tesfay Atsbha, Anteneh Belayneh Desta,Tessema Zewdu. (2019). Woody species diversity, population structure, and regeneration status in the Grat-Kahsu natural vegetation, southern Tigray of Ethiopia.
Heliyon, 5:e01120,25p.
Tesfaye Bogale, Demeke Datiko, Shiferaw Belachew, (2017b). Structure and Natural Regeneration Status of Woody Plants of Berbere Afromontane Moist Forest, Bale Zone, South East Ethiopia; Implication to Biodiversity Conservation. Open Journal of Forestry, 7:352-371.
Tesfaye Burju, Kitessa Hundera & Ensermu Kelbessa, (2013). Floristic Composition and Structural Analysis of Jibat Humid Afromontane Forest, West Shewa Zone, Oromia National Regional State, Ethiopia. Ethiopian Journal of Education and Science, 8(2):11-33.
Tiwari, G. P. K., Tadele, K., Aramde, F. and Tiwari, S. C. (2010). “Community structure and regeneration potential of shorearobusta forest in subtropical sub-montane zone of Garhwal Himalaya,India. ”Nature and Science, 8:70-74.
Tripathi, R. S., & Khan, M. L. (2007). Regeneration Dynamics of Natural Forests. A Review, Proceedings of the Indian. National Science Academy, 73:167-195.
WCMC (1994) Biodiversity Data Sourcebook. World Conservation Monitoring Centre, World Conservation Press, Cambridge.
Yalden, D. and Largen, M. (1992) Endemic Mammals of Ethiopia. Mammal Review, 22:115-150.
Appendix 1: Natural regeneration status of woody species in KSNP (MD =Mature density, SD=Seedling density (Stem ha−1) and SPD =Sapling density; regeneration status (RS) (G = Good, F = Fair, and P = Poor) and N=None regenerating
Scientific name (Species) Family Habit SD SPD MD RS
Acacia albida Del. Fabaceace tree 0 0 0.31 None
Acacia etbaica Schweinf Fabaceae tree 0 0 0.78 None
Acacia lahai Steud. & Hochst.ex Benth. Fabaceae tree 0 0 0.94 None
Acacia mellifera (Vahl) Benth. Fabaceae tree 2.2 3.8 69.7 Fair
Acacia oerforta (Forssk.) Schweinf. Fabaceae shrub 0.9 3 26.4 Fair
Acacia polyacantha Willd. Fabaceae tree 0.8 1.6 7.19 Fair
Acacia senegal (L.) Willd. Fabaceae tree 0.5 3.8 24.8 Fair
Acacia seyal Del. Fabaceae tree 0 0.9 5.31 Poor
Acacia sp.Mart Fabaceae tree 0 0 1.72 None
Acacia tortilis (Forssk.) Hayne. Fabaceae tree 0 0 1.25 None
Adansonia digitata (L.) Bombacaceae tree 0 0 4.22 None
Anogeissus leiocarpus (DC.) Guill. & Perr. Combretaceae tree 0 0 11.1 None Balanites aegyptiaca (L.) Del. Balanitaceae tree 1.1 7.7 29.4 Fair Boscia angustifolia var. angustifolia A. Rich. Capparaceae tree/ shrub 0 0 1.09 None Boswellia papyrifera Hochst. ex A. Burseraceae tree 0.6 1.7 27.8 Fair
Brucea antidysentrica J.F. Simaroubacea tree 0 0 0.47 None
Buddleja polystachya Fresen. Loganiaceae Shrub 0 0 0.31 None
Burkea africana Hook. Caesalpiniaceae tree 0 0 3.28 None
Cadaba farinosa Forssk. Capparaceae shrub 0 0 0.94 None
Calotropis procera (Aiton) W.T.Aiton. Asclepiadaceae tree 0 0 2.19 None
Capparis decidua (Forssk.) Edgew. Capparaceae tree 0 0 0.63 None
Carissa edulis (Forssk.) Vahl. Apocynaceae shrub 0 0 1.72 None